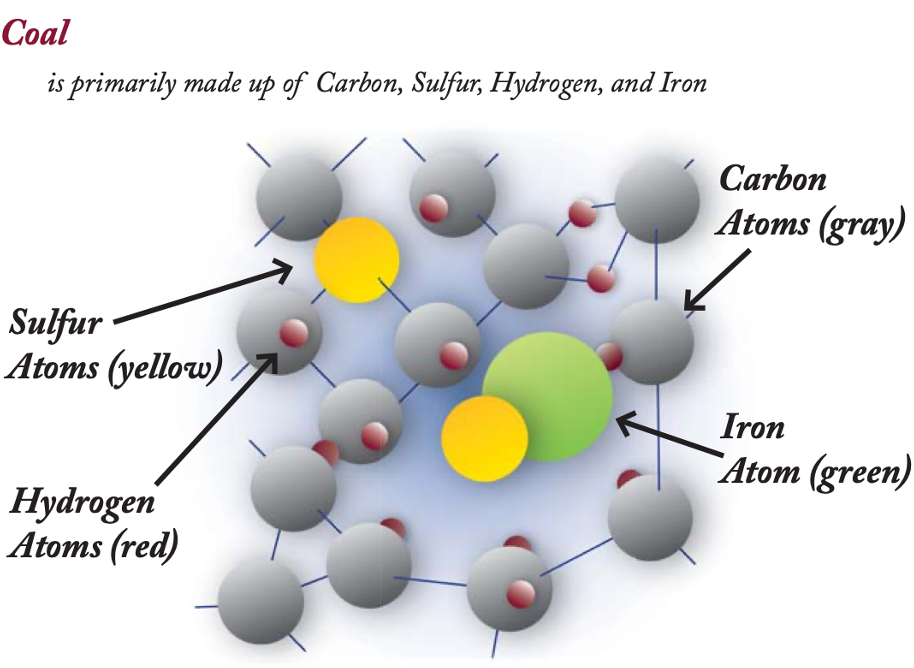
Conventional fuels, including coal provide most of the power needed to sustain our high quality of life. During 2022 coal use in the world reached a new high and provides the fuel for about 35.4% of the world’s electricity generation. Asia’s electricity generation was 82% from coal fuel in 2022(40, 41)
Meanwhile, the current U.S. government policy, green religion, renewable energy policies and crushing regulations are geared toward electrifying everything. Including transportation. The emphasis on phasing out internal combustion engines for autos is well publicized. This outlawing without Congressional action of internal combustion engines in spite of the majority of Americans desire to keep gasoline and Diesel powered vehicles seems unlawful to me? Then, on Good Friday Biden’s EPA issued new rules on electrifying heavy trucks. The EPA is out of touch, not only with their purpose of protecting human health, but also with Physics, Thermodynamics and Reality. The Demand for electricity is increasing because of increased use by Data Centers, EV’s and the natural organic growth of electricity as people of the world are lifted from poverty.(60) The surge in EV Demand has not really been felt yet because EV’s are still a small percentage of the total U.S. vehicle fleet.

The EPA is on a mission to kill coal plants regardless of the harm to our country, it is a rogue government agency, staffed by extremists, guided by extremists in the Biden Administration that are using the regulations as a weapon against the Best interests of America and the citizens. (1, 2, 3, 4, 5, 6) America needs to use all fuels which are within our borders and including coal. America is the Saudi Arabia of coal and has the highest quality & richest coal deposits on planet earth. We should use this God given Primary Energy Treasure to keep America strong.

The lure of billions of dollars in tax subsidies has made otherwise well run organizations and corporations to become “Woke & Green Biased”. It is extreme fantasy to believe that wind and solar can power the economies of Developed Countries. Yet, policies of many otherwise well run companies and organizations, even when they employ well trained and experienced engineers that know better, promote the “Green narrative. One example of this green wokeness is the “PowerGen” Conference. This conference was one of my favorites and I have been a presenter for decades since the 1980’s. In January I was asked by a Utility engineer friend, Mark Barton, along with two other senior power engineers, Frank Mitchell and John Grusha, to serve on a panel. The title of the Panel: “Legacy Perspective of 100 Years of Power Generation Experience”. I wrote my take aways here. (35) Frank Mitchell, retired from AEP and now active as an independent consultant also has published many technical papers on power generation. One entitled, “Analysis of Variable Renewable Energy and Reserve Margins” is available from the ASME. (36) Suffice it to say, the panelists involved do not agree with the Net-Zero Carbon path our country is on. We are not alone.

Also hard to understand is the well respected POWER Magazine embracement of renewable power to “Electrify Everything”. Here is an excerpt from this month’s POWER Magazine. This is written by Matt Helgeson, head of Sustainability for Siemens USA. (8) He also should know better.
“The “electrification of everything” is
underway to not only decarbonize,
but also support optimized, safer and
more resilient processes and systems.
This concept means that we are replacing
our fossil fuel economy with wind,
solar, hydro, electric vehicles (EVs), heat
pumps, and more. This transformation
will be made possible—at scale—with
the application of digital technologies.
However, the challenge arises to electrify
everything before the grid is fully “green”
if we are going to appropriately and effectively
address climate change.
From electrifying buildings and vehicles,
and navigating the impact to the
grid, the technology to accomplish a fully
electric transformation is available today.
And now’s the time to utilize these technologies
to ensure that everything that
can be connected to the grid is electrified.
We’re running parallel races to transition
power generation to renewable sources,
improve the grid to manage those sources,
and replace infrastructure that’s ready
to use the power delivered to it.
Electrification of Transportation
An exciting and rapidly advancing industry
transformation is the electrification of transport.
According to Car and Driver, 2024 is
expected to set a new record for EVs sold
and their share of the total market. Further,
the EV market is projected to have a compound
annual growth rate of about 10%
projected through 2028, leading to more
than $900 billion in sales that year.
As the need to reduce carbon emissions
has become clear, we’re seeing
unprecedented support and funding from
the federal government to deploy EV infrastructure.
State and local governments”
Dick Storm’s Love of Power, Articles and Commentary in POWER Magazine….
POWER Magazine has been my favorite power generation magazine since 1959 when I was a teen and just beginning preparation for a career I loved in power generation. I was inspired by Steve Elonka’s fictional character “Marmaduke Surfaceblow” who was a “Globe Trotting Consulting Engineer” that solved power engineering problems around the world. I wanted to become an engineer like Marmaduke Surfaceblow. I pretty much succeeded in that goal. Thank you POWER for the inspiration! Later in my career I was a contributing editor to POWER Magazine where I shared the Storm Technology team’s experiences in improving combustion and efficiency. As recent as 2021, my commentary was published in POWER, which I still believe and stand behind. (9) Linked Here and it is a contrast with the Siemens commentary this month. A few other POWER articles I contributed are listed below in the references. (9, 10, 11, 12, 13, 14, 15, 16) I remain very proud of what I did to make a small contribution of helping generate reliable, efficient and clean coal power. Yes, I remain a friend of coal! And so should all Americans embrace coal, oil, gas and uranium use, all are fuels that are capable of being produced in the quantities we need from within our borders. More later on the need for 833,000-1,000,000 Btus per day/person to power our economy and our lives.
Reminder of the vast coal reserves in the U.S. and on the planet.

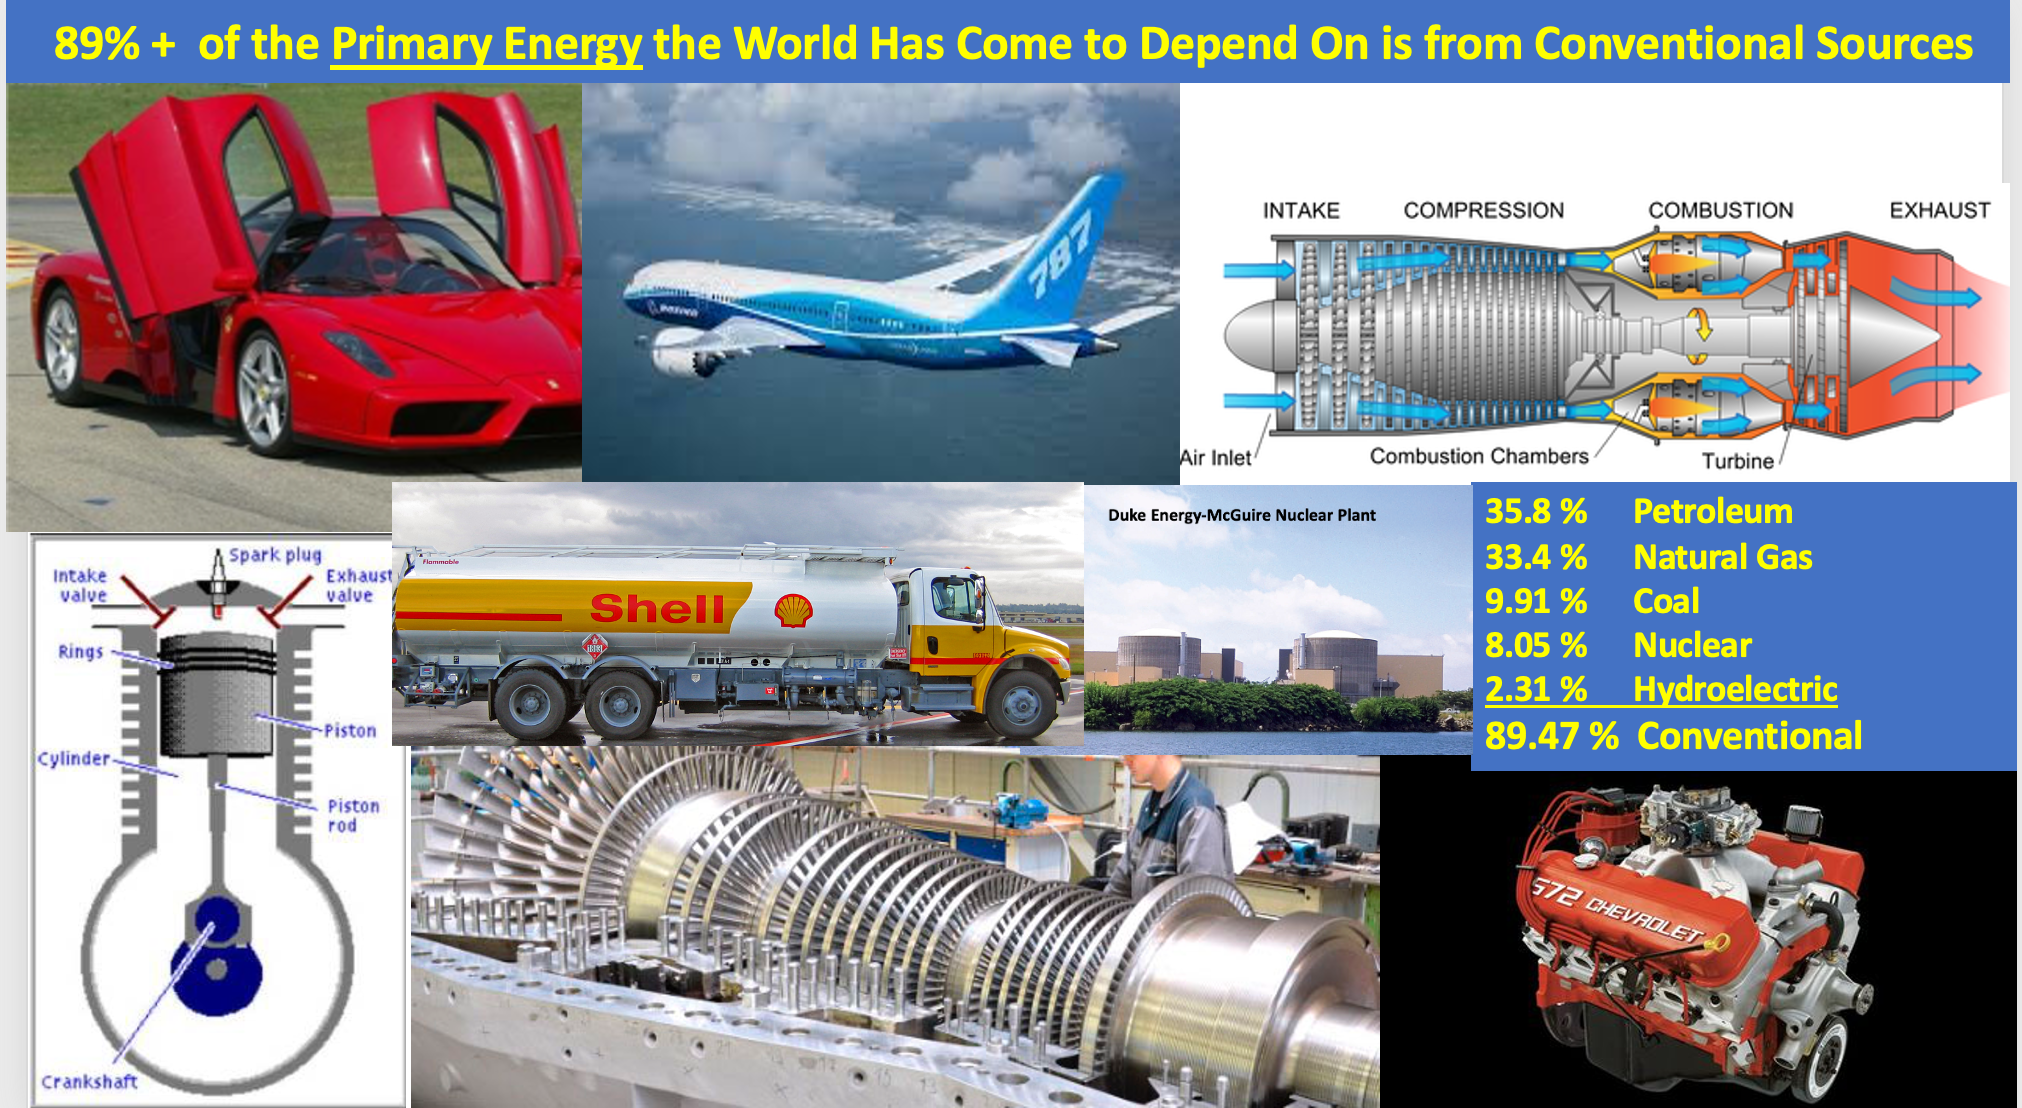
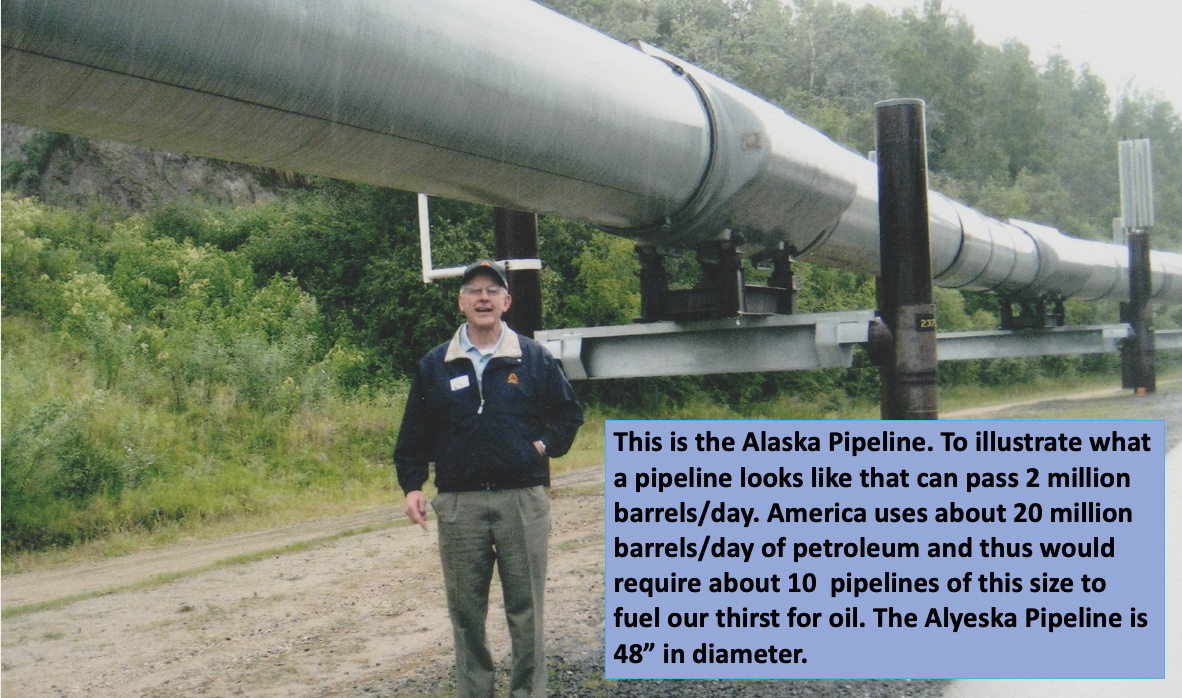
Getting back to the reality of Primary Energy and the sources of Primary energy that can meet our needs:
Meet Energy Reality
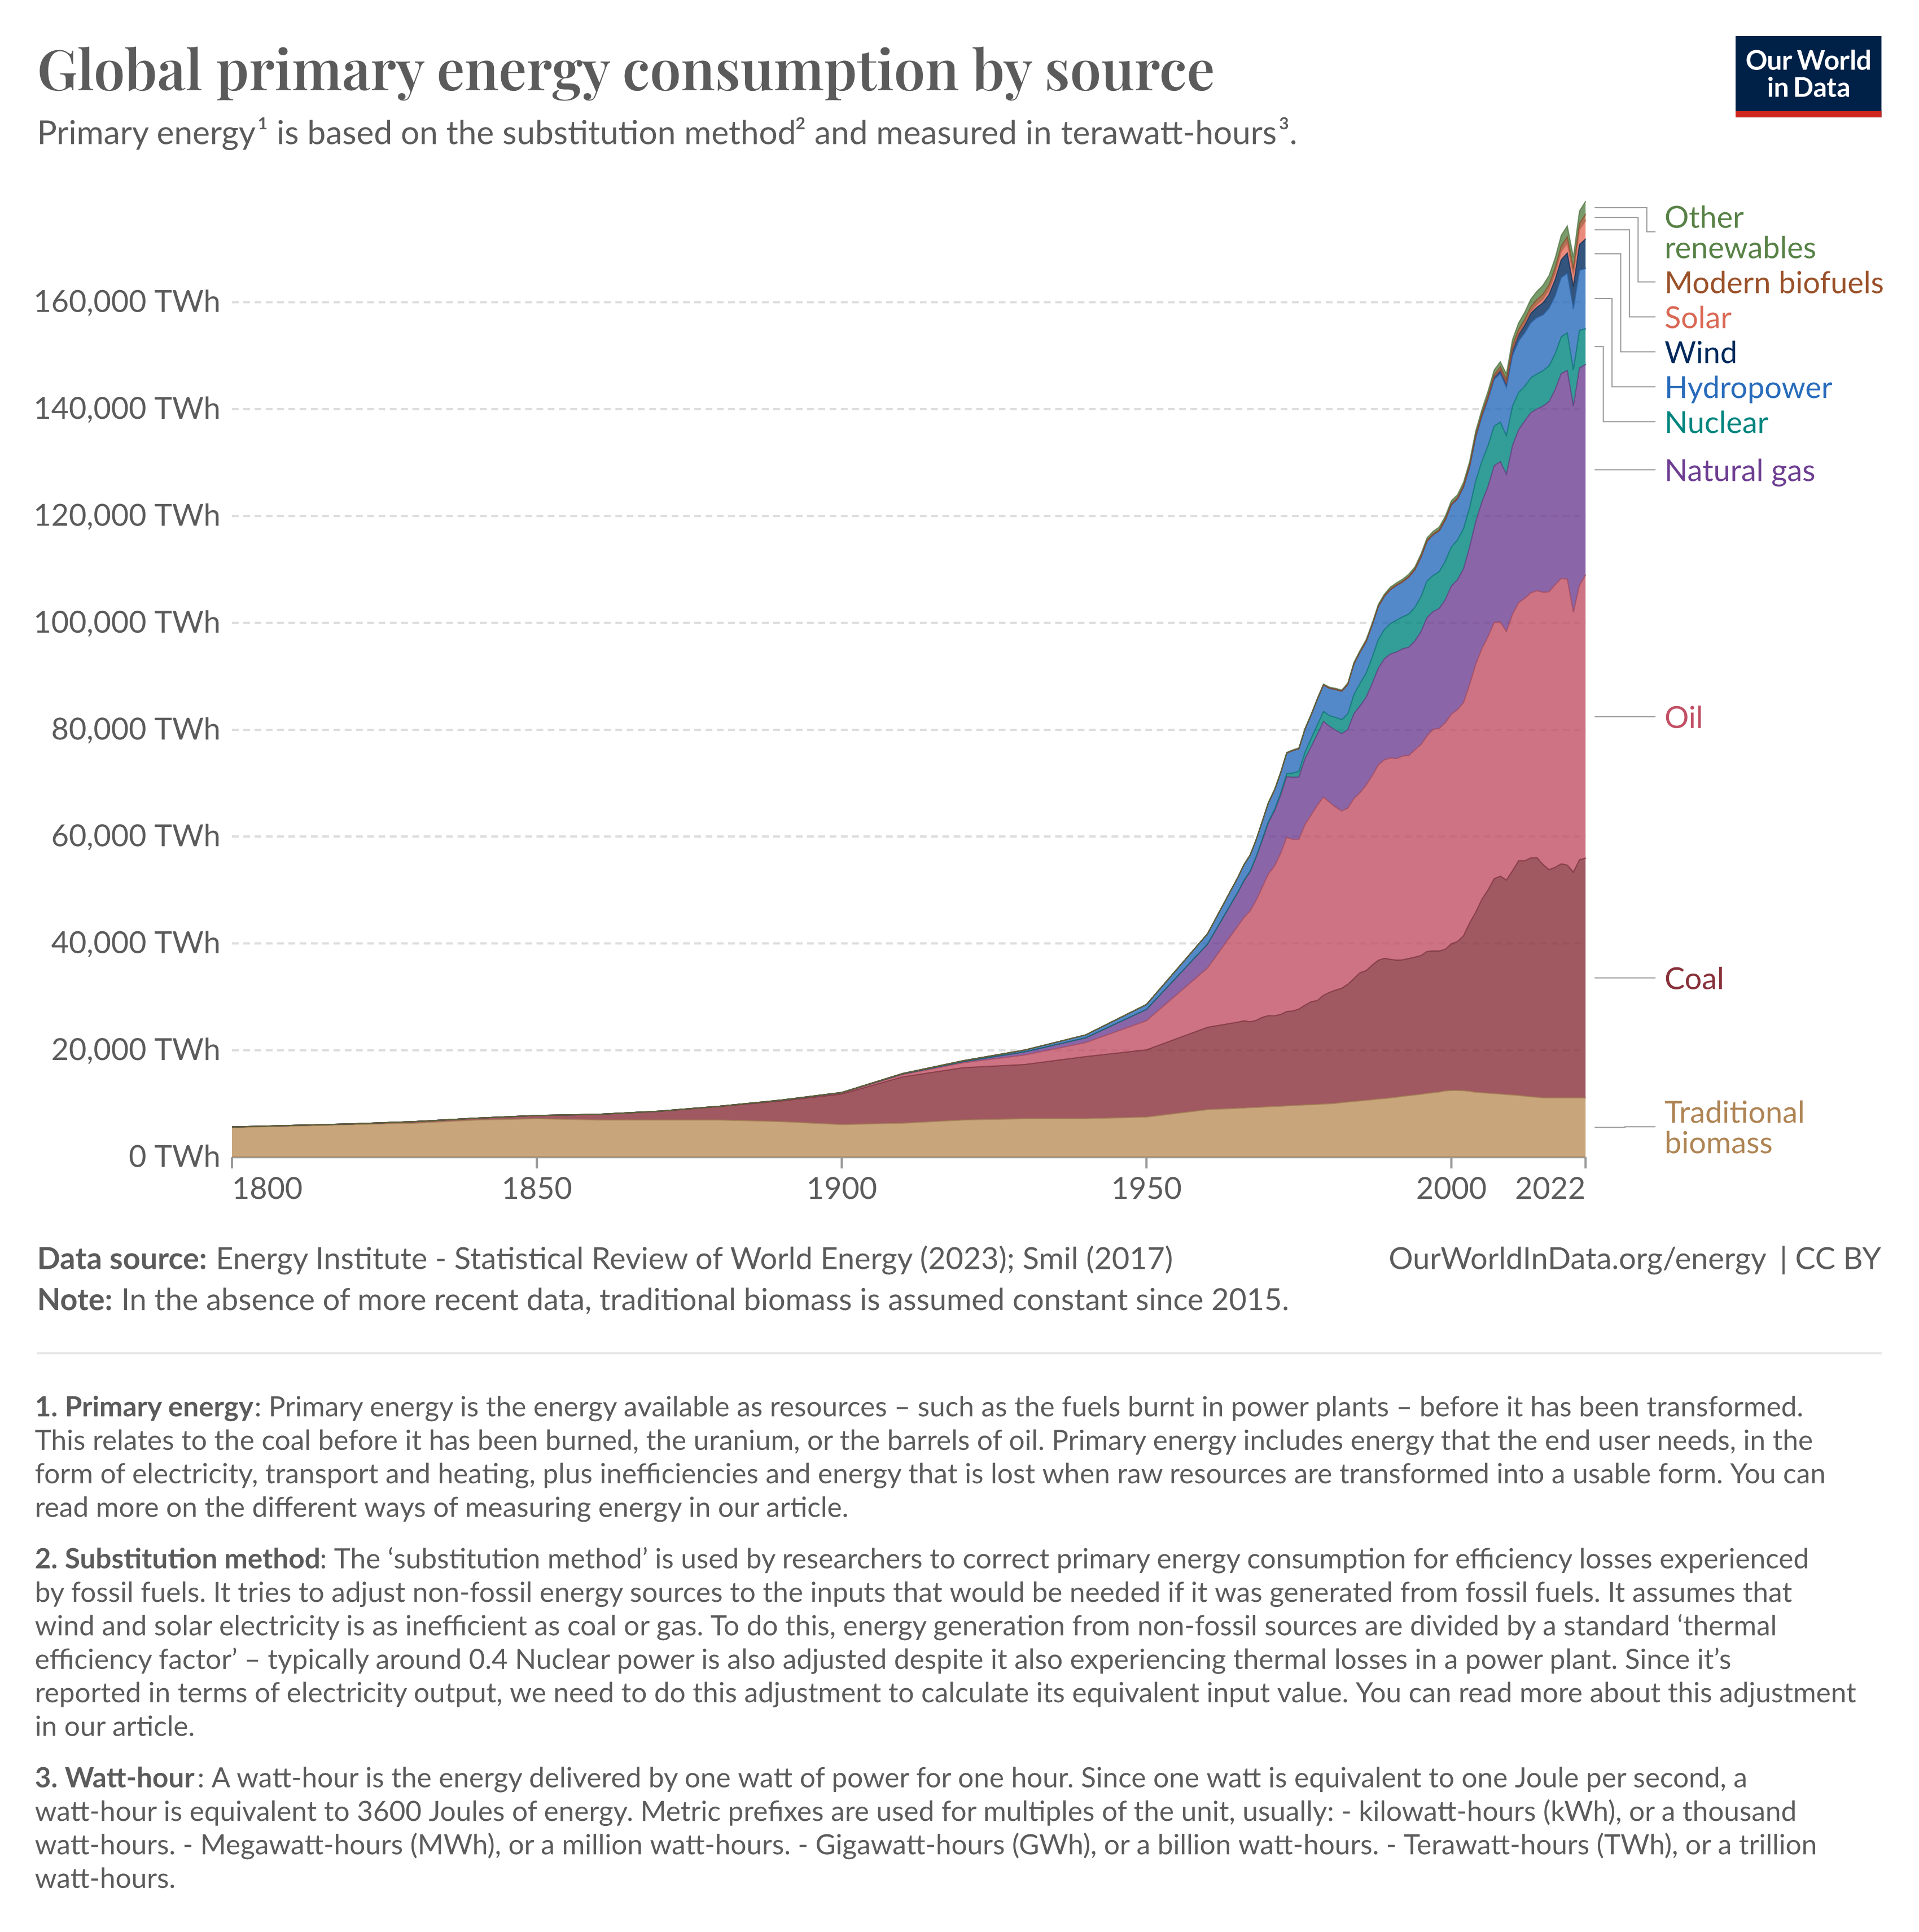
America uses right at 100 Quadrillion Btus of energy each year. This is likely to increase, that is if we maintain our high quality of life, over time. The IEA believes that with increased Data Center consumption, electricity growth will likely be over 3.4%/year. (67) Also, with more electrification, large new Data Centers, more EV’s and a growing population, Demand for electricity will grow. The entire world uses about 600 Quadrillion Btus of energy. These amounts of U.S. and world energy use are reported by numerous references. Amongst them, the IEA, EIA, Our World in Data and the Energy Institute. Most of the rest of the world is using coal. The greatest amount of coal ever used in history was the year 2023.
I have written on the 100 Quadrillion Btus that the US uses on a previous blog posts Here, Here, Here Here and Here(17, 18, 19, 20)
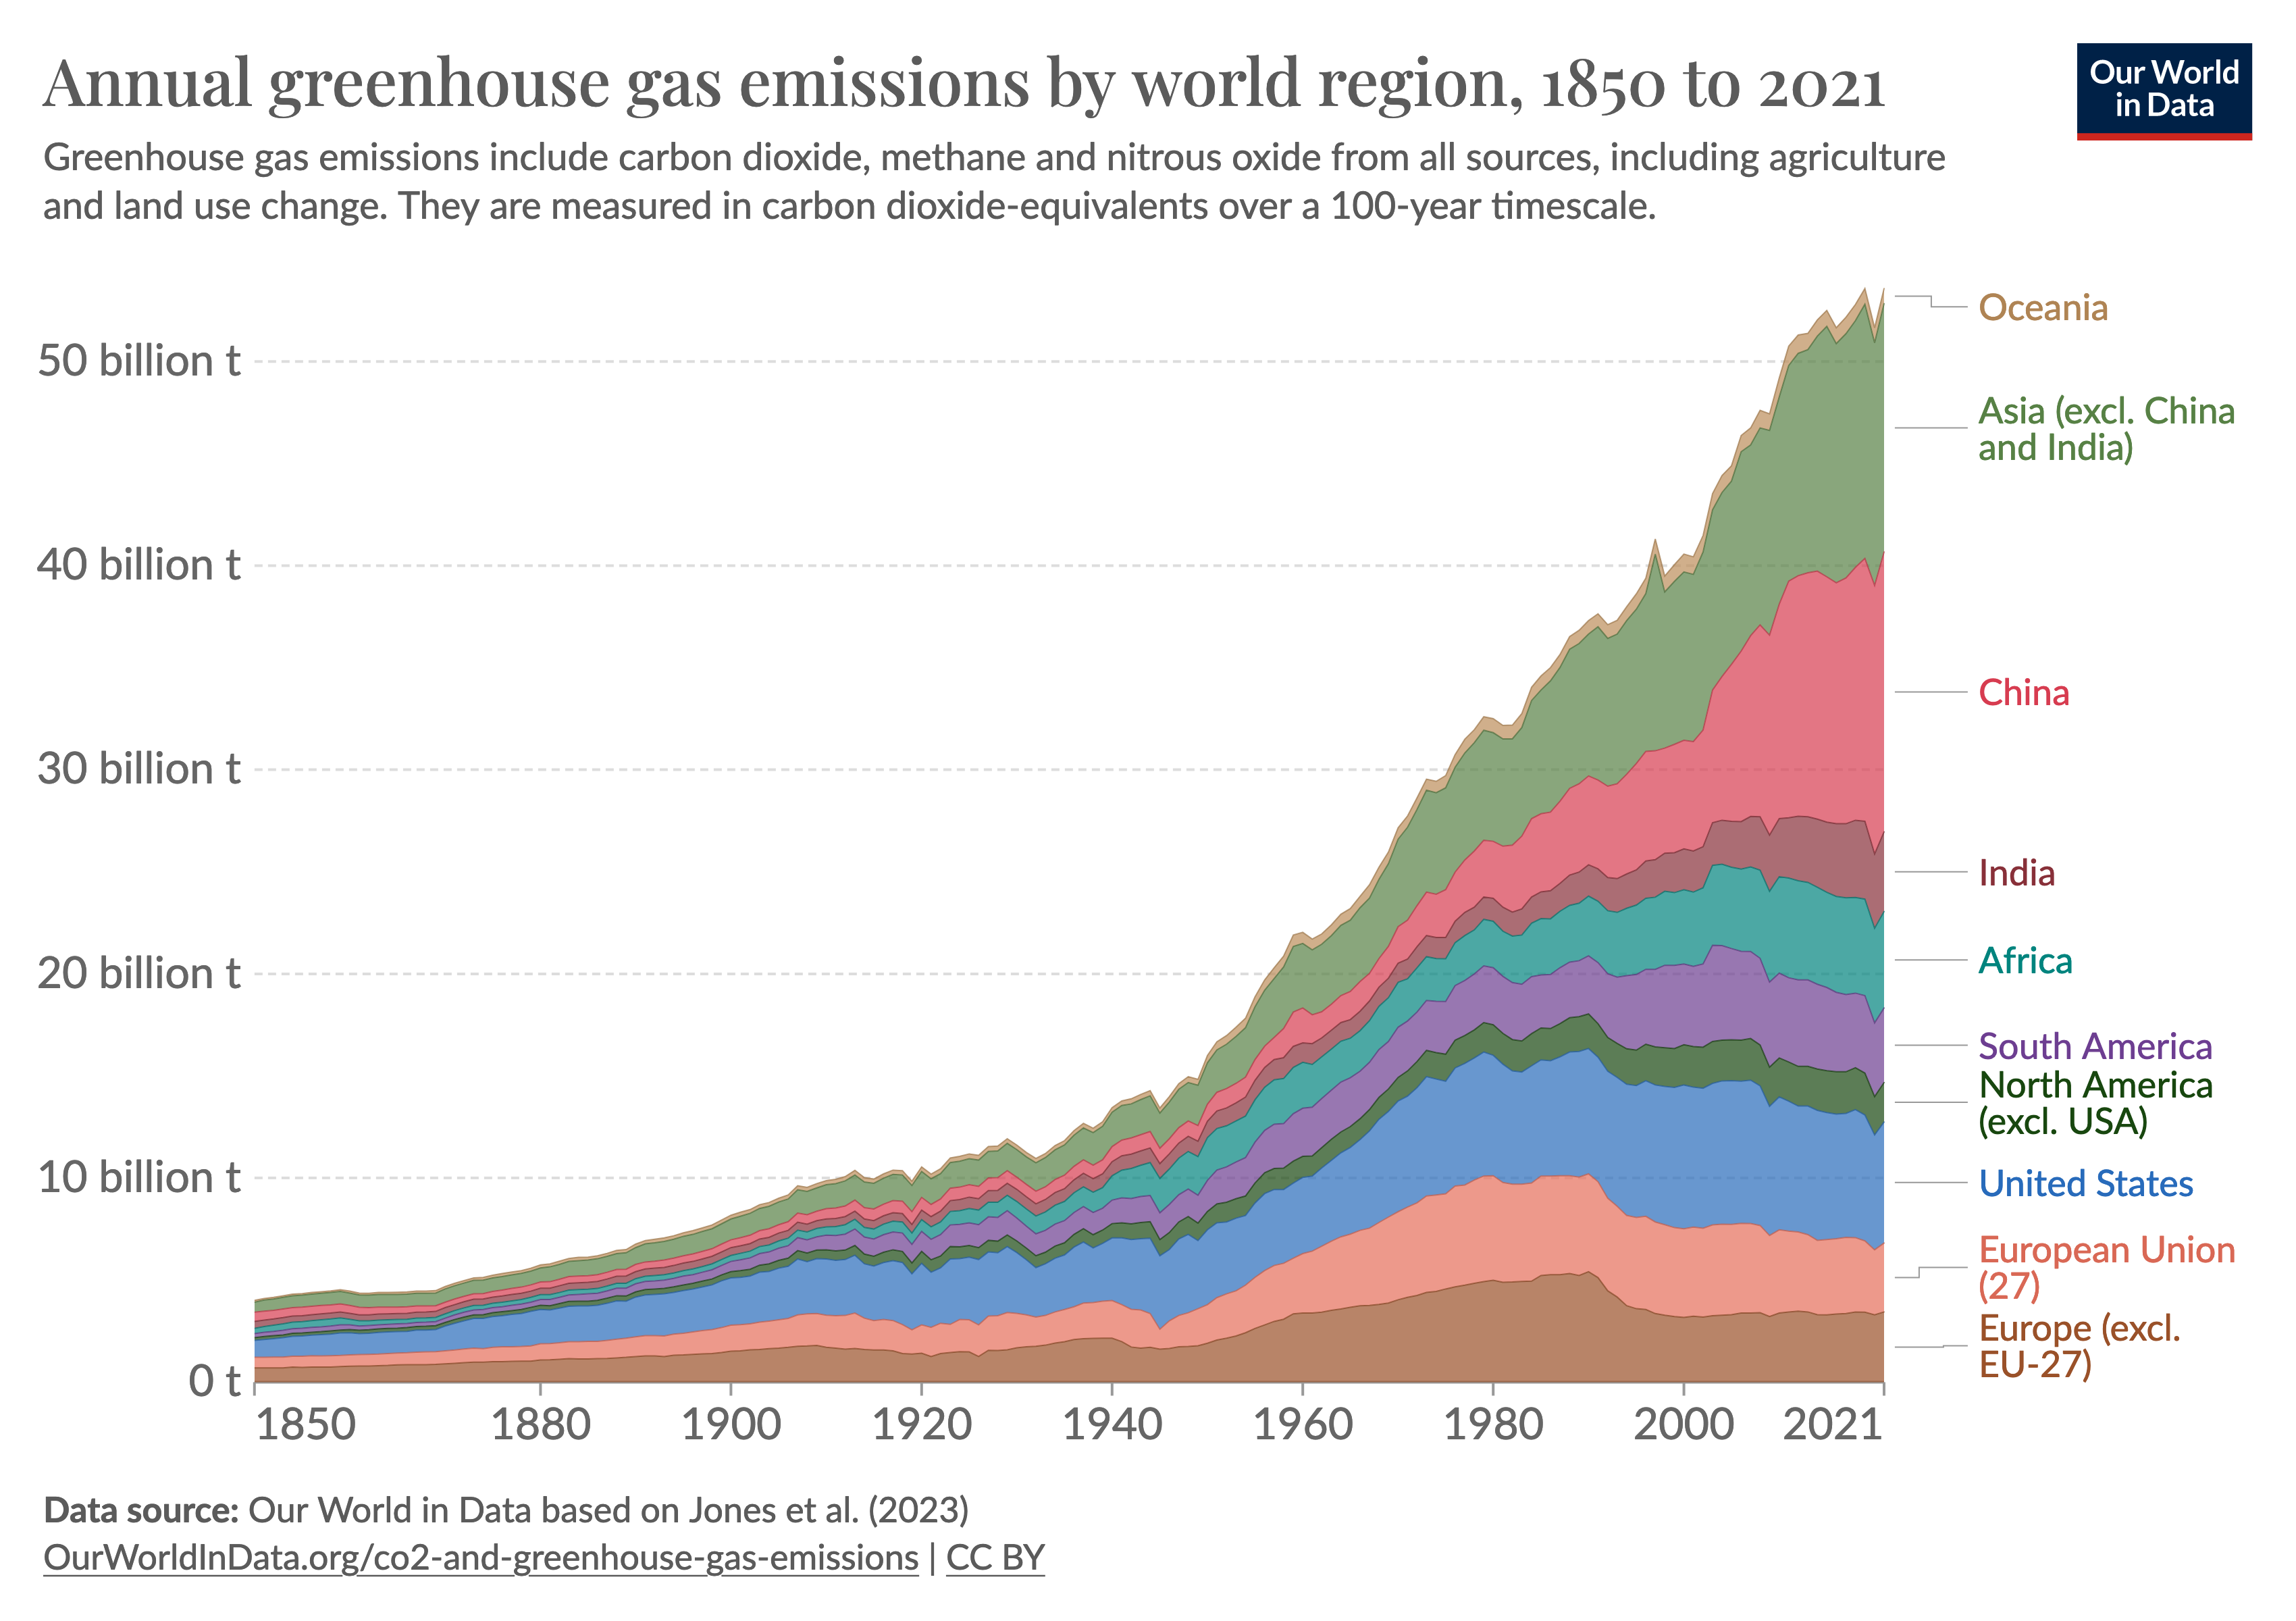
The “Count on Coal” Blog article quoting a conversation with worldwide energy expert, Daniel Yergin, sums up the energy transition very accurately. (27) Yergin’s comments are supported by the “Our World in Data” world energy use chart above and numerous other references included at the end. An excerpt from the Count on Coal Blog is copied below. The bold font and underlining is my emphasis:
“Renowned energy analyst and historian Dan Yergin recently observed that the world isn’t just using more coal than ever before but three times what it did in the 1960s. While Yergin recognizes significant changes in the global energy mix, he said, “I’m sick of the energy transition discussion. It sometimes loses touch with economic history and reality. If you look at the history of energy transitions, they all last for over a century. To try and make change happen in 25 years, or even half of that time is highly unlikely.”
For Yergin – and energy analysts the world over – the coal age has miles to run. The International Energy Agency (IEA) expects coal consumption in India and Southeast Asia to in fact “grow significantly.”
By 2026, the IEA expects just China and India together to account for 70% of global coal demand. Those two nations and Indonesia opened 59 gigawatts of new coal generating capacity last year. India has 85 GW of new coal generating capacity already under construction with more expected.
Both China and India are rapidly adding renewable energy but see coal as essential to helping meet rising power demand and view it as an energy security and reliability backstop. China is on track to add 200 GW of new coal capacity by 2030. For comparison, that’s more new capacity than the entire existing U.S. coal fleet.
As Dan Yergin observed, we need a better energy transition discussion. Globally, we remain firmly in an era of energy addition. Just ask China and India. “
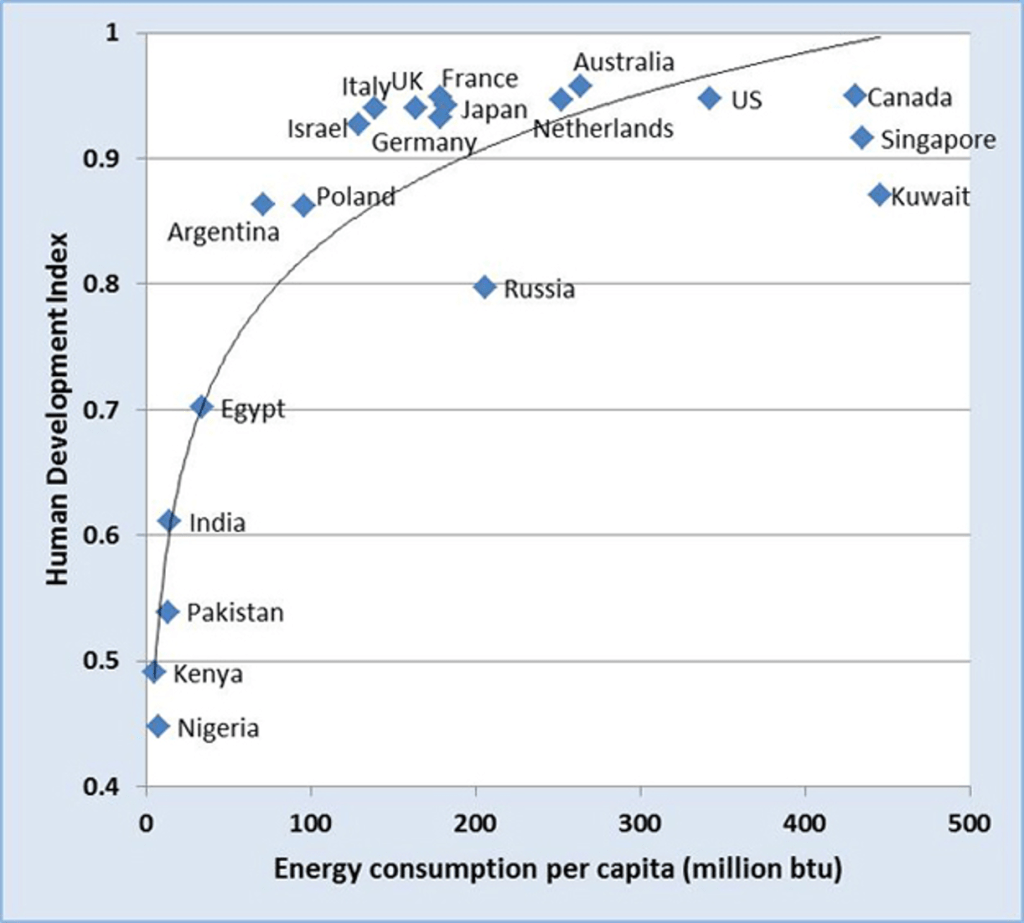
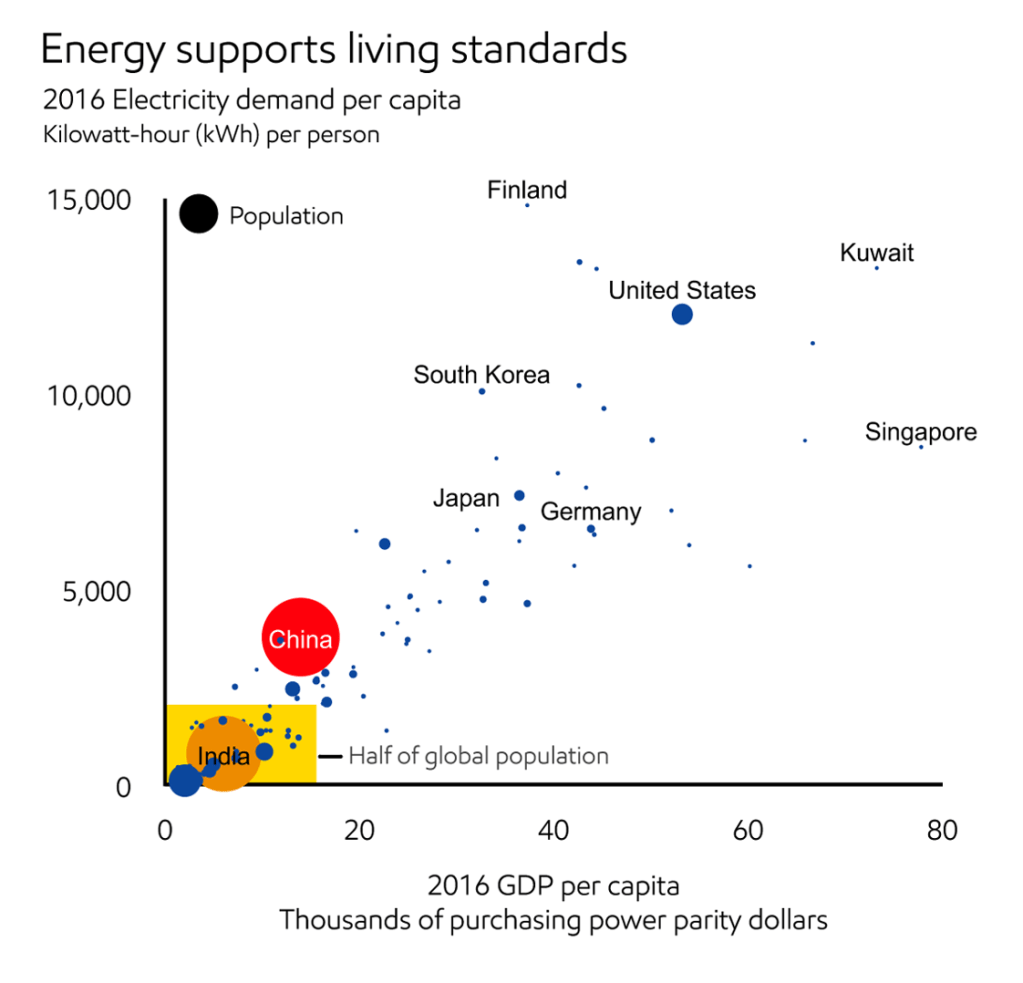
Energy provides life as we know it
China and India are rising as economically prosperous nations and they are doing so powered by all available sources of energy, including coal.(33, 34, 65) We in America should do likewise. The last new highly efficient and clean coal plants built in America started up in 2013. We have not built a major coal plant in the U.S. in over twelve years. However, hundreds have been shut down without replacing the reliable, affordable and dispatchable generation capacity in kind. (28,29, 30, 68)
Electrifying Everything is Not Possible
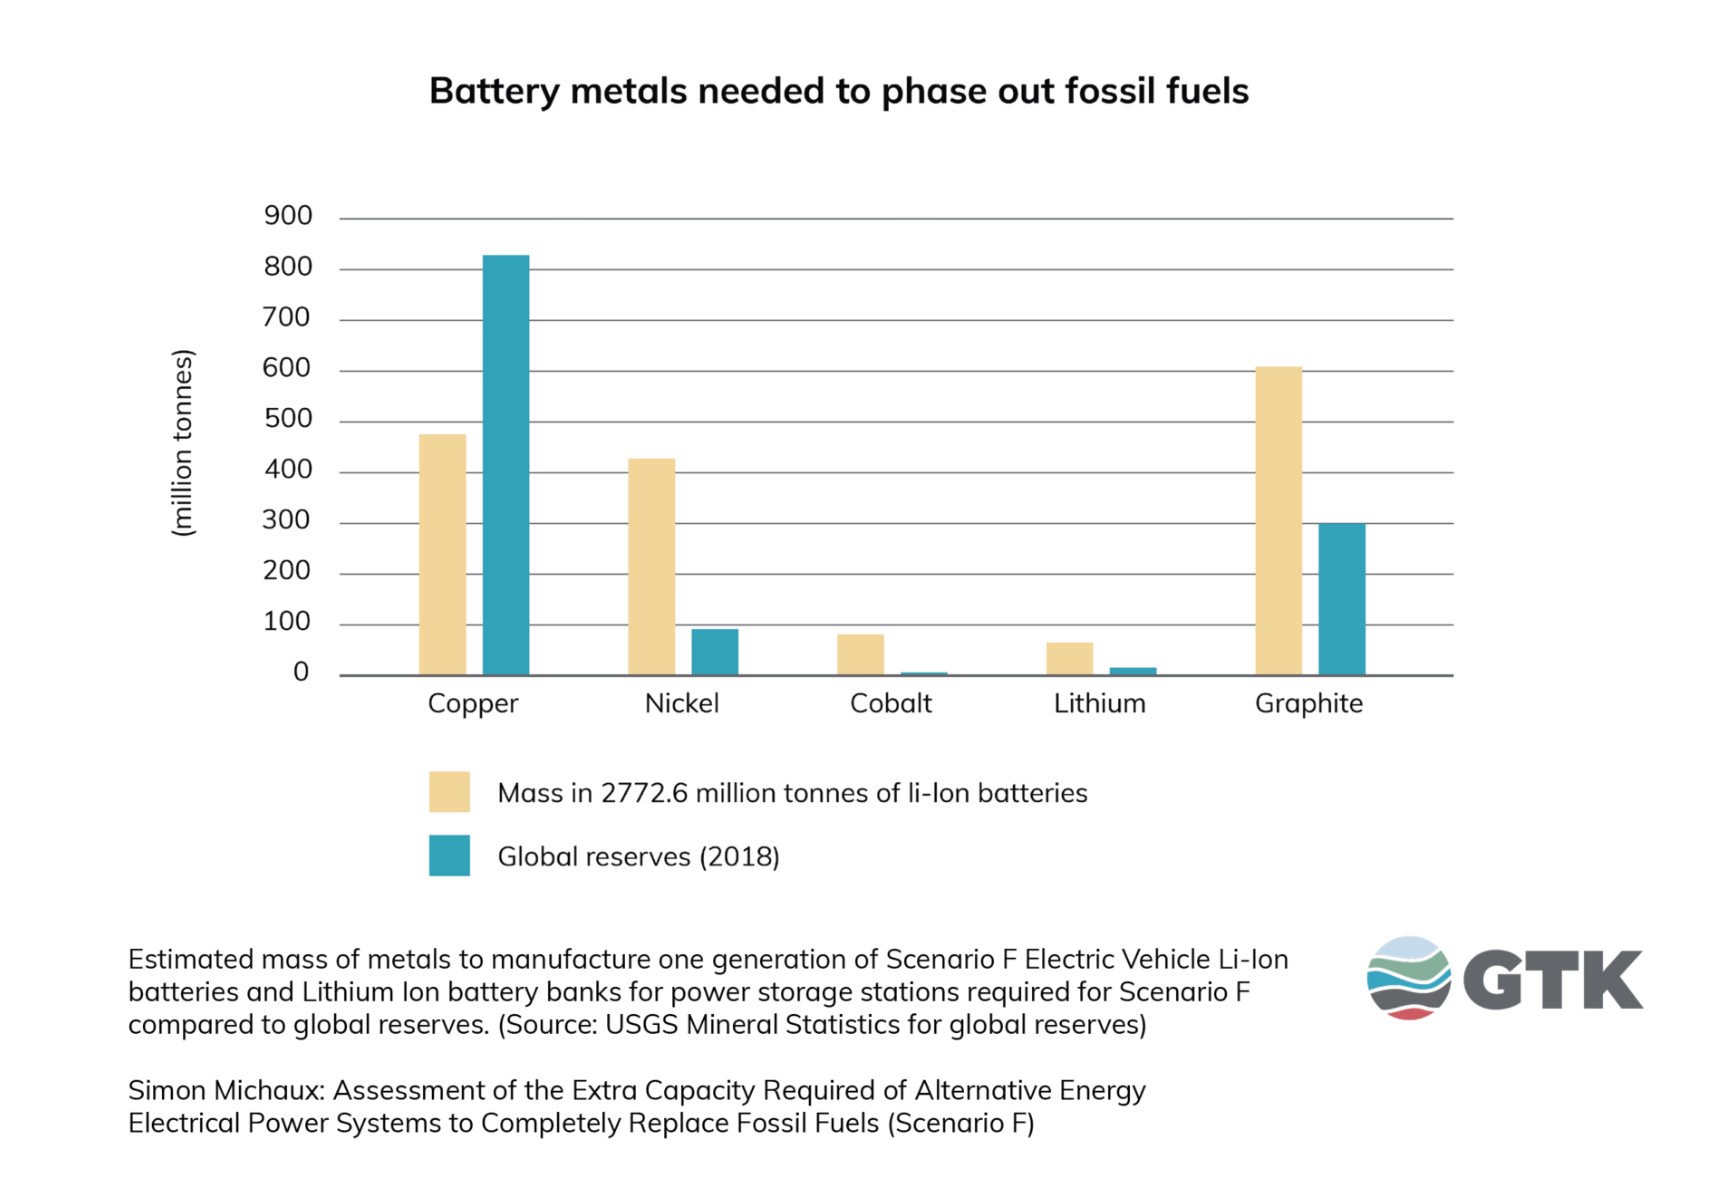
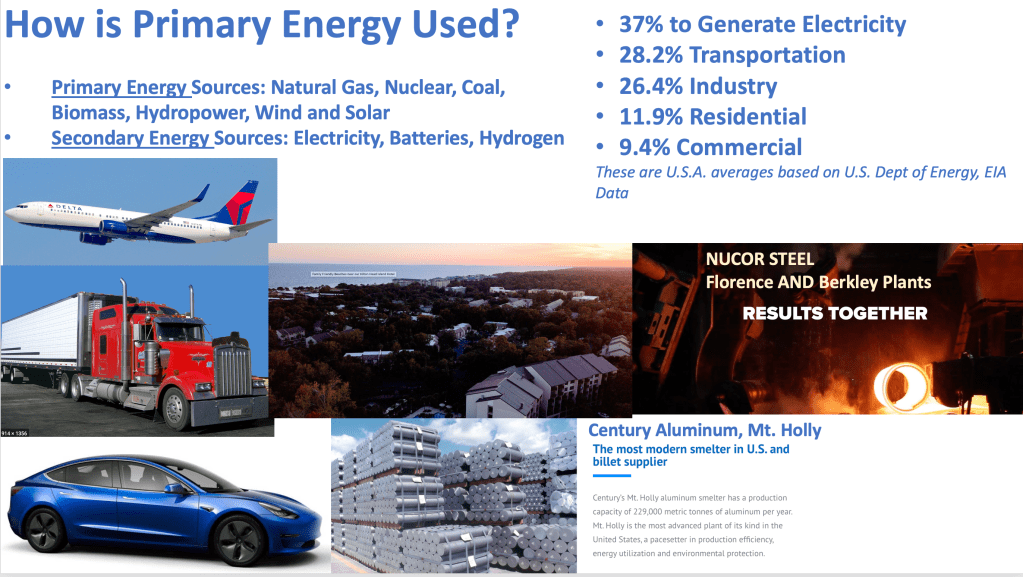
To say Electrifying Everything is possible, is a ludicrous fantasy and a lie. More politely, but factually it simply is not possible. (25) For example: Ammonia, Food production, Steel, Plastics, Aluminum and Concrete all are dependent on vast amounts of Primary Energy for production. It is not an exaggeration to say Energy = Life.(25)
Further, for all of the talk on the news about inflation and the rising cost of living, this inflation, in my opinion, is based largely on the government climate policies (more correctly described as a war on carbon) that are making it harder to produce Primary energy from conventional sources and also, forcing more expensive, less reliable, variable, intermittent, renewable energy on all of us. The so called, “Energy Transition” is not a transition, it is only a “War on Carbon and Conventional Forms of Energy” Daniel Yergin said it and so did I in previous Blog posts and presentations. (28, 29, 30, 31, 32, 68) A previous article I wrote used Hawaii as an example. The Islands of Hawaii are an excellent case study in applying green only power generation. Why? Because Hawaii has plenty of sunlight and wind and it is separated from the U.S. Grid. Therefore, as the green only generation is built, with Diesel fuel backup, then the natural and high cost of intermittent green power is experienced by more use of expensive Diesel fuel. Hawaii is an ideal “Science Experiment” in using Green Power. (38)
833,000-1,000,000 Btus of Primary Energy/Day/Person
This is how much primary energy we have become accustomed to having available and at a reasonable cost. Replacing this quantity of reasonable cost, reliable and abundantly available conventional energy with renewables as stated before, is impossible. To attempt to decarbonize America will contribute to the decline of our quality of life and even worse, contribute to the decline of America. Here below is the U.S. Energy Flow Chart for Primary Energy. Prepared by the Lawrence Livermore National Laboratory.

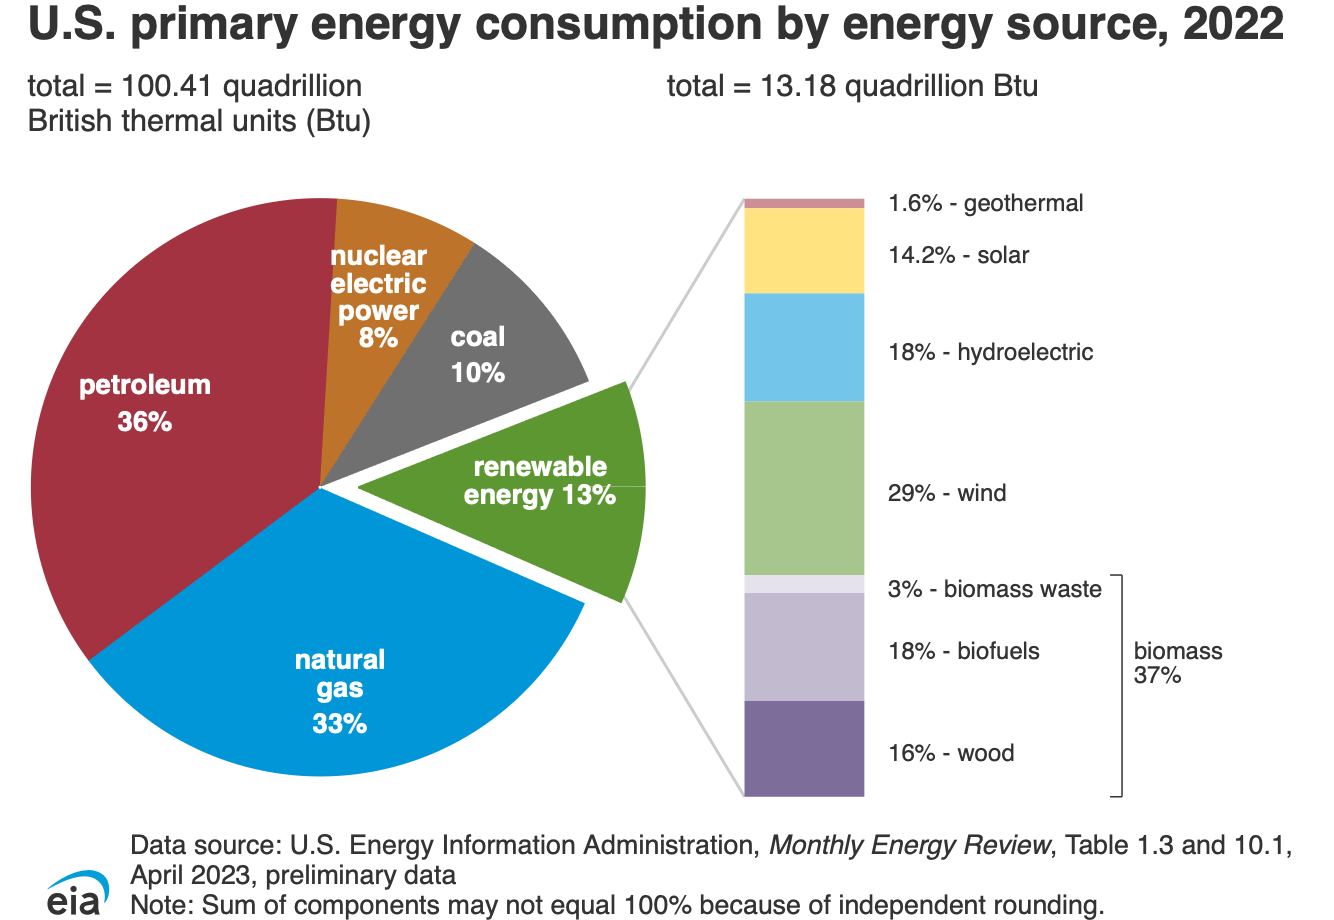
The primary energy flow chart shows the energy flows from all of the sources of energy and how they are used. This is done in BTU equivalents to include non-thermal sources such as Hydroelectric, solar and wind. As shown on the chart, for 2022 Americans used a total of 100.3 Quadrillion BTUs of energy.
A reminder: one BTU is equivalent to 778 foot pounds of work at 100% efficiency. One kWh of electricity is equivalent to 3,412.6 BTUs.
After decades of tax subsidies the quantity of primary energy provided by wind and solar is less than 6%. The fact is, over 90% of our primary energy was in 2022 and remains in 2024, provided by conventional forms of energy: Oil, gas, coal, nuclear, Biomass and old hydroelectric dams. Remember the key words “Primary Energy” when you are told we should “Electrify Everything“. Electricity and Hydrogen are Secondary Energy that must be produced using Primary Energy.
Reality of Bulk Power Supply
Most authors refer to the Grid, (aka Largest Machine Ever Built).(59, 60) I chose to use the term, “Bulk Power Supply” because the term “Bulk Power” better describes generation from conventional power stations. When I reported for work to Carolina Power & Light Company in 1973, the sign on the office door in the central general office stated, “Bulk Power Supply”. I thought it a curious term and wondered why it was not called the “Electric Generating Department”. Apparently, many others have found the term “Bulk Power Supply” awkward too because I do not see references to “Bulk Power Supply” much anymore. However, after all of these years, I think it is the right term to describe Bulk Power Generation when discussing “Megawatt or Gigawatt Hours” not kilowatts of generation.
Let’s take a look at (Bulk Power Supply) electricity generation, by fuels over the last few years during peak summer and winter Demand periods. These are screen shots of actual data. The first is PJM on June 30, 2018. Note that about a third of the generation is by coal fuel.
Since de-regulation of electricity markets in the 1990’s, the U.S. has been divided up into Regional Transmission Operator or RTO’s and Independent System Operators or ISO’s. Here is a map to show what PJM, MISO, ERCOT, etc.

First, let’s look at PJM on a high Demand day: Notice the importance of coal generation? In this example, coal power provides about a third of the total generation.

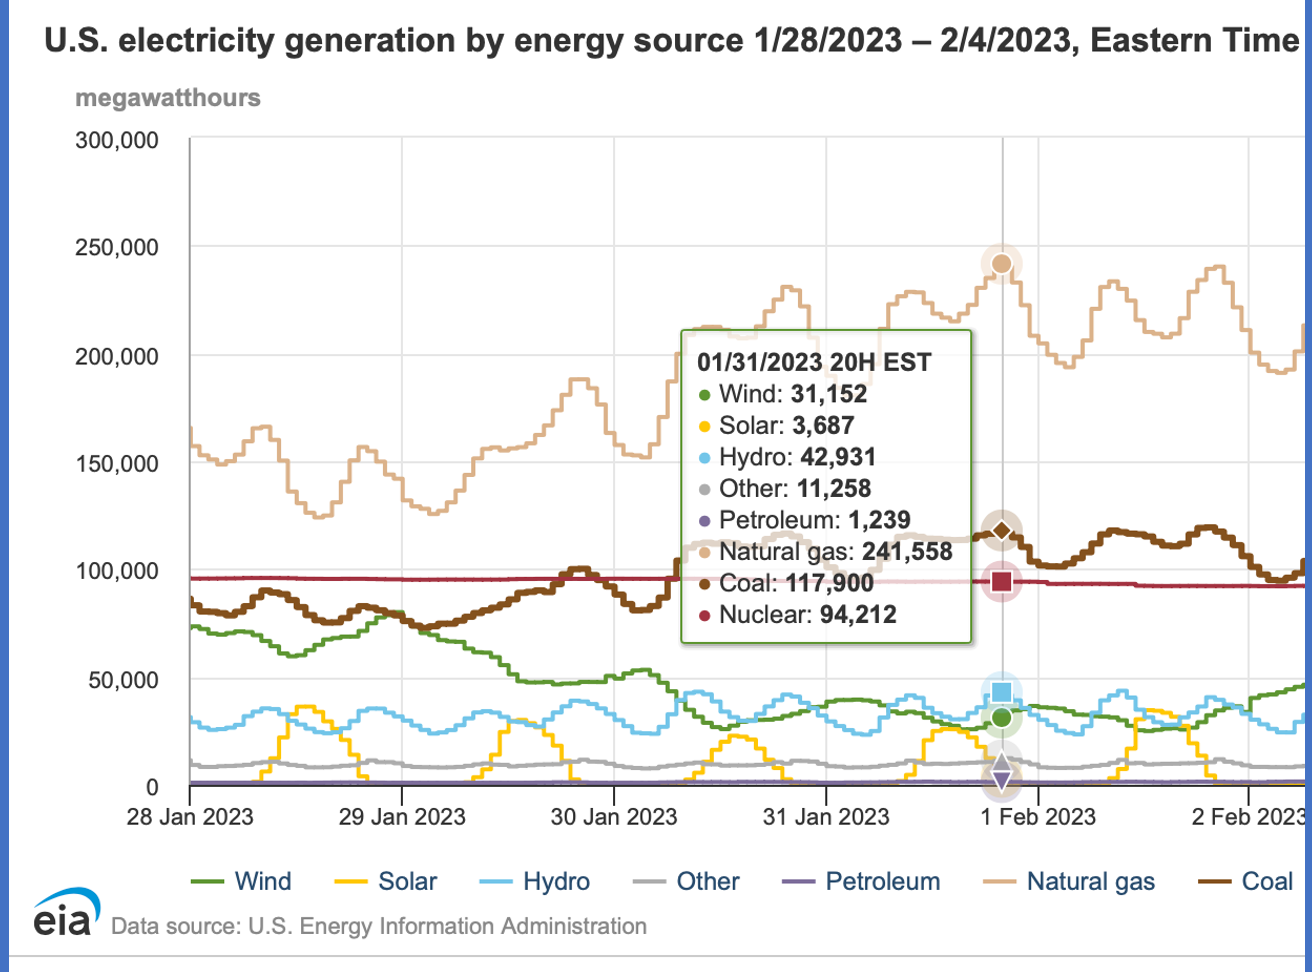
The next example is the 48 state Grid for the week January 28-Feb. 4th 2023. Note the generation by fuels. Coal is providing about 22% of the total 544,000 MWh generation on Feb. 1.
Next, let’s look at Duke Energy Carolinas for the first week of September 2023. Duke has a very balanced generation portfolio including a lot of nuclear, gas and coal generation capacity. At the moment shown, coal was providing 21% of total generation.

The neighboring Utility in SC, Santee-Cooper. A much smaller Utility than Duke, with much more dependence on coal fuel. In this example, about two thirds coal power generation is from coal. The lead photo at the top is the 2390 MW Cross Generating Station. This is a very important generating plant for my area of S.C.

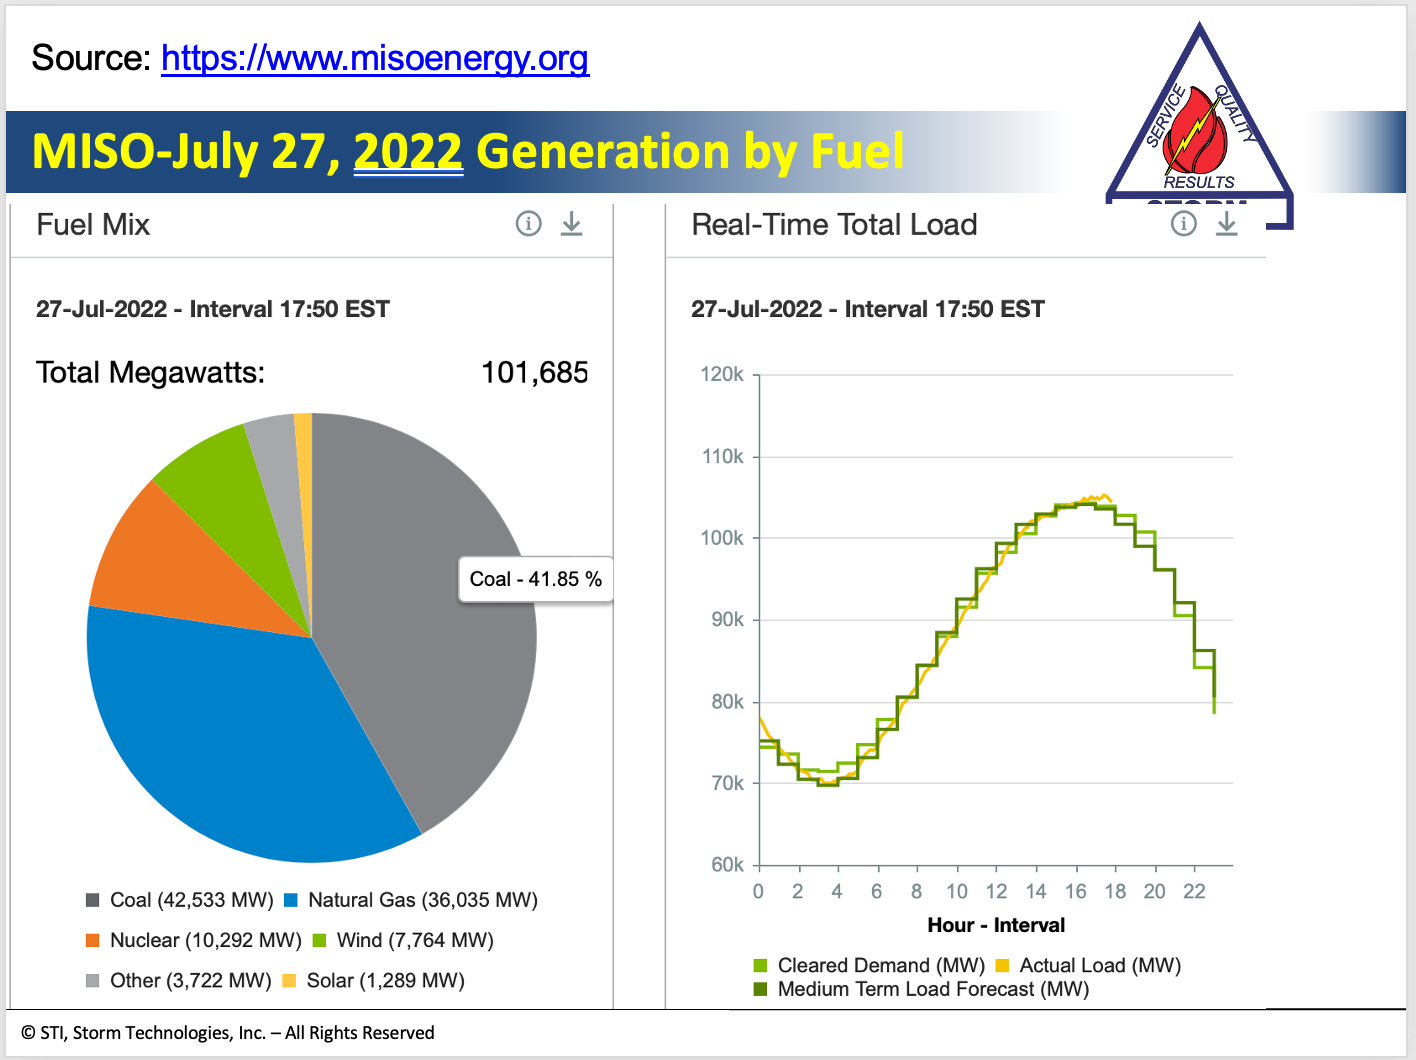
The Midcontinent System Operations (MISO) is shown below for a summer day in 2022. Coal is delivering about 42% of the electricity generation at that moment. (68)
These illustrations are taken from past presentations I have given to show the importance of coal generated power.(68) As this is written, it is spring time and what we in the power plant maintenance business used to call “Outage Season”. Why, because power demand in the spring and fall is the lowest due to mild weather and it is the time to perform major maintenance overhauls. Typical demand curves for different seasons are shown below. From these you can imagine the risk of coming Blackouts is not in the spring and fall, but in the high demand summer or winter months. Remember Texas in Feb. 2021 with over 240 people killed by cold and power shortages?

The PJM load profile shows peak demand in the summer with high air conditioning loads. In the south many states electricity demand peaks in the winter (South Carolina as an example).
Blackouts are forecasted and warnings have been loud and clear. However, the EPA and the government continue their “War on Carbon”. This is intentionally weakening America.
Planning for Blackouts
The illustration below is from the Santee-Cooper IRP. It shows how the forecast of increasing load Demand that is greater than the installed, Dispatchable generation capacity. Some more history of failed S.C. Energy policy is on LI here. (69)

North of Santee-Cooper’s service territory is Duke Energy Carolinas. Their IRP shows a similar gap of Demand and installed capacity. Why? Because the Legislatures in both states have pressured the Utilities to stop using coal. Much of the Duke Energy Coal Plants have been demolished and they plan to completely exit coal use by 2036. The chart below is from one of the Duke Energy IRP’s and it shows an actual deficit of required generation capacity as the coal plants are shut down.

Stopping the use of coal is unnecessary. The Climate Policies are, in my analysis, not to protect the environment or human health. The Climate Policies that have been cooked up to scare the public are all about “One World Government”, Socialism and control of the citizens. Have you noticed that these Climate Policies are only being applied in the Free Western World? Yet, Asia burns over 75% of the world’s coal. Americans need to wake up and here below are some books and references to shed some more light on Climate Policies and sustaining our high quality of life.
Excellent books that forecasted the future of Electric Power shortages and the worldwide misinformation on climate science.

We Have Been Warned!

I am one of many who have warned of coming Blackouts. That’s right, I am not the first skeptic. Let me give credit to Mr. Donn Dears for being one of the first that published books on these harmful policies. Then, after over 100,000 MW of reliable coal plants have been shut down, FERC and NERC and other reputable organizations finally started to chime in. At this time, Blackouts during peak extreme weather in the summer or winter periods are expected. My previous article discussed what I consider to be the largest threats to energy and electricity generation reliability. (64)
FERC, NERC, America’s Power and many others have provided warnings. (43, 44, 45, 46, 47, 48, 49, 50, 51, 52, 53, 54, 68)
Yet, the government agencies, especially the EPA continues the same misguided path toward Net Zero Carbon. My friend, I am sad to say, my late friend, Donn Dears wrote about a dozen books to highlight foolish and un-American energy policies. Four of his books are correctly titled: “Nothing to Fear-A Bright Future for Fossil Fuels”, “Looming Energy Crisis”, “Net-zero Carbon: The Climate Policy Destroying America” and “Clean Energy Crisis”. Donn was a solid American Patriot; Navy Veteran and he had a long career as an executive engineer at General Electric. This was back when G-E was a world leader in conventional power generation equipment. Donn was truly an energy expert’s Expert! Donn’s books are available on Amazon. Worth the read, each is only about 100 pages and they are packed with facts. Donn did his best to save America, even in the last days of his life he was contributing articles and posts on his web site, “POWER for the USA” and communicating with me (and others) to review articles or presentations I prepared and then asked for his advice and review. What a wonderful man and engineer Donn was. RIP my friend, we miss you.
Donn Dears was the one that inspired me to start this Blog. I offer my experiences and my knowledge in all humility, and in memory and respect for my friend, Donn Dears. I miss his friendship and shared wisdom.
America is heading for an energy crisis and it will be hard to correct the harm that has been self inflicted by alphabet government agencies and a rogue, energy ignorant administration.
Please wake up American’s! Please do some research into the importance of energy and reasonable cost, reliable and Dispatchable electricity. Then, pass on the information to your friends and family. Do this for Donn, your own good and for your grandchildren. In my opinion, only about 3% of Americans really understand energy and electricity generation. The Marxist Left has done an effective job of indoctrinating the public with green misinformation. All of us that understand energy and electricity generation need to get involved in preaching the true facts on the unachievable “Net-Zero Carbon and Electrify Everything” nonsensical path of U.S. energy policy.
Yours very truly,
Dick Storm April 9, 2024
References and Information for further research:
- The Green Energy Crisis, Part 2, “Meet Some of the People that Caused it”, June 2023: https://dickstormprobizblog.org/2023/06/14/green-energy-crisis-part-2-meet-the-policy-makers-that-caused-it/
- The EPA Awards Billions From Misnamed Inflation Reduction Act To Orgs Tied To Biden, Dems by Nick Pope, Billions of our tax dollars to Extremist Organizations, Stephen Heins Substack, April 4, 2024: https://open.substack.com/pub/stephenheins/p/epa-awards-billions-from-misnamed?r=kv1a9&utm_campaign=post&utm_medium=web
- 114th Congress, Majority Staff Report, Obama’s Carbon Mandate, August 2015: http://www.scientificintegrityinstitute.org/USSEWP080415.pdf
- The True Agenda of Climate Policies is Not to Protect Public Health of the Planet’s Environment: https://dickstormprobizblog.org/2024/02/13/facing-the-hard-truths-of-energy-electricity-generation-and-environmental-protection-part-4-what-is-the-true-agenda-for-climate-policies/
- Capital Research Center, Report on the History of Global Warming Fears: https://www.climatedollars.org/full-study/a-short-history-of-global-warming-fears/
- CRC Full Report, 2017, Climate Dollars: https://www.climatedollars.org/app/uploads/2017/05/CRC_ClimateDollars_Study_finalv3.pdf
- CO2 You Tube, “Climate Killer or Essence of Life” By Patrick Baeuerle: https://www.youtube.com/watch?v=6daGgUI-keg
- Leveraging the ‘Electrification of Everything’ to Reduce Carbon Emissions Power Magazine Commentary April 2024: https://www.powermag.com/leveraging-the-electrification-of-everything-to-reduce-carbon-emissions/
- POWER Magazine Commentary by Dick Storm, March 2021: https://www.powermag.com/blog/all-fuels-are-important-but-thermal-power-generation-is-still-number-1/
- 2007 Power, Optimize Furnace Performance, start at the Pulverizers http://www.powermag.com/to-optimize-performance-begin-at-the-pulverizers/
- Power Magazine, “Blueprint” Your Pulverizers for Improved Performance http://www.powermag.com/blueprint-your-pulverizer-for-improved-performance/
- Power Magazine, Coal Pulverizers, Part l http://www.powermag.com/pulverizers-101-part-i/
- Power Magazine, Coal Pulverizers, Part ll http://www.powermag.com/pulverizers-101-part-ii/
- Coal Pulverizers Series, Part lll http://www.powermag.com/pulverizers-101-part-iii/
- Stealth Combustion Losses Lower Plant Efficiency Part 1 https://www.powermag.com/how-stealth-combustion-losses-lower-plant-efficiency-part-1-the-problem/
- Improving Plant Heat-Rate POWER, 2014: https://www.google.com/search?client=safari&rls=en&q=Dick+Storm+POWER+Magazine+article+on+Improving+Heat+Rate&ie=UTF-8&oe=UTF-8#ip=1
- Dick Storm Blog post, America Needs and uses 830,000 BTUs per Day/Person, Sept. 2021: https://dickstormprobizblog.org/2021/09/16/830000-btus-per-day-person/
- American Dream = 100 Quadrillion BTUs per Year April 7, 2022: https://dickstormprobizblog.org/2022/07/04/american-dream-100-quadrillion-btus/
- Providing a Sustainable Million BTUs per Day/Person, May 17, 2022: https://dickstormprobizblog.org/2022/05/17/providing-a-sustainable-million-btus-per-day-per-person-by-fuel-source/
- The Importance of Energy to Power Our High Quality Lives, Aug. 25, 2020: https://dickstormprobizblog.org/2020/08/25/the-importance-of-energy-to-power-high-quality-of-life-part-1/
- EIA World Energy Consumption, in 2021: https://www.eia.gov/tools/faqs/faq.php?id=527&t=4
- IEA Key World Energy Statistics, 2021: https://iea.blob.core.windows.net/assets/52f66a88-0b63-4ad2-94a5-29d36e864b82/KeyWorldEnergyStatistics2021.pdf
- Our World in Data, “World Energy Production/Consumption” by country, 2021: https://ourworldindata.org/energy-production-consumption
- Energy Institute Statistics, 2023: https://www.energyinst.org/statistical-review
- Pillars of Modern Civilization, Ammonia, Food, Steel, Concrete, Plastics, Aluminum, July 2022: https://dickstormprobizblog.org/2022/07/25/pillars-of-modern-civilization-all-dependent-on-energy/
- Lawrence Livermore National Laboratory, 2022 Energy Flow Chart for U.S. : https://flowcharts.llnl.gov/sites/flowcharts/files/2023-10/US%20Energy%202022.pdf
- American Coal Council, “Count On Coal” Blog: https://www.countoncoal.org/category/blog/
- “The War on Carbon, How it Came to Be”, Oct. 16, 2021: https://dickstormprobizblog.org/2021/10/16/the-war-on-carbon-how-it-came-to-be/
- THE ERA OF RELIABLE, AFFORDABLE, ENERGY AND ELECTRICITY GENERATION: PART 1 https://dickstormprobizblog.org/2023/10/04/the-era-of-reliable-affordable-energy-and-electricity-generation-part-1/
- The Green Energy Crisis is Here, Part 1, Sept. 17, 2023: https://dickstormprobizblog.org/2023/05/29/the-green-energy-crisis-is-here-part-1/
- The Green Energy Crisis, Part 2, “Meet Some of the People that Caused it”, June 2023: https://dickstormprobizblog.org/2023/06/14/green-energy-crisis-part-2-meet-the-policy-makers-that-caused-it/
- The Green Energy Crisis, Part 3, June 26, 2023: https://dickstormprobizblog.org/2023/06/26/green-energy-crisis-part-3-public-energy-education-is-needed-each-person-in-the-u-s-uses-about-315-million-btus-of-primary-energy-year-this-is-not-practical-or-even-possible-to-replace-with-win/
- The Importance of Energy for Economic Prosperity, Part 4, The Rise of the U.S and the Rise of China from an energy perspective: https://dickstormprobizblog.org/2020/09/21/part-4-the-importance-of-energy-to-economic-prosperity/
- China’s Influence in the World and the Need to Reshore American Manufacturing, Nov. 3, 2020 : https://dickstormprobizblog.org/2020/11/03/chinas-economic-influence-in-the-world-and-some-thoughts-on-the-need-to-reshore-american-manufacturing/
- PowerGen International, 2024 Panel Discussion Take Away’s of Dick Storm on LinkedIn: https://www.linkedin.com/posts/richard-storm-00557810_i-had-the-honor-of-being-on-a-powergen-panel-activity-7156046708139782144-zPoZ?utm_source=share&utm_medium=member_desktop
- Frank Mitchell, Anthony Licata and Angelos Kokkinos ASME Paper, “Analysis of Variable Renewable Energy and Reserve Margins”, July 2022: https://asmedigitalcollection.asme.org/POWER/proceedings-abstract/POWER2022/85826/1146684
- PowerGen International 2024, Speaker Info on Dick Storm: https://www.powergen.com/speakers/richard-storm?&azletter=R&searchgroup=libraryentry-speakers
- “Update on Hawaii’s Glimpse of the Future of the Green New Deal” March 20, 2024: https://dickstormprobizblog.org/2024/03/20/hawaii-a-glimpse-into-the-future-of-the-green-new-deal-aka-inflation-reduction-act-here-is-an-update/
- FERC Description of RTO’s and ISO’s: https://www.ferc.gov/power-sales-and-markets/rtos-and-isos
- Coal Use in World Reaches New Record in 2023, Reuters Jan. 2024: https://www.reuters.com/markets/commodities/global-coal-exports-power-generation-hit-new-highs-2023-2024-01-18/#:~:text=LITTLETON%2C%20Colorado%2C%20Jan%2018%20(,cut%20back%20on%20fossil%20fuels.
- Visual Capitalist on Electricity Generation by Fuels in the World, Jan 2024: https://www.visualcapitalist.com/electricity-sources-by-fuel-in-2022/#:~:text=Coal%20is%20Still%20King,%2C%20and%20hydroelectric%20at%2014.9%25.&text=Over%20three%2Dquarters%20of%20the,consumed%20in%20just%20three%20countries.
- IER (Institute for Energy Research) 200 Ways Biden and Democrats Have Made it Difficult to Produce Oil & Gas in the U.S. : https://www.instituteforenergyresearch.org/regulation/200-ways-the-biden-administration-and-democrats-have-made-it-harder-to-produce-oil-gas/
- “Clean Energy Crisis”, Book by Donn Dears, 2023. An excellently written, short and concise review of the energy crisis we are facing. Available on Amazon.
- POWER Magazine article on NERC Warning: https://www.powermag.com/nerc-identifies-energy-policy-as-key-risk-to-grid-reliability-amid-evolving-challenges/
- NERC State of Reliability Review, June 2023: https://www.nerc.com/pa/RAPA/PA/Performance%20Analysis%20DL/NERC_SOR_2023_Overview.pdf
- NERC December 2023 Report on Grid Reliability: https://subscriber.politicopro.com/f/?id=0000018c-64e3-db4d-abac-efef87a50000&source=email
- America is Running Out of Electricity Generation, Washington Post, March 7, 2024: https://www.msn.com/en-us/money/companies/amid-explosive-demand-america-is-running-out-of-power/ar-BB1jtM69
- FERC Energy Regulator States, “Power Grid is Facing Dire Consequences Due to Coal & Gas Retirements”, “WUWT June 2023: https://wattsupwiththat.com/2023/06/13/federal-energy-regulatory-commissioner-mark-christie-power-grid-is-facing-dire-consequences-due-to-coal-gas-retirements/
- Marc Christie to Gulf States, March 10, 2024: https://www.rtoinsider.com/73336-ferc-christie-warns-very-dark-place/
- CATO’s Travis Fisher Testimony to Congress, on Electricity Security, March 12, 2024: https://oversight.house.gov/wp-content/uploads/2024/03/Testimony-Fisher.pdf
- America’s Power report on coal plants saving Grid during Jan. 2024 winter storms, Feb. 2024: https://americaspower.org/issue/operation-of-the-u-s-power-grid-during-the-january-2024-storm/https://americaspower.org/wp-content/uploads/2024/02/2024_02_14-Jan-2024-Winter-Storms-Analysis-FINAL.pdf
- Fox News report on Biden’s Crusade of Shutting Coal Plants Down will Cause Blackouts and Higher Electricity prices, Feb. 2024: https://www.foxnews.com/opinion/crazy-things-bidens-anti-coal-crusade-will-ordinary-americans
- Grid Operators Warn of Blackouts due to Excessive EPA Rules, America’s Power, March 6, 2024: https://americaspower.org/operators-regulators-concerned/
- E & E News, Warnings of Blackouts due to Excessive EPA Rules, Dec. 2023: https://www.eenews.net/articles/grid-monitor-warns-of-blackout-risks-as-coal-plants-retire/
- WUWT Steve Goreham article “Electricity Generation vs Green Goals” Feb. 28, 2024: https://wattsupwiththat.com/2024/02/27/electric-power-vs-green-goals/
- Robert Bryce article on Increasing T&D is not the answer: https://robertbryce.substack.com/p/out-of-transmission-revisited/comments
- Grid Down, Power Up YouTube: https://www.youtube.com/watch?v=1kErOyJ0u-8&t=180s
- Dick Storm Blog post on Santee-Cooper Growth of electric generation and the Futility of achieving 9,000 MW capacity by 2050 with carbon free power: https://dickstormprobizblog.org/2023/04/27/how-can-a-6000-mw-regional-utility-in-2030-which-likely-will-be-a-9000-mw-utility-in-2050-achieve-net-zero-carbon/
- Bloomberg, “The Largest Machine in the World, The Electric Grid, Oct 2014: https://www.bloomberg.com/view/quicktake/u-s-electrical-grid
- Yahoo Finance, “Greasing the Largest Machine in the World, the Electric Grid, by Sonia Aggarwal, Sept. 2014 : https://finance.yahoo.com/news/greasing-electric-grid-worlds-largest-machine-op-ed-150237367.html
- Donn Dears book, “Net-zero Carbon: The Climate Policy Destroying America” Paperback – January 2, 2022, available on Amazon.
- Donn dears book, “Looming Energy Crisis”
- Donn Dears book, “Nothing to Fear-A Bright Future for Fossil Fuels”
- Threats to the Electric Grid, March 15, 2024: https://dickstormprobizblog.org/2024/03/15/threats-to-the-grid-electricity-reliability/
- Ron Stein’s website w/articles and podcasts on the importance of conventional fuels, “America Out Loud” : https://www.americaoutloud.news/author/ronald-stein-p-e/
- Visual Capitalist on Data Center Power Demand, Jan. 2024. Example, Data Centers in Northern Virginia alone uses over 2550 MW: https://www.visualcapitalist.com/cp/top-data-center-markets/
- Yahoo Finance on Virginia Data Center Bulk Power Demand, May 28, 2024: https://www.yahoo.com/news/virginia-explained-data-center-expansion-095928981.html
- IEA Electricity Growth Report, 2024: https://www.iea.org/reports/electricity-2024/executive-summary
- Dick Storm Presentation to Columbus Energy Forum, Columbus, Ohio. “The U.S. Does NOT Have an Energy Policy, Only a Policy of Decarbonization”, August 2022: https://www.linkedin.com/posts/richard-storm-00557810_presentation-and-speakers-notes-from-august-activity-7068650158862827520-B-_W?utm_source=share&utm_medium=member_desktop
- Dick Storm post on LinkedIn on S.C. Energy policy and the background of the failed 1200 MW Pee Dee Supercritical Coal Plant and Summer Units 2 & 3 Nuclear plant expansion. Post has links to Post and Courier articles, Duke, Santee-Cooper, Dominion IRP’s and SC Energy Office: https://www.linkedin.com/feed/update/urn:li:activity:7184184178920312833?utm_source=share&utm_medium=member_desktop
- Good Substack contribution to explain Who/Why/How the Grid Reliability became “Undermined-Electrons Have Consequences” Energy IQ, by Pandreco, April 14, 2024: https://pandreco.substack.com/p/undermining-electrons-have-consequences
- WUWT article on unexpected growth of electricity demand from Data Centers, April 2024: https://wattsupwiththat.com/2024/04/19/wash-post-admits-reality-amid-explosive-demand-america-is-running-out-of-power-u-s-power-grid-being-pushed-to-the-brink-utilities-can/
- You Tube Lars Schernikau on Honest Pay Back of Renewables, https://www.youtube.com/watch?v=Wa8Q8MoWfrU
- Energy Policy Institute.org: https://www.energyinst.org/my-ei/preferences
- Grid Status website/Dashboard: https://www.gridstatus.io/homehttps://www.gridstatus.io/home
- Data Centers embrace nuclear, April 2024: https://www.datacenters.com/news/the-data-center-industry-s-transition-to-nuclear-power
- Data Center Power, 2020: https://www.datacenters.com/news/everything-you-need-to-know-about-data-center-power
- EPOCH Times on Data Center Power Demand, April 2024: https://www.theepochtimes.com/article/rapid-expansion-of-cloud-computing-may-hit-a-wall-with-limited-supply-of-power-water-5630195?utm_source=Morningbrief&src_src=Morningbrief&utm_campaign=mb-2024-04-18&src_cmp=mb-2024-04-18&utm_medium=email&est=AAAAAAAAAAAAAAAAc%2BsofRIezY%2Fb%2BLwcs0VKH7toxkYAIGcN2s7GwqwC0GkGTSTCcgh%2FABHe
- Quanta Technology Study Report on Power Generation Shortages, report for America’s Power, Feb. 2024: https://americaspower.org/wp-content/uploads/2024/02/Quanta-Final-Feb-2024-3.pdf
- Georgia Power IRP Revised 2023, April 2024 to update the increased Demand for Electricity will require more new generation capacity: https://www.georgiapower.com/content/dam/georgia-power/pdfs/company-pdfs/2023-irp-update-main-document.pdf