This chapter will focus on the sources and fuels of energy for the U.S.A. The average American likely believes our electricity is coming mostly from renewable sources. Why? Because we are all indoctrinated with advertisements and Mainstream News Media reports on massive solar and wind farms. Well the true story is that over 80% of the energy we depend on comes from natural gas, nuclear, coal and old hydroelectric power plants. The EIA (Energy Information Administration ) a department of the U.S. Department of Energy, publishes data to provide access for all who are interested in the facts. The figure below shows American energy sources consumed in the year 2019.

The renewables at 11% include 22% old hydroelectric plants such as the Grand Coulee Dam and many other dams in the Pacific northwest operated by the Bonneville Power Authority. The renewables also include Biofuels, Biomass and wood power for Thermal Heat Engines. Digging down into the data of the 2019 energy pie chart shows: About 93% of the energy used in 2019 was in Heat-Engines. Yes, even about 43% of the biomass renewables were utilized in heat engines, such as Landfill gas burned in power boilers, wood fuel and ethanol biofuels burned in internal combustion engines. Heat-Engines play a large part in making our lives productive and good. A friend of mine always reminds me about National Security and keeping our Military strong. Military jets, Surface ships, Armored Personnel Carriers and Helicopters operate on Diesel and Jet Fuel. Peace through strength is important, I believe. More on the importance of combustion and Heat-Engines in a later chapter.
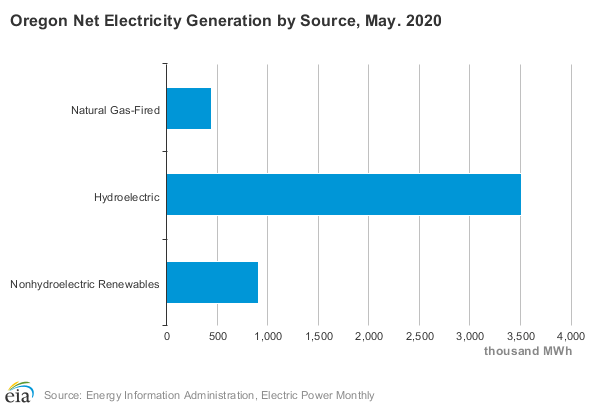
A couple years ago, Ginny and I took a river cruise on the Snake and Columbia Rivers from Idaho to Portland. Often I wondered why citizens in the west were so strong in their voices for renewable power and so against fossil fuels. I figured out part of the answer as we toured Bonneville Power Dams and became aware of the over 22,000 MW of generation capacity of BPA (Bonneville Power Authority). The cost of power is subsidized by the Federal Government and is about $0.02/kWh. Abundant and reasonable cost. Great for the Pacific Northwest, however, there is only one Columbia River in the U.S.A. What is good for Portland, Oregon doesn’t apply to South Carolina or other states. Here is an example of why a diverse generating portfolio for 50 states is important.
All sources and all fuels are important and should be included in America’s energy mix. Here below is the comparison of South Carolina’s electricity generation during 2019. Over 55% is from nuclear generation.

The discussion of electricity production in Oregon and South Carolina show the extreme differences in affordable and reliable power from these two states. Nationwide, electricity generation is the largest consumer of primary energy. “Energy” encompasses much more than electricity production. The next largest consumer of primary energy is Transportation. For the U.S.A. our energy production and consumption is shown on the Sankey Diagram below:

The Sankey Diagram shows the total energy expressed in “BTU’s (British Thermal Units). During 2019 America utilized 100.2 Quadrillion Btu’s. The sources of these Btu’s and the end use is shown on the diagram. The left side shows the energy sources and as the lines move left to right show the utilization of the heat energy. The line thickness is in proportion to the amount of Btu;s for each path.
The Sankey Diagram provides details of energy flows. The chart below by the EIA summarizes the American Energy Sources in 2019;

The foregoing charts and data represent energy for America in 2019. Below is the forecast to 2050 for the U.S.A. Renewables are forecasted to be up to 38% of total electricity generation by then.

So, how about electricity generation in China and the rest of the world? Forecasts for the World energy production and demand to 2050 is shown below:

The perspective of the world energy use and production of carbon dioxide is shown in the chart below by the Union of Concerned Scientists.

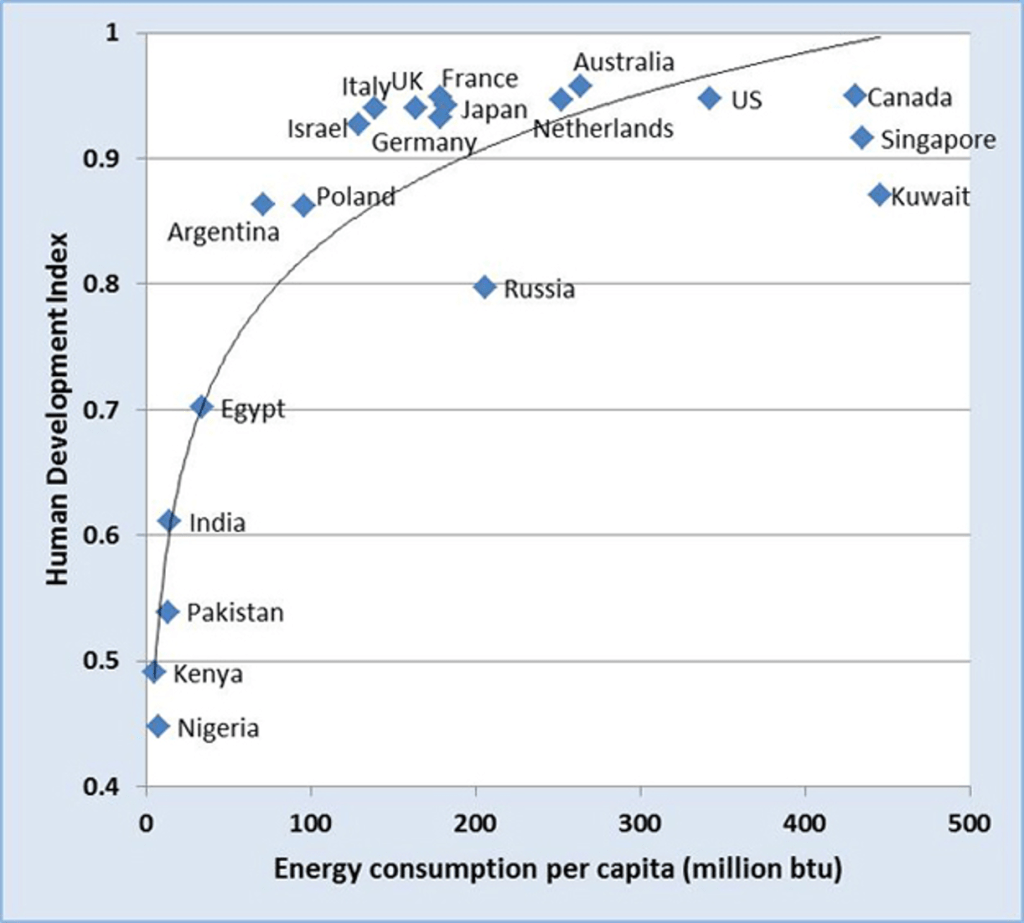
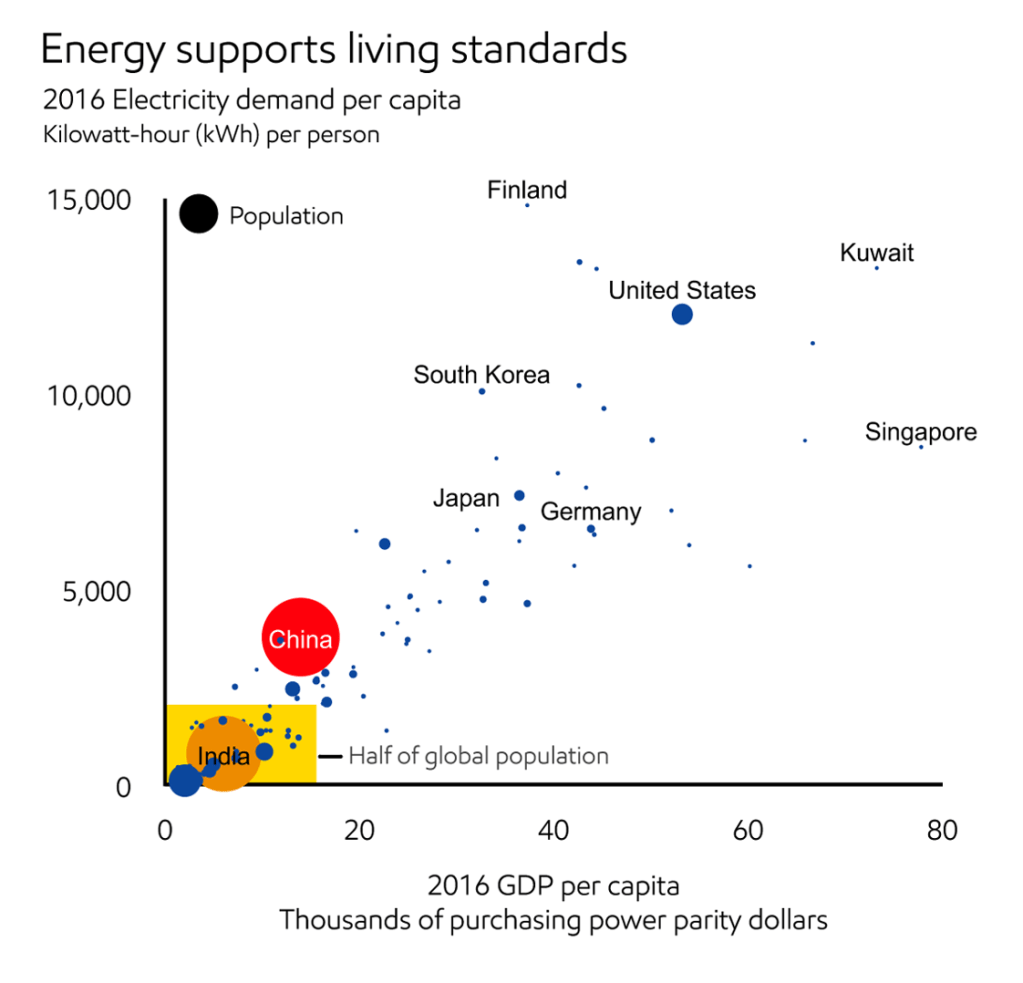
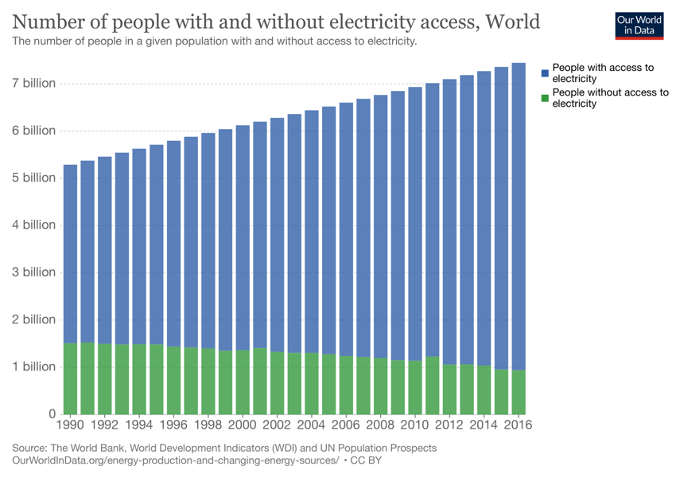
Not to become distracted but forecasts are simply best guesses of the future. One reasonably reliable forecast for the future is, that the world population will grow from about 7.2 Billion on 2019 to something over 9.0 Billion in 2040. These additional 2 Billion people (plus the almost 1 Billion who currently do not have access to electricity) will desire and demand the same advances in quality of life, clean water, clean air, transportation, indoor air quality, cooking, air conditioning and industrial output that those of us that live in Developed countries have. Here is the United Nations projection for world population growth.

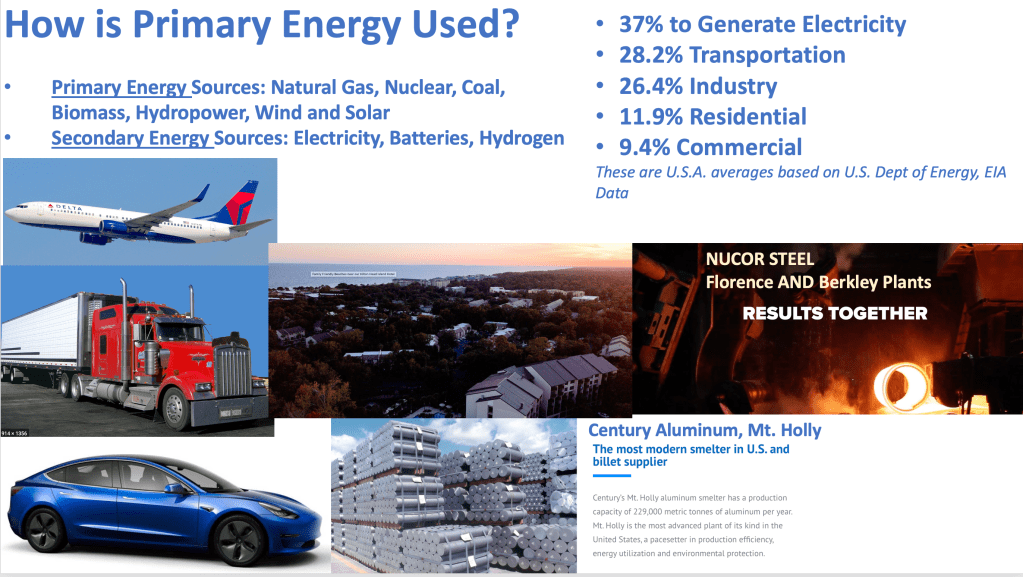
I show these data on world population and current energy use to emphasize why I believe a portfolio of all fuels are important. The figure below is a reminder of the importance of energy to power high quality of living and the uses of energy in the U.S.A. Please keep in mind, Electricity is very important and I worked my entire career helping to produce the least cost, most efficient and most reliables electricity that I could. Transportation, Industrial output, residential heating, cooling and cooking and commercial buildings together comprise nearly twice as much energy consumption as electricity generation. Electric vehicles like the Tesla electric vehicle shown in the lower left below may change the use of primary energy by 2040 or before.

A typical electric steel furnace as illustrated above will use about 175 MW of electricity. An aluminum smelter, such as the Century Aluminum Smelter in Mt. Holly, SC will use up to 400 MW of electricity. To compare this to small cities, my old town of Albemarle, NC has a municipal electric system that peaked at about 50 MW for a city of 20,000 people. My current town of Hilton Head with a population of about 40,000 and tourists in the summer of about 100,000 uses about 250 MW on a hot August day. I state these examples to illustrate the enormous amount of electricity that is needed for heavy industry. For America to remain economically strong and competitive in the world, we need to maintain industrial output at high levels and heavy industry, especially metals production, is very energy intensive. Later in the chapter on world trade and energy I will expand on the relationship of electricity and trade. Especially important for primary metals such as aluminum, steel and copper. All of these use large amounts of electricity. Aluminum production from aluminum oxide to ingot aluminum requires about 5 kWh to produce. This does not include the energy used to refine Bauxite into alumina or the energy needed to forge or roll the aluminum ingots into finished product.
I will close this chapter with a chart showing energy measurements, equivalents and cost per million Btu’s and a reminder of the importance of Heat-Engines.
Key to comparing energy costs for use in Heat-Engines is to compare the cost per million Btu’s. The chart below provides some commonly used data and terms.

The next chapter will cover common heat engines and a brief description of each type. Why Heat-Engines? Note the illustration below, yes 90%. This is why the Energy Information Administration measures and reports total Btu’s produced and consumed:

Dick Storm, August 28, 2020