93.5% of America’s energy is used in Heat-engines to drive our economy and power our comfortable lives: 80% is from fossil fuels

This huge amount of energy is not easily replaced by alternative fuels! My response to an ASME webinar on forcing a “Green Grid” on America.

From EIA Annual Energy Outlook Jan. 2021

All Fuels Are Important, but Thermal Power Generation Is Still Number 1

Last month I participated in a continuing education webinar presented by the ASME Mechanical Engineering Magazine. I was upset by the lack of practicality and missing common sense of the presentation. Thus, I wrote a letter to the ASME Magazine’s Editor. The text is copied below.

Throughout my career—and also through the ASME’s long history (ASME’s, American Society of Mechanical Engineers, Boiler and Pressure Vessel Code, B&PV Code saved millions of lives and advanced our country!)—thermal power generation has been the greatest source of dispatchable electricity generation. In my view, policymakers have run a very good and smooth evolution of power generation diversity off the rails. The Biden Administration (probably with advisors like Dr. Jenkins) and Democrat Congress policies constitute an anti-American war on carbon. These policies, if continued, will in fact be extremely harmful to the country’s economy, national security, and eventually, when considering bans on oil and gas production and pipelines in the U.S., our freedoms. Further, if continued as Jenkins, Biden, Kerry, Et Al wish, will contribute to the decline of western civilization. (by strengthening China, Russia, Iran and their allies)

There is not space here to debate climate change, whether manmade or natural. Suffice it to say, I believe climate and weather changes are, for the most part, driven by natural forces of solar activity, ocean currents, volcanoes, tilt of the earth, and other uncontrollable dynamics. The pressure to rejoin the Paris Agreement is driven by other countries that wish to see America decline in power and influence in the world. China will gain the most by America’s decline. Princeton’s Dr. William Happer provides an excellent summary with a segment beginning at minute 24 where the effects of CO2 are discussed. https://bit.ly/3zsXcS6

Reasonable cost, and abundant, energy and electricity are crucial for our economy and the functioning of our society. Over the years, it has been well-documented that all advanced economies grow in proportion to energy use. America’s economy grew in direct proportion to its energy use over the 130-plus years since Edison’s Pearl Street Station commenced operation. 

China’s economy grew from being a poor and developing country in the year 2000 to now being the world’s largest manufacturer and world’s second-largest economy. China produces more than 50% of the world’s steel and aluminum, as well as being the largest producer of manufactured products. China plans to become larger than the U.S. and is likely to pass America as the world’s #1 economy in a few years. Biden’s policies will accelerate the growth of China’s economy and the decline of America’s. To reach the status of the world’s largest manufacturer and largest producer of steel and aluminum, China built more electric power generation in the past 20 years than America did since Westinghouse and GE were founded. Remember George Westinghouse? One of America’s finest engineers.

Energy and economic prosperity go hand in hand. So, let’s look at where our energy comes from. America has used right at 100 quadrillion Btus per year for about the last 10 years or more.  (last year was about 93 Quads due to the pandemic) According to the U.S. Energy Information Administration (EIA), the U.S. used 100.2 quadrillion Btus in 2019. 

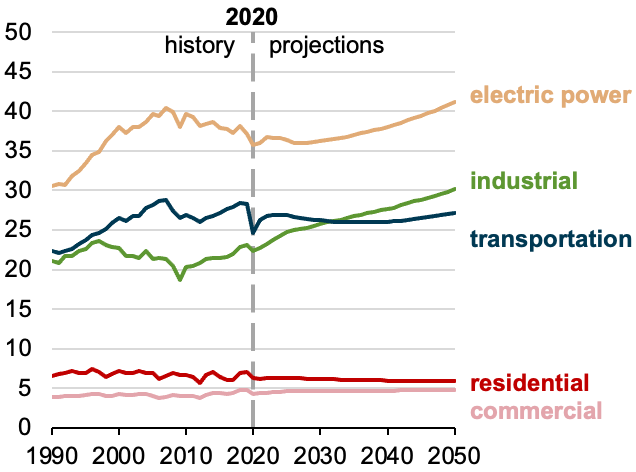
More than 90% of the U.S.’s primary energy consumption in 2019 was provided for use by thermal heat engines. This is comprised of about 36.8% petroleum, 32.1% natural gas, 11.3% coal, 8.4% nuclear, and 4.9% biomass. The total renewable energy consumption (excluding biomass) was 6.4%, and a significant portion of that bulk power (40%) was from hydroelectric. This primary energy use includes transportation, commercial, residential, and industrial use. Electricity consumption of our total primary energy was 37.1%.

When politicians and the mainstream media talk about energy- and planet-saving electric vehicles and renewable power generation, I think it would be wise to consider that, if we like our status in the world, and our current comforts and conveniences, then we will need at least 100 quadrillion Btus of energy per year for the foreseeable future. At present, about 93.5% of our total energy is used in heat engines and only about 6.4% is supplied by non-biomass renewables. That’s right. Check the EIA website to see for yourself.

To say changing from 93.5% heat engines to renewable power generation and electric vehicles will be disruptive is a gross understatement. In time, renewable power advances and green hydrogen from renewables will eventually come. But for the next 10 years or more, America should stay the course with modernizing our current fleet of natural gas, nuclear, and coal plants. These are what we depend on and the mid-February rolling blackout experiences in Texas should be a wake-up call to policymakers.

Another example is Hawaii, which plans to shut down its lowest cost power plant—Barbers Point coal plant. As the state moves toward its version of the new “Green Deal,” Hawaii has the highest cost electricity in the nation. Not a problem for an economy based on tourism and government facilities, but $0.25 kilowatts will not permit competitive primary metals production or competitive manufacturing in the contiguous 48 states.

In my adopted state of South Carolina, about one-third of the total electricity is used by industry. South Carolina has a thriving industrial sector, and it depends on reasonable-cost and reliable electricity. Sacrificing reasonable-cost conventional power generating plants to replace with renewables will drive much manufacturing overseas (again). 

As I read the plans for South Carolina’s coal plants, all of which I have worked at and know very well, I see that several more coal units are planned to be shut down in the next 10 years. These are to be replaced with solar or other renewables. Currently, more than 55% of South Carolina’s electricity is generated from nuclear power. Therefore, replacing coal with renewables may not be a problem, if the South Carolina nuclear units keep running indefinitely. However, several of these nuclear units are into their second licenses and will begin shutting down in the 2030s. As I see it, this sets ourselves up to follow California, Hawaii, and Texas into higher-cost power production and less-reliable power supplies. All fuels are important!

Let’s review the last 15 years of fuel changes in the U.S. In 2004, electric power generation was about 92.4% thermal generation. In 2019, the percentage of thermal generation was still the highest at 83.6%. Natural gas made the largest gain at the expense of coal. Wind grew from 0.4% to 7.1% over the 15-year period. Now, if policymakers are concerned about electric reliability and competing in the world with manufactured products, they should rethink the trends toward more intermittent non-dispatchable renewables.

Americans have lived through disruptions before. I lived in a small town in North Carolina, which the county seal showed textiles and aluminum production as being the most important for its economy. Then, after the North American Free Trade Agreement (NAFTA) went into effect, the textile mills closed down, killing about 7,000 jobs in a county with 60,000 people. A few years later, Alcoa Corp. shut down the aluminum smelting plant that had been in operation for more than 100 years, causing another 750 or so jobs to be lost. Aluminum smelting is very energy intensive, it takes about 5 kWh to produce one pound of aluminum. It doesn’t take a world class Economist to understand how China has become the world’s largest producer of steel and aluminum. China uses about 57% of the world’s coal to power their industry. True, China uses more coal than all of the rest of the world put together.

In Texas, I did much work from 1978 onward at an Alcoa plant in Rockdale, as well as at numerous coal plants. Rockdale was the largest aluminum smelter in North America, and it was shut down in 2008 due to oversupply of aluminum from China. Over 6,000 MW of reliable, reasonable-cost coal power generation has been shut down in Texas since 2008. Had these coal plants not been retired, perhaps the events in mid-February may have played out differently.

Energy and economic prosperity are inter-related. The Green New Deal and more renewable power will harm America’s competitive advantage. If we think February was a bad month for electric reliability, imagine what the Green New Deal and further accelerated disruptive changes to renewables will do to the rest of the U.S. Preserving our good lives requires about 100 quadrillion Btus per year. In my view, obtaining this energy from all available fuels within our borders is important.

I suggest that the ASME publications and energy programs consider the facts of All Fuels and why they are important for our country.

Respectfully submitted,

Richard F. Storm, PE

Sustainability of our high quality of life depends on reasonable cost electricity

Energy, is the only universal currency”

The author of several books on energy, Vaclav Smil is quoted as saying “Energy is the only universal currency: one of its many forms must be transformed to another in order for stars to shine, planets to rotate, plants to grow, and civilizations to evolve.”

Most American citizens simply take abundant, reliable and reasonable cost energy for granted. It is not until a major pipeline is shutdown as the Colonial Pipeline was last year by hackers. Or, there is severe weather such as a hurricane that shuts down refineries and/or topples electricity transmission towers. Only then does the average American notice just how important energy is to our lives. As important as energy is to us, we are allowing politicians who know very little about the production of energy, electricity generation, transmission and distribution of energy to, “Completely transform America’s energy infra-structure with the Green New Deal” I wrote last year on Hawaii’s path toward the “Green New Deal”, Here is the link: https://wordpress.com/post/dickstormprobizblog.wordpress.com/32

I used Hawaii as an example, because Hawaii is literally an energy island and is not connected to the American Electric Grid. Thus, it provides a perfect laboratory to expose the results of going green, or at least moving in that direction. Because of the isolation from competitive electricity supplies, the change to more green generation is making a much faster impact on electricity pricing. There is not the ability to import low cost coal or natural gas power from other states as say, California can. Because of the intermittant nature of renewable power (Non-Dispatchable), much of Hawaii’s electricity is generated from oil fuel. In fact, you can get a real time update on the generation source here: https://www.islandpulse.org

Oahu has a very reliable and clean coal plant, Barber’s Point. The real time screen shot above shows 14% of Oahu’s power was being provided at this moment. Unfortunately, because of unreasonable Political reasons, the coal plant is scheduled for premature shutdown. Just because the elected officials have their own war on carbon. Their intentions may be pure but in reality to keep the power supply reliable, much of the electricity generation is from oil fuel. (no natural gas pipelines in Hawaii either, thus, oil backup power) Most of the cost of electricity (about 75% for coal and 90% fuel cost component for natural gas or oil) production from a Thermal Power Plant is for fuel. Therefore, using Diesel Fuel which second only to hydrogen, is the most expensive fuel available. As time goes on, the higher production cost of electric generation must be passed on to the Rate-Payers. Thus, Hawaii has the highest electricity costs in America. Note the chart below provided by the Electric Choice.com web site. The average retail cost of electricity in America is about $0.13/kWh. As shown below, Hawaii’s is $0.327/kWh

Critics can say that electricity is a small cost of our household expenses. That, high electric costs such as Hawaii and California have is not a big deal. Well, in my state of South Carolina, manufacturing (jobs) is still a large part of our economy. We have NUCOR Steel and Century Aluminum manufacturers. The production of vital steel and aluminum that we need is very electricity intensive. So, perhaps Hawaiians can enjoy life and their economy thrive. Tourism and government facilities can absorb the high electric costs, competitive manufacturing cannot. My state cannot. Just for reference, over 50% of our electricity in SC is generated by four well run nuclear power plants. These nuclear plants plus reasonable cost natural gas and coal plants keep our electricity costs below the National average. The generation is “Dispatchable too!” That means, electricity load can be increased or decreased as customer demand fluctuates.

All of us should be aware of China’s dominating world manufacturing. China produces over 50% of the world’s steel, aluminum and concrete. China uses over 57% of the world’s coal production for electric power. Yes, China is the most productive and least cost producer of many products manufactured in the world. China the last time I checked, produces about 28% of the world’s manufactured goods. I submit that electricity prices matter. Reasonable cost electricity is absolutely required for competitive manufacturing.

My presentation to the Delaware County Bar Association in July 2016 has some facts and information on how China crushed ALCOA’s aluminum production. This is at this link:

https://wordpress.com/post/dickstormprobizblog.wordpress.com/24

My personal experiences included working (as a contractor/consultant) for ALCOA all over the world at their Alumina and Aluminum smelting facilities. I made many friends with Alcoans from 1978 till about 2012. Then, huge plants such as the Rockdale Texas Smelting operation, the smelter at Suriname, SA and others were shut down. Why? Becuase aluminum requires about 5 kWh per pound to produce the metal. This is just for the smelting operation. More energy is required for alumina production and transportation. Energy costs matter for economic prosperity. For many of my friends at ALCOA, the Chinese dumping of aluminum on the London Metal Exchange, meant early retirement or job changes.

The “Green New Deal” is anti-American and will weaken America’s competitive capacity. Conversely, the “Green New Deal” will strengthen China’s grip on world manufacturing. Their dominance in solar panel manufacturing is well documented.(4) The Green New Deal if passed will be a (another) huge gift to China.

Donn Dears has an excellent website where he provides information on energy, Net Zero Carbon, Electric Vehicles electricity generation, nuclear power generation, hydrogen and much more. Here is the Power for the U.S.A. Blog address: https://ddears.com/donns-articles/ I strongly recommend reading Donn’s articles. He has a knack for writing short concise posts with ample facts and references.

Conclusion:

The changing of America’s electric power generation to becoming carbon free is not practical and in fact, with today’s technology, impossible. I submit the case study of Hawaii’s experiences to show the fallacy of committing to new renewable power sources to quickly. California and Texas have experienced Blackouts because of too much intermittant renewable power and not enough reliable and Dispatchable generation capacity. (Key phrase, Dispatchable Electric Generation capacity) Why would we enact policies and Regulations that make America weaker and less competitive with China?

Dick Storm, August 20, 2021

References:

  1. Island Pulse website by Blue Planet Foundation for real time electric generation data for Hawaii Electric on the island of Oahu. https://www.islandpulse.org
  2. Electric Choice.com for electric rate comparisons of 50 states.

3. Donn Dears Blog: Power for the U.S.A. An excellent collection of relevant articles on energy and electric power generation. https://ddears.com/donns-articles/

4. Coalition for a Prosperous America, report on Solar Panel Manufacturing and dominance of China: Coalition for a Prosperous America report on Solar Panels from China: https://prosperousamerica.org/cpa-releases-report-on-reclaiming-the-us-solar-supply-chain-from-china/

FREEDOM IS NOT FREE, NEITHER WILL NET ZERO CARBON BE FREE

Reducing Reliability and Increasing Prices of Our Energy Supply

Introduction

Vaclav Klaus was the President of the Czech Republic in 2003. I have a copy of his book, “Blue Planet in Green Shackles” with the sub-title, “What is Endangered: Climate or Freedom”

As I was straightening up my book case, I found this interesting insight from nearly 20 years ago. I started paging through the book and one quote by Klaus caught my attention.  “As someone who lived under communism for most of my life, I feel obliged to say that the biggest threat to freedom, democracy, the market economy and prosperity at the beginning of the 21st century is not communism or its various softer variants. Communism was replaced by the threat of ambitious environmentalism.”

Klaus’ book reminded me of my friend Tom’s experience as a Charlotte, NC,  City Ambassador during the 2008 Democrat Party Presidential Convention. Tom, like me was also employed in the energy industry for many decades. So, when energy issues were discussed, his antenna went up.  He heard influential leaders of the Democrat Party strategizing on how to wage the war on coal. Their reasoning was, If they could craft policies to increase coal generated electricity prices, then solar and wind power will become competitive.  Obviously, President Obama won that election and the war on carbon accelerated during his eight years.

These two examples of green policy intentions on two continents are the inspiration for this article. My last post was a reminder that in America we depend on (including the Btu equivalent of renewable generated electricity) about 100 Quadrillion Btu’s each year to fuel our economy. Over 85% of that energy is used in heat engines. So called, because steam turbines, reciprocating gasoline or Diesel internal combustion engines, jet engines and stationary gas turbine generators are all Heat-Engines. Heat-Engines convert the chemical (or nuclear) energy of fuel to heat that is then applied as shaft horsepower, motive force or jet thrust for producing electricity, transportation or industrial production. 

Reasonable cost and reliable energy are important for us to continue our high standard of living.

Below is the Lawrence Livermore Laboratory Sankey Diagram which shows the energy flows from 2019. This was a more normal year of economic activity. The total energy used was right at 100.2 Quadrillion Btu’s. If you study the energy flows, you can verify the conclusion that most of our energy is used in heat engines. Heat engines such as; steam turbines which are used to generate electricity from coal, natural gas, nuclear, geothermal, biomass and petroleum. Gas turbines that are used for stationary power generation, ship propulsion, turbo-prop aircraft propulsion. Diesel engines for trucks, buses, farm tractors, railroad locomotives and backup electric power generation, jet aircraft engines, gasoline for automobiles and trucks.

You get the point I am trying to make. To power our high quality of living, we use about 100 Quadrillion Btu’s equivalent of energy. American citizens take energy for granted and many, especially the current Congress and President assume that the existing forms of energy can be substituted in the next 15 years with Renewable forms of energy such as windmills, solar panels and Hydrogen. This is the path our elected officials have us on. So, let me ask you to check the chart below and then visualize replacing the nuclear (8.5%), natural gas (32%), coal (11.4%) and petroleum (37%) with Renewables.  The total of these four sources of energy is 88.66 Quadrillion Btu’s or right at 89% of our total energy used each year. Note solar and wind was 1.04 and 2.74 Quadrillion Btu’s, totaling 3.78 Quadrillion Btu’s. Right at 3.8%.

Hydrogen is a medium that can be used for storage and is therefore zero on the chart below. Hydrogen is planned to be a large part of America’s future fuels, but it should be pointed out, hydrogen requires more energy to produce it by electrolysis than it will produce in a fuel cell or by combustion in an internal combustion engine.

Current Energy Costs for Various Fuels

I have never liked the word “Cheap” and try not to use it. However, when referring to fuel to produce power or motive force, cheaper energy is better. Example, electricity  produced by a gas turbine requires Capital cost to purchase the equipment, construction cost to build the power plant, employees to operate and maintain the plant and spare parts to keep the turbine and all of its auxiliary equipment in top condition. Would you be surprised if I said a gas turbine, combined cycle power plant of say, 600 MW may cost about $ 720 million dollars? The going cost today for a GTCC plant is about $1,200/kW installed capacity. Now, think about the cost of electricity produced by the GTCC plant. It would likely be about $0.02 per kWh if the natural gas fuel was $3.00/million Btu (British Thermal Units). Over 90% of the production cost of a modern high efficiency GTCC plant is for fuel. The raw natural gas fuel is the single most expensive component of electricity production cost. Not the amortization of capital cost, or labor or spare parts. It is fuel cost that governs the production cost of electricity. So, if the natural gas price doubles, so does the production cost of electricity.

Thanks to Hydraulic Fracturing, the War on Coal has not caused a dramatic increase in the cost of electricity because natural gas prices have been very low since about 2012 or so. 

Here is a chart of natural gas prices 2006-2012 from EIA data of Henry Hub spot prices, as recorded by the EIA. The war on coal has been going on since the Bill Clinton Administration but accelerated during Obama’s Presidency. The lower cost coal plants equipped with flue gas cleaning Baghouses, Electrostatic Precipitators, Selective Catalytic Reactors and  Sulfur Scrubbers were the lowest cost generators. Then came Hydraulic Fracturing and cheap natural gas. The low production cost of electricity production by natural gas made competition by coal nearly impossible. Remember, fuel is 90% + of the electricity production cost for GTCC plants. Thus, cheap gas equals very reasonable cost electricity. America has had a good run of reasonable cost electricity up to now.

NATURAL GAS PRICES AT THE HENRY HUB 2006-2012

The current natural gas prices have increased from $2.00/million last year, to nearly double the price of 2012. Therefore, if this trend continues electricity prices will have to increase or electricity from lower cost producers, such as coal and nuclear will be needed to keep power costs down.

Here below is the natural gas price as reported by Business Insider Commodities.

The figure below illustrates production cost for the fuel component only when comparing a clean coal plant with a gas turbine combined cycle plant:

COMPARATIVE ELECTRICITY PRODUCTION COSTS BY NATURAL GAS AND COAL FUELS AT THE PLANT BUSBAR

When fuel cost per million Btu’s increases, so does production cost.  Hydrogen cost if you can find it (California prices)  is about  $142.23/million Btu’s as compared to the comparatively less expensive natural gas at $4.00/million Btu.

Typical Fuel Costs Today

The above is my attempt to explain the fundamental costs of Thermal Power Generation of electricity. Because coal plants have many other costs of flue gas cleaning reagents, more O&M personnel and more maintenance requirements of a solid fuel power plant, the fuel cost component for a typical coal plant is about 75% of production cost. Fuel is still the major cost component for electricity generation for gas, coal and oil fueled thermal power plants. 

Gasoline, Regular Octane at               $3.00/gallon   116,000 Btu’s/gal.       $25.86/million Btu’s

Diesel Fuel                                          $3.00/gallon   135,000 Btu’s/gallon  $22.22/million Btu’s

Jet Fuel Jet A   (IATA airline cost)       $1.93/gallon   119,000 Btu’s/gal.      $16.22/million Btu’s

Natural Gas at Henry Hub (July 27, 2021)                                                      $ 3.97/million Btu’s

Coal delivered at SC Power plant estimated                                                  $ 2.00/million Btu’s

The above shows traditional energy costs for “Heat-Engines”. There is a push by the Democrat’s in government to change to “Green Renewable Power”.  Autos, airplanes and trucks  cannot be run on windmills or solar. But, the technology to power these heat engines with Hydrogen is technically possible. The amount of power output is conversion of hydrogen into either electricity through the use of fuel cells or by combustion in an internal combustion engine. The cost to operate will be commensurate with the energy contained in a given unit of hydrogen, usually expressed as Btu’s. The equivalent cost of hydrogen is about $16.51 to replace a gallon of gasoline. Perhaps some day the cost of hydrogen will come down to compare with gasoline prices for a given energy output? 

CONCLUSION:

Net Zero Carbon will come at a very high cost and the high cost will harm our current Freedoms.

Dick Storm

August 5, 2021

References:

  1. Natural Gas Prices from Business Insider commodities: https://markets.businessinsider.com/commodities/natural-gas-price
  2. Storm Technologies Seminar information on economics of power generation.
  3. “Blue Planet in Green Shackles” by Vaclav Klaus Competitive Enterprise Institute, 2007
  4. IATA Jet Fuel Prices: https://www.iata.org/en/publications/economics/fuel-monitor/
  5. Chevron Aviation Jet Fuel specs: https://www.chevron.com/-/media/chevron/operations/documents/aviation-tech-review.pdf
  6. Coal Costs by EIA Coal Markets: https://www.eia.gov/coal/markets/
  7. California Hydrogen Fuel Council: https://cafcp.org/sites/default/files/Path-to-Hydrogen-Competitiveness_Full-Study-1.pdf
  8. Lawrence Livermore National Laboratory Sankey Diagram of Energy Flows: https://str.llnl.gov/content/pages/2021-02/pdf/02.02.2.pdf