This document summarizes discussions of Don Spellman, a senior nuclear engineer, retired U.S. Navy Submarine officer and Dick Storm, a retired coal power engineer. We have had ongoing discussions for several years regarding the inadequacy of new replacement of Dispatchable or Base Load capable coal and or nuclear power plants. Therefore, We decided to jointly write this article to share our views.
Introduction
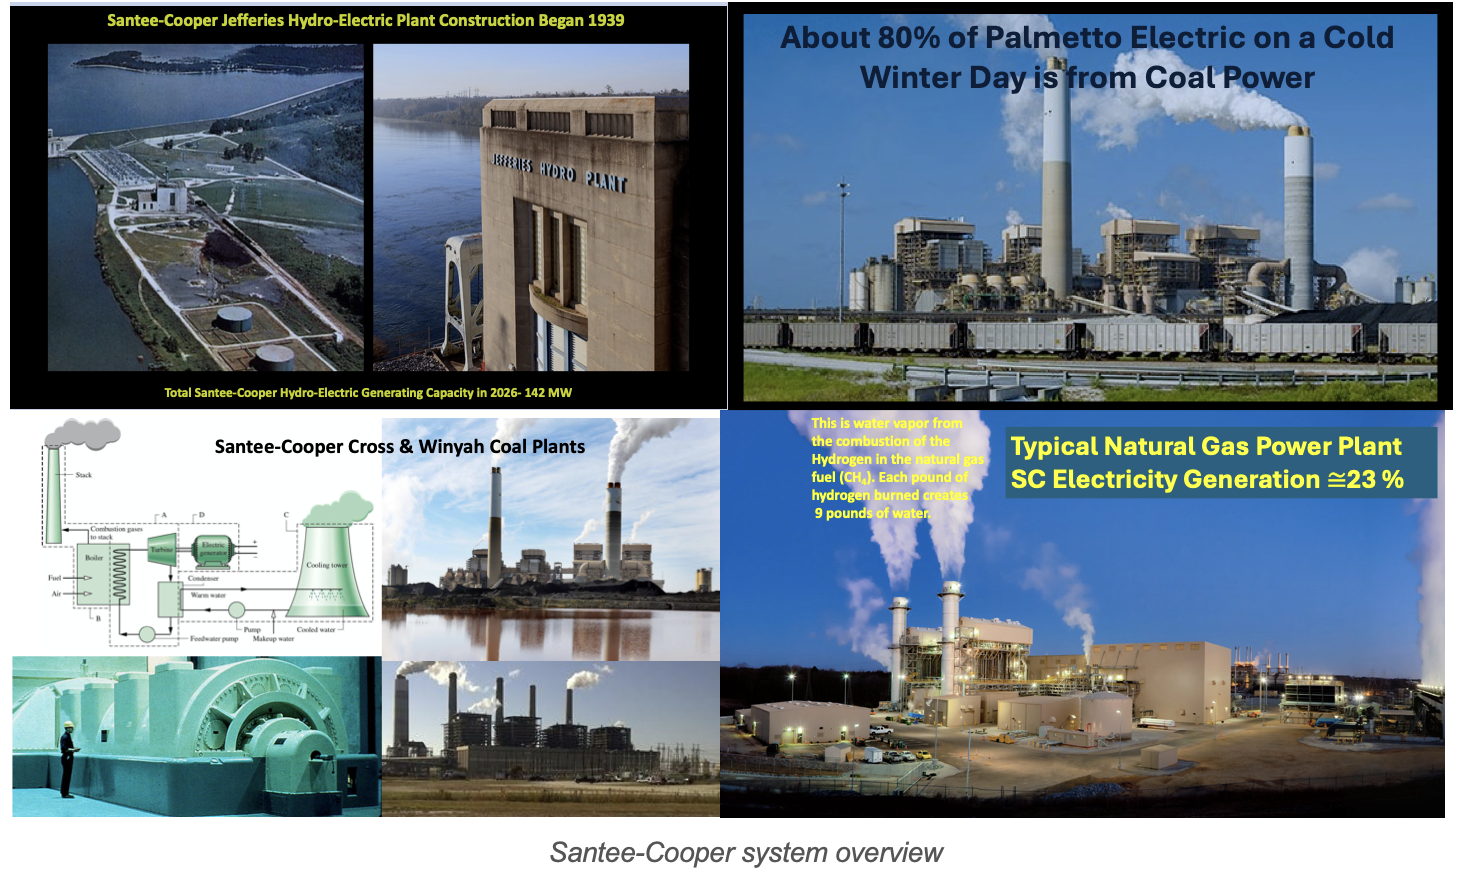
America’s Grid grew from the days of Edison, Tesla and Westinghouse to about the 1990’s in an orderly, well planned manner. Both wholesale and retail electricity was both reliable and affordable. America’s Grid was the best in the world. Up until that time, planning for growth was done by regional, regulated utilities such as Duke Power, Virginia Electric Power Company (VEPCO), Carolina Power & Light (CP&L), Philadelphia Electric, Potomac Electric Power Company (PEPCO), Delmarva Power, South Carolina Electric and Gas (SCE&G), Santee-Cooper and so forth. Each of these Regional Utilities were accountable for future new generation planning, selecting the most appropriate new generation capacity and planning for growth. That was then. About 1990 there became a movement to De-Regulate Electric Utilities and to separate electricity generation from Transmission and Distribution. Not all states agreed to this, but many did and the huge PJM Interconnection which includes most of the northeast between NJ and Illinois serves as a controlling agency to determine which power generation will be utilized based on the lowest price bid. PJM and the other RTO’s such as MISO, ERCOT, NY-ISO, NE-ISO, CAISO serve as “Air Traffic Controllers” to direct Bulk Power from the least cost generators. It should be mentioned, of the once fine Regional Utilities mentioned above that have merged with others and become part of the PJM Interconnection, at this writing, Santee-Cooper in South Carolina remains as one of the sole survivors. The S.C. Legislature may yet kill it, but as of today, Santee- Cooper is alive and well and still generates most of it’s electricity from reliable, affordable coal and 322 MW of joint ownership with Dominion Energy in the Summer nuclear plant.
Well, this de-Regulation model worked pretty well when we had an abundance of excess generation capacity, (1990-12012 when nuclear and coal provided about 70% of America’s electricity. It continued to work pretty well as the U.S. entered the “Shale Gas Revolution” about 2012 and natural gas became a lower cost fuel than coal. The EPA’s War on Coal hit its stride during the Obama administration and the Endangerment Finding was made a law, thus essentially outlawing the building of new coal plants. Electricity prices continued to be reasonable due to the switching of Bulk Power domination by coal and nuclear to natural gas. As long as gas remained below $3.00/ million BTU, this was no problem. Then the government incentives for wind and solar continued to escalate and become attractive for both private generators and for Regulated Utilities. More and more wind and solar was forced onto the Grid and backup generation capacity has been by natural gas turbines. Long story shortened, what was a very reliable Grid with regional accountability for investing in new generation capacity has become a hodgepodge of Dysfunctional Regulations and Rules/laws. Meanwhile, the public has been wrongly indoctrinated into believing that wind, solar and batteries are less expensive and more environmentally acceptable than coal or nuclear power.
The two senior engineer authors of this article have watched this horrible breaking of our once well-tuned, reliable and well managed Bulk Power Supply and we remember the low cost, reliable electricity provided in in 2008 which was about 70% coal and nuclear power. About 50% coal and 20% nuclear. In the author’s opinions and experience, coal and nuclear are the two sources that must be deployed quickly to keep America’s Grid reliable, resilient and affordable. This is based on a combined 100+ years of experience. Our Bios are at the end.
Electricity Load Growth till 2050, Expected Demand and Needed Generation Resources
From FERC – “U.S. electricity demand is projected to surge by 20% to 25% by 2030 compared to today’s levels. This sudden spike—driven by the AI and data center boom, industrial reshoring, and electric vehicle adoption—means that peak grid demand will jump from 760 GW to an estimated 850–930 GW.”
From NERC – “The North American electric grid faces intensifying reliability risks over the next decade as demand growth driven by data centers and artificial intelligence threatens to outpace resource additions”, according to the 2025 Long-Term Reliability Assessment (LTRA) released Jan. 29 by the North American Electric Reliability Corporation (NERC).

90 GW of New Dispatchable Generation is Needed by 2030
Total PEAK electric load of the lower 48 states is expected to rise from 760 GW to 850 GW by 2030. So, let’s do the math
(850 – 760 = 90GW minimum needed by 2030. (= 90 GW/4 yrs = 22 GW per year). “
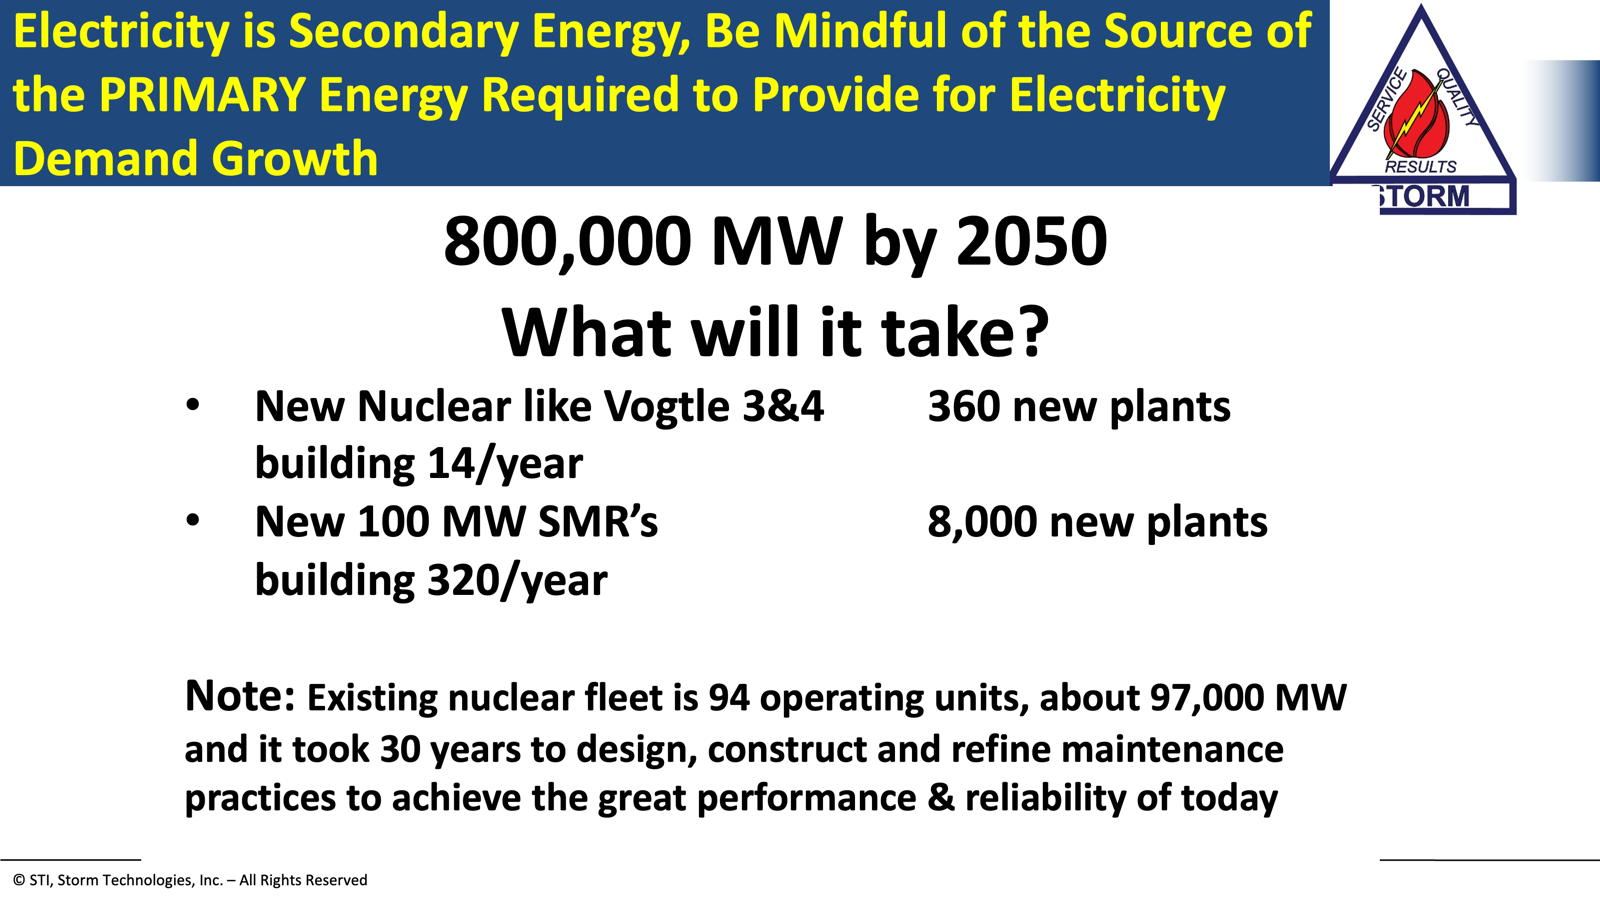
The U.S. currently has about 1400 GW of installed generation capacity. About 97 GW of existing nuclear generation with anaverage age of about 40 to 60 years. Therefore the 90 GW minimum needed capacity by 2030 according to FERC is about a 12% increase in total generation capability. This new generation should be capable of 24/7 Dispatchable or Base Loadcapable. Only nuclear, coal and natural gas generators can provide base load capacity plus being able to “follow the load” at peak summer and winter needs.
Nuclear power plants once on-line can achieve a 96% base load capacity factor as Duke Energy has proven. Well run coal plants can achieve a 24/7 capacity factor of over 75% when properly operated and maintained. Future electricity load growth of the magnitude of 100-170 GW by 2030 has been forecasted by FERC, NEMA, ICF and others. This amount of new generation is realistically impossible to build in four years.
90 GW of New Dispatchable Generation by 2030, What are the Options?
The electricity growth in the next decade, if we are to continue a growing economy and including improve industrial production, power EV’s, AI-Data Centers and is not hyperbole or exaggerated growth expectations, to expect electricity peak Demand to grow and require 90 GW New Generation. We think this is a realistic estimate.
Annual Additions Needed: 850 – 760 = 90 GW minimum needed by 2030. (= 90 GW in 4 yrs is 22 GW per year). So, the U.S.will need to add about 22 GW of generation capacity every year to keep up, roughly double the historical pace. 90 GW/year is about 7 – 1300 MW nuclear units or 15 – 800 MW coal plants or 10 – 880 MW Combined Gas Cycle gas plants or, obviously, a mix of these discounting the contribution from wind or solar units as they do not provide base load capacity nor load following capability and have very low capacity factors.
The new generation capacity in our analysis should be all Dispatchable power generation capacity. Dispatchable means it can respond to demand immediately, as soon as it is needed to meet peak power summer and winter loads. Reliable and either Dispatchable or Base Load generation of Bulk Power has been proven over decades to be affordable by Nuclear, Coal and Gas fueled thermal power plants
How About Building an appropriate number of New Coal Plants by 2030 or 2050?
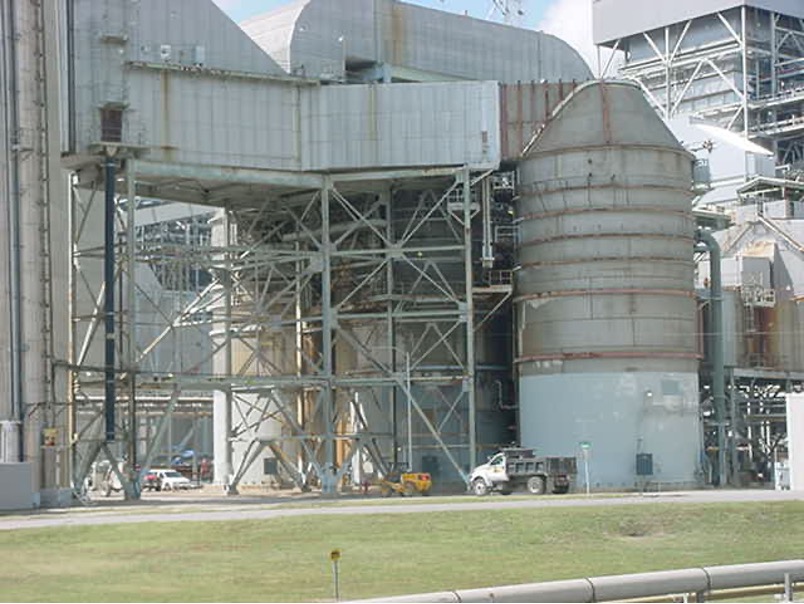
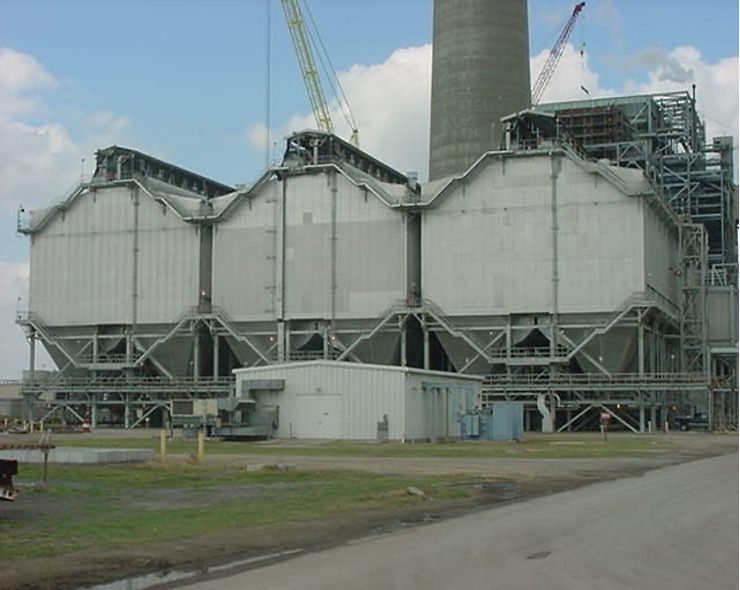
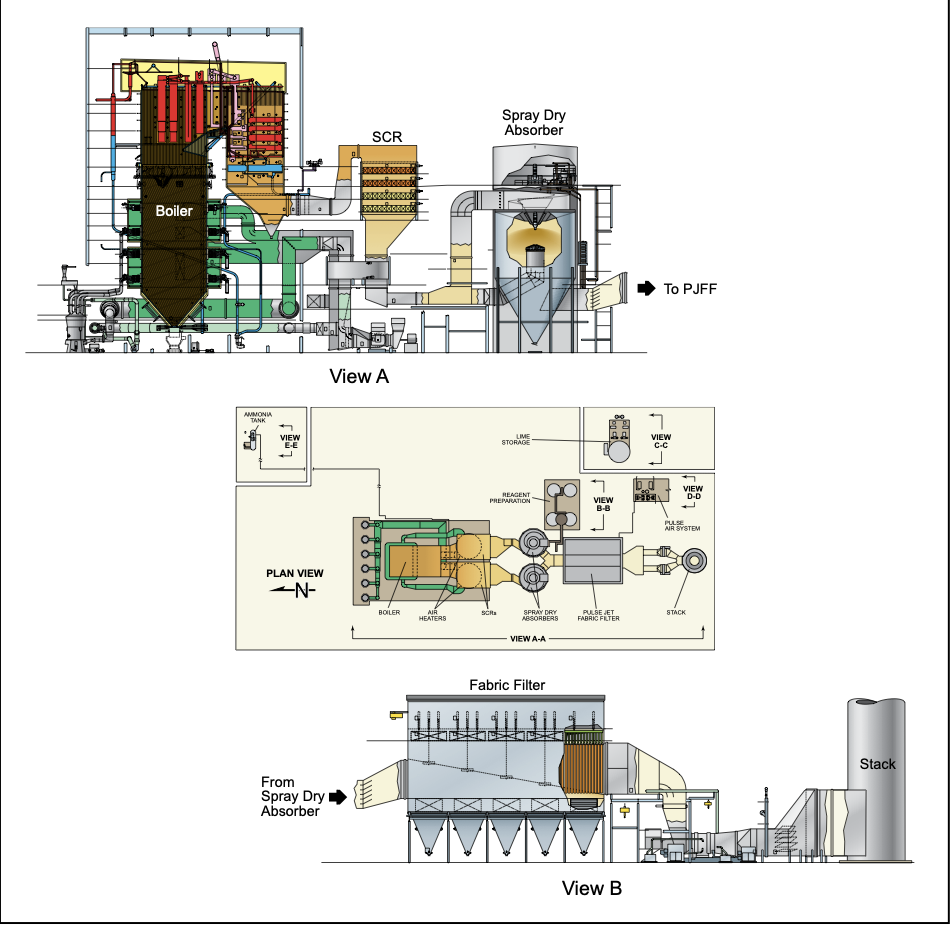
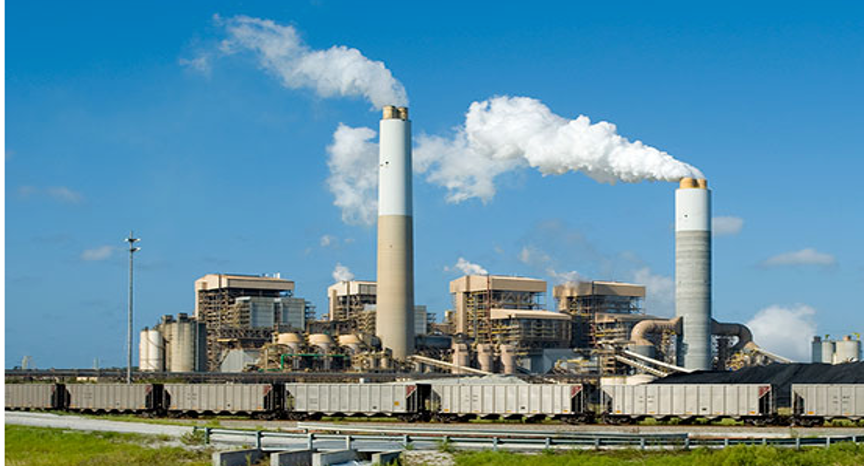
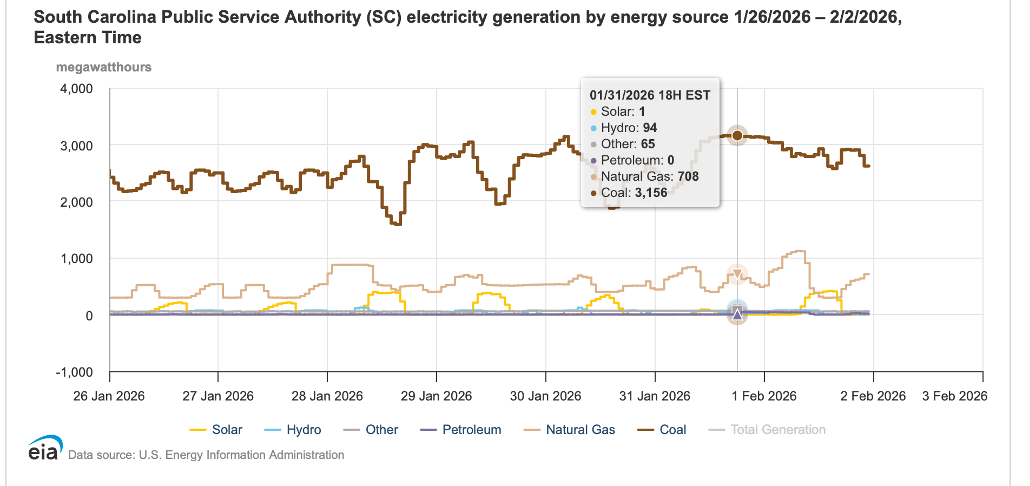
To put this in perspective of new coal plants. Let us look at the Cross Generating Station owned and operated by Santee-Cooper in the lowlands of South Carolina. This coal plant has modern FGD and emissions controls. It is an example of a clean coal plant The four units, each about 600 MW in capacity was constructed between 1984 and 2005. The 4-unit plant is rated at 2350 MW. Let that sink in. This is about the same generation capacity as the Vogtle nuclear expansion of units 3 and 4 which took over ten years to build. The coal plant below was constructed over a 20 year period.
90 GW of new Dispatchable Generation is the equivalent of 38 plants similar to Cross Generating Station
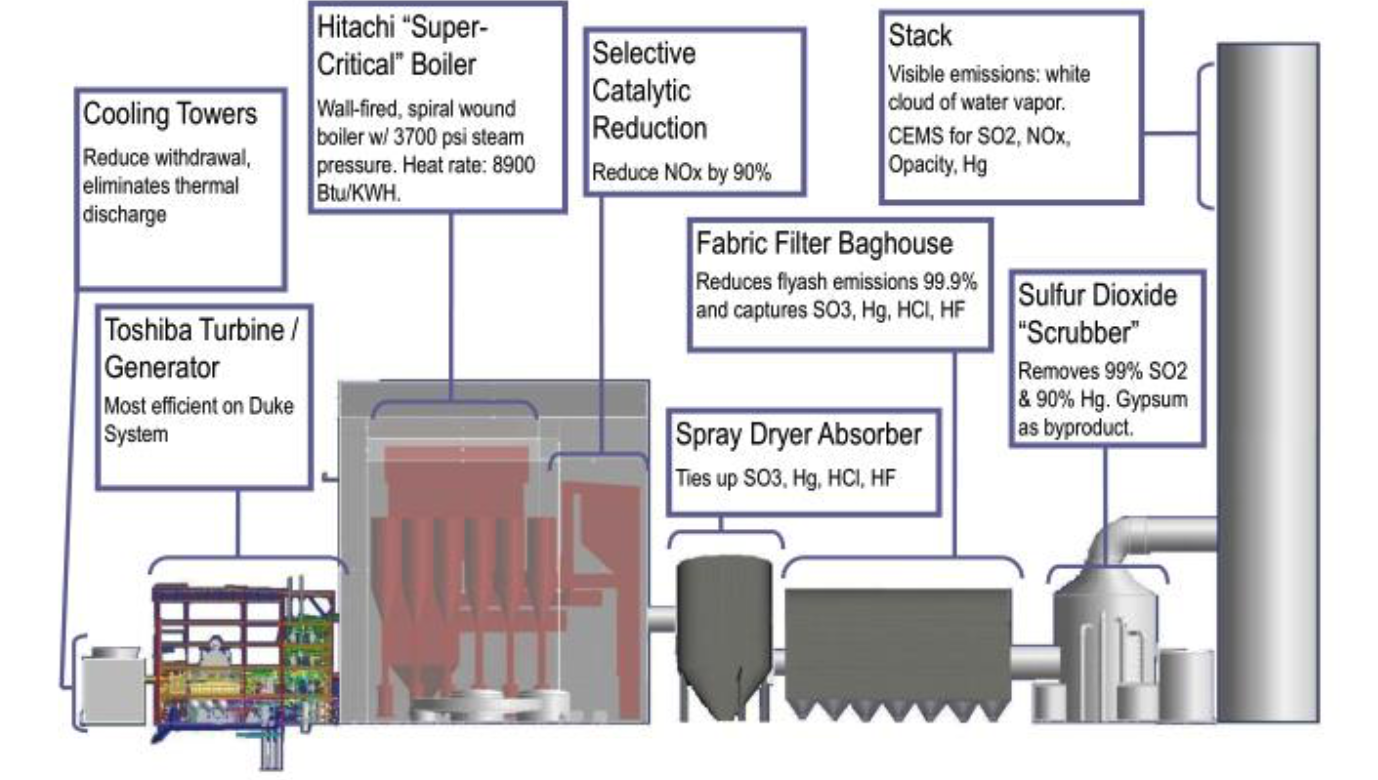
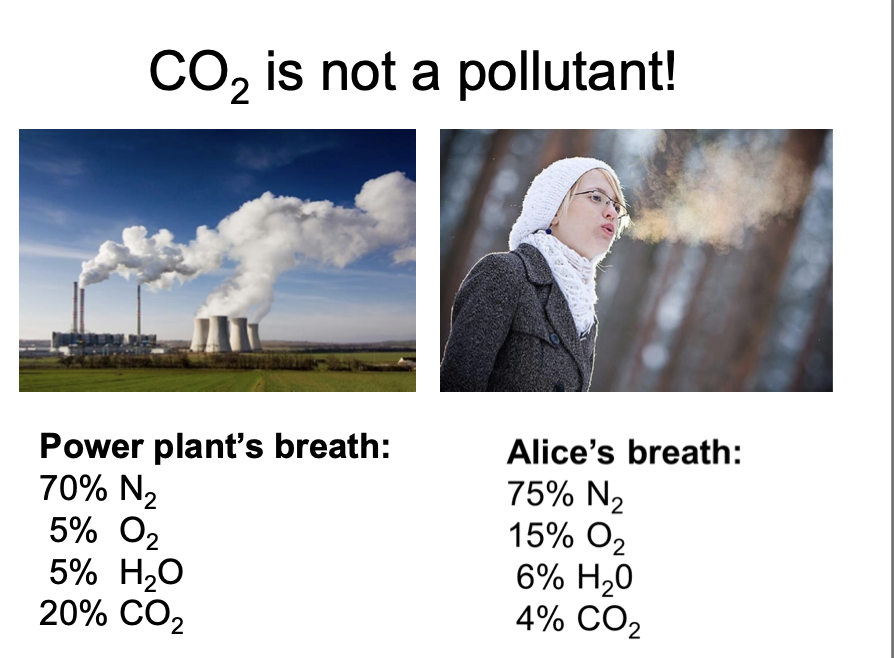
Dr. William Happer of the CO2 Coalition presented a description of a modern coal fueled power plant with Alice’s breath. The slide from Dr. Happer’s presentation is show below.


The numbers are “Ball Park” approximate for a coal power plant. For a nuclear power plant, of course, the cooling tower plume would have no CO2 and only water vapor. Such as is shown below in the photo of the Vogtle nuclear power plant.

Above is a picture above of the 2 new 1000 MW Vogtle Nuclear units. The white plume emitted from a modern nuclear plant is entirely water vapor and even purer than the above picture of Alice’s breath.
Georgia Power’s Plant Vogtle expansion. This is about 2,000 MW of new capacity that was installed in the last dozen years. That 2,000 MW of new capacity required $35 Billion dollars of capital expenditure including the initial fuel load and 12 years to complete. Delays were primarily due to poor management practices, changing regulations. and supply chain issues. This plant has two similar sized Westinghouse reactors with an experienced workforce available at an existing plant. It still took 12 years to complete.
If the 90 GW of new capacity could be achieved by building new nuclear units like Plant Vogtle, then it would take about 77 new 1,300 MW Vogtle like nuclear units 3 & 4 to be built in the next 10 to 25 years. Current reorganization at the Nuclear Regulatory Commission should lead to a significant reduction in nuclear plant construction time and cost.
Don Spellman spent 20 years in the nuclear NAVY, 11 years consulting to 4 new build reactors related to design control and configuration management and then 26 years at Oak Ridge National Laboratory as a lead engineer for nuclear fuel development, implementation of DOE’s Mixed Oxide Fuel Facility at Savannah River National Laboratory and implementation at ORNL of a spent fuel examination facility. Therefore, the comments and discussion regarding nuclear are from an experienced nuclear power engineer.
How About Building An Appropriate Number of Combined Cycle Gas Fueled Plants by 2030?
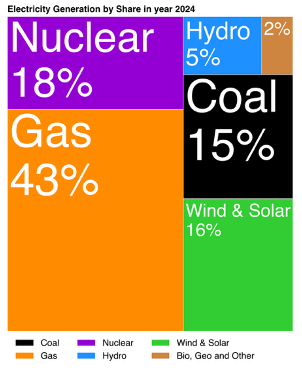
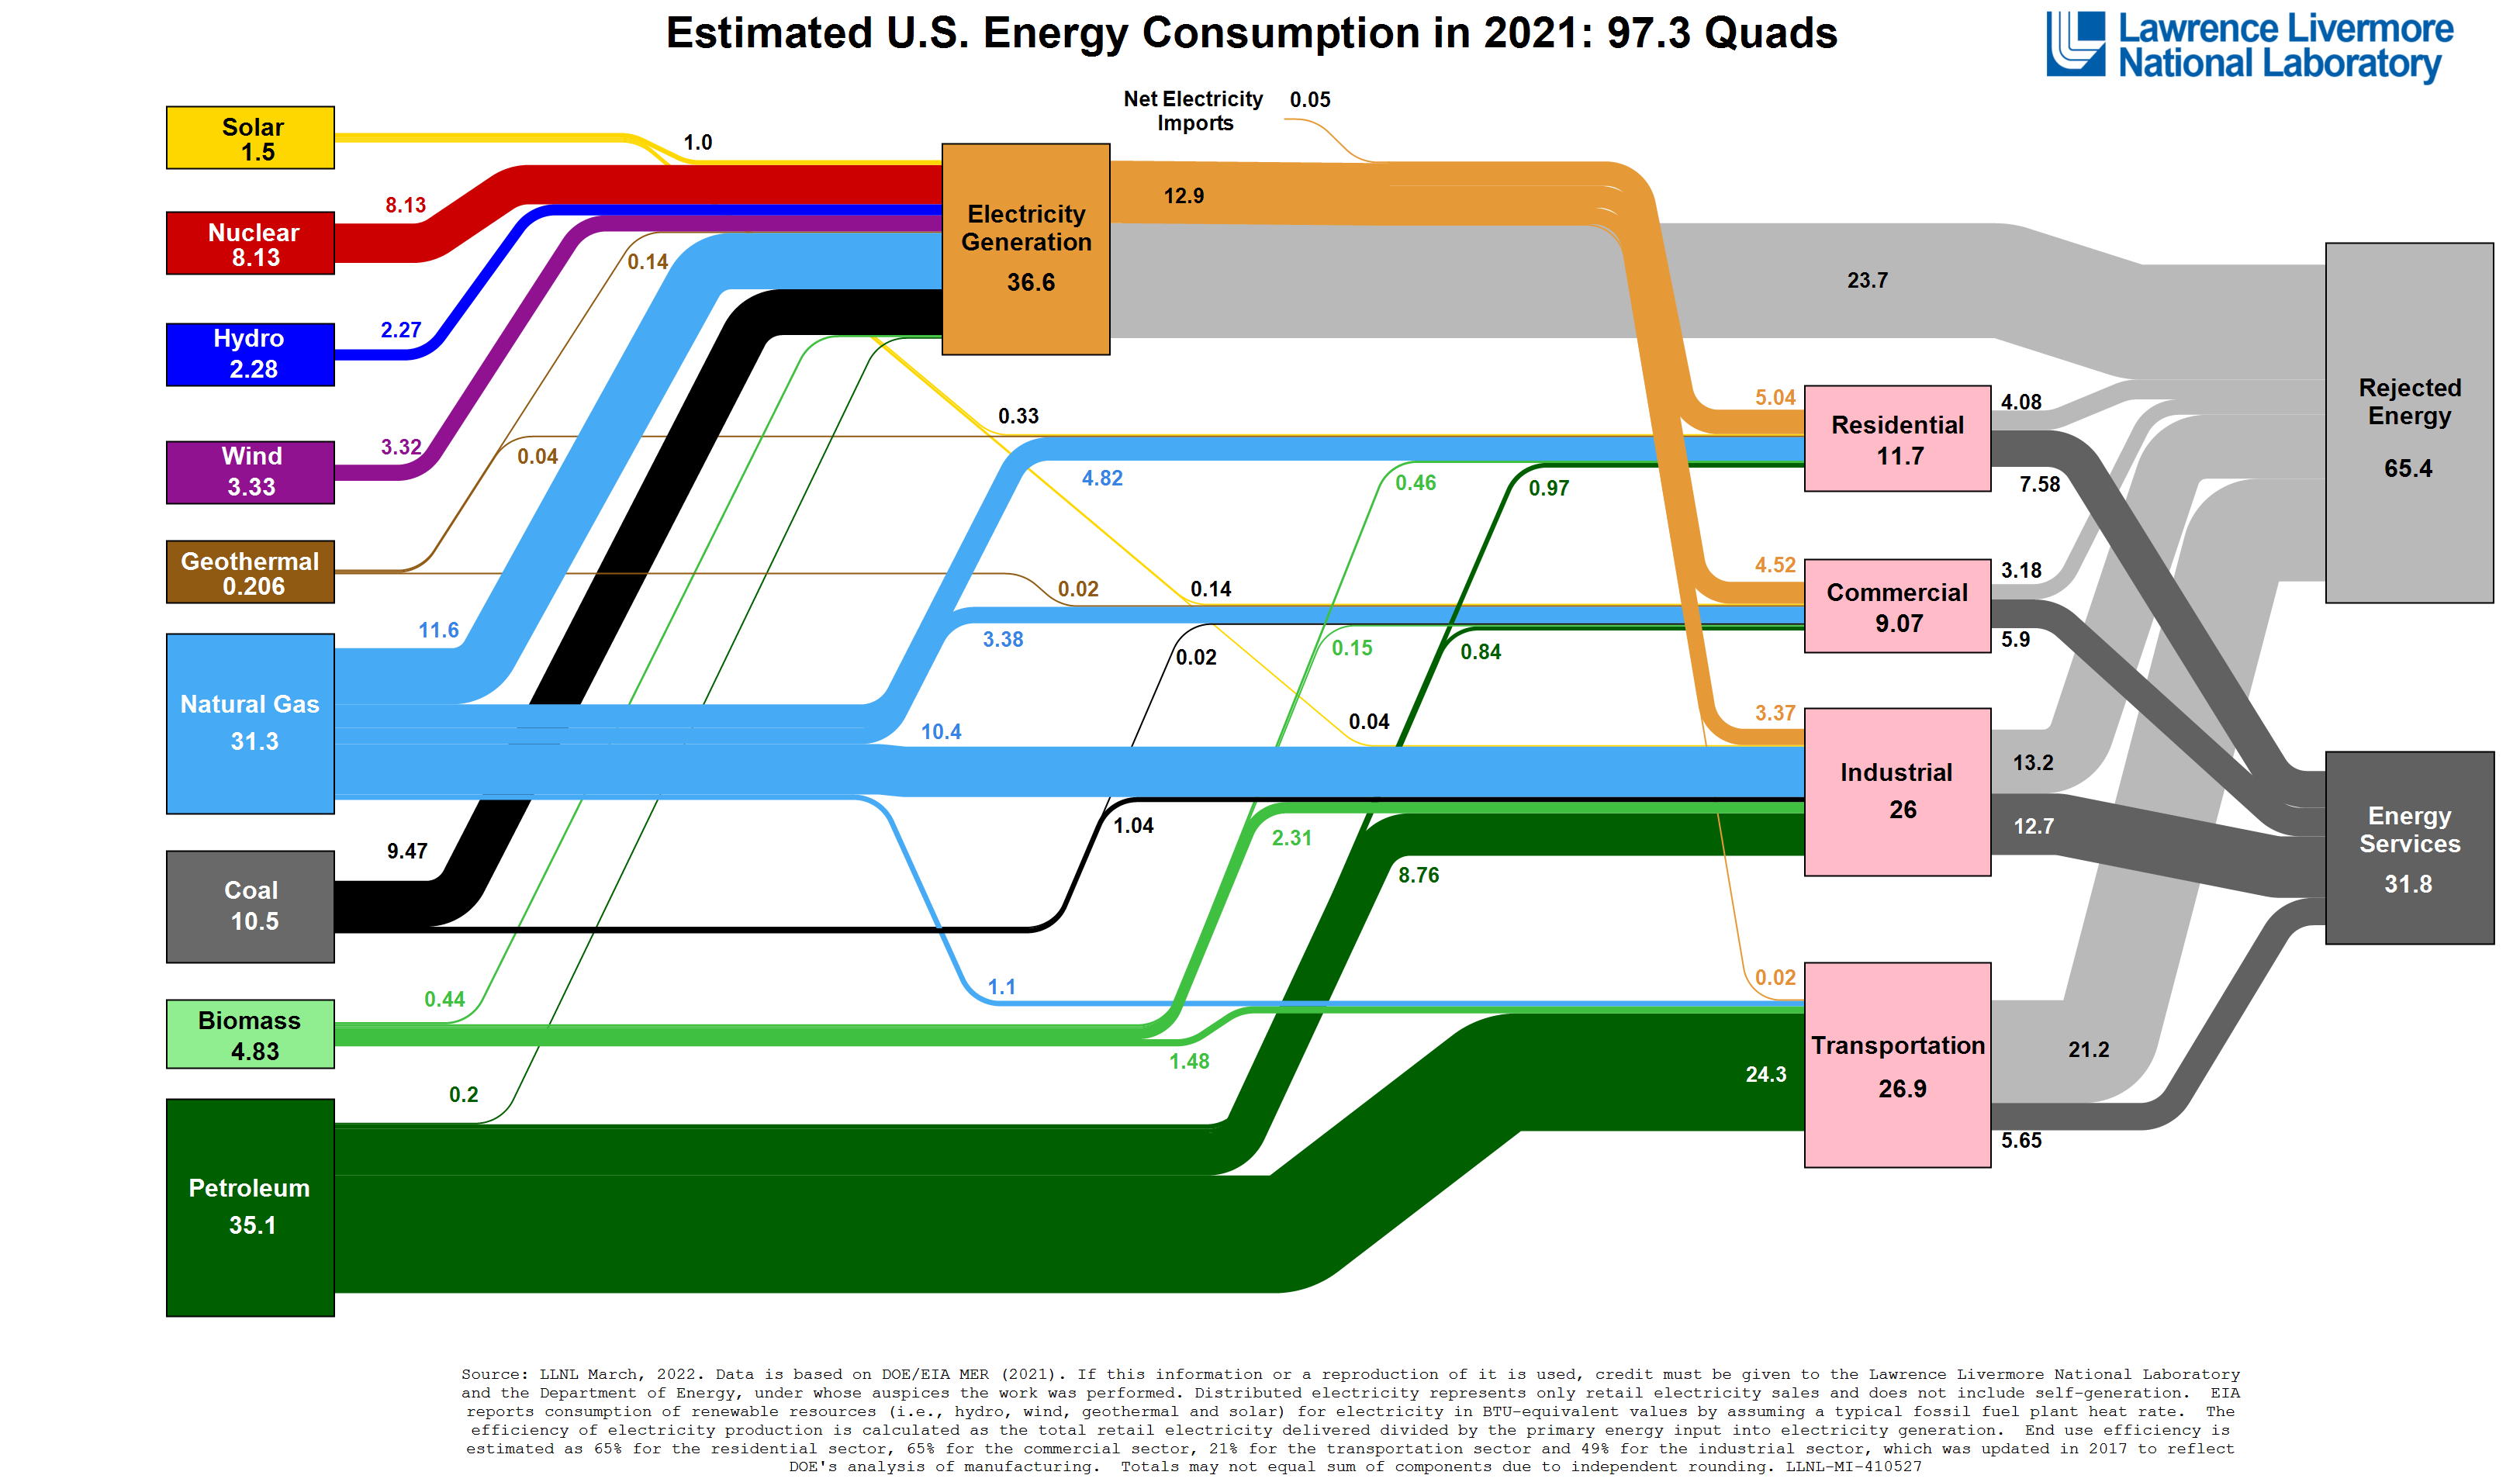
An 880-megawatt (MW) gas-fired electric plant usually operates as a combined-cycle unit, capturing waste heat to generate extra electricity. A notable regional example is the Delta Energy Center: An 880-MW combined-cycle plant located in Pittsburg, California. Natural gas is the default fuel for power generation for quick response new power generation. Every new MW of new bulk power that is installed by wind and solar generation must be backed up by dispatchable bulk power that can to be brought on-line when the sun sets and the wind stops. Gas powered generation It is the easiest form to get permitted to build. Utility executives like gas because it is also the least capital cost. Because of these economic realities in a thoroughly dysfunctional regulatory environment, natural gas has risen to become the primary fuel source for power generation. Now at about a 43% of the total U.S. electricity generation. Natural gas has replaced coal as the primary energy source since the revolutionary advances in hydraulic fracturing for natural gas production which became commercially viable about 2010. Before the shale gas revolution, coal provided about 50% of electricity production and nuclear about 20%.
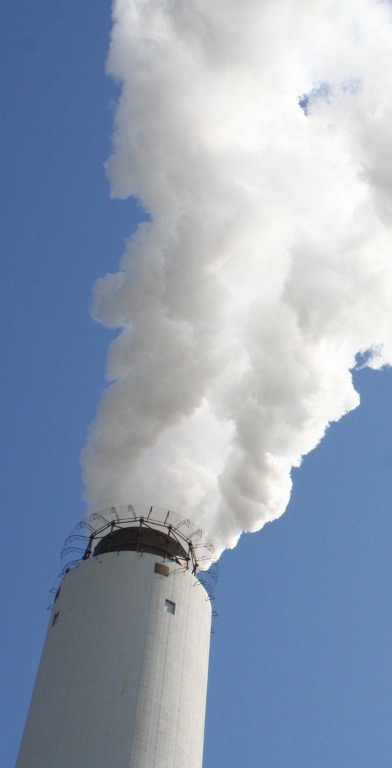
Here is a picture of a typical CCGT power plant. This one is 600 MW. Notice the stack plume? This is mostly water vapor from the combustion of hydrogen in the natural gas fuel. Each pound of hydrogen when combusted, creates nine pounds of water, thus the extreme white plume of water vapor on a cold winter day.

Back to CCGT capacity to meet the 90 GW of new generating capacity by 2030. It would take 102 (880 MW each) units such as the Delta plant in California to produce 90 GW.
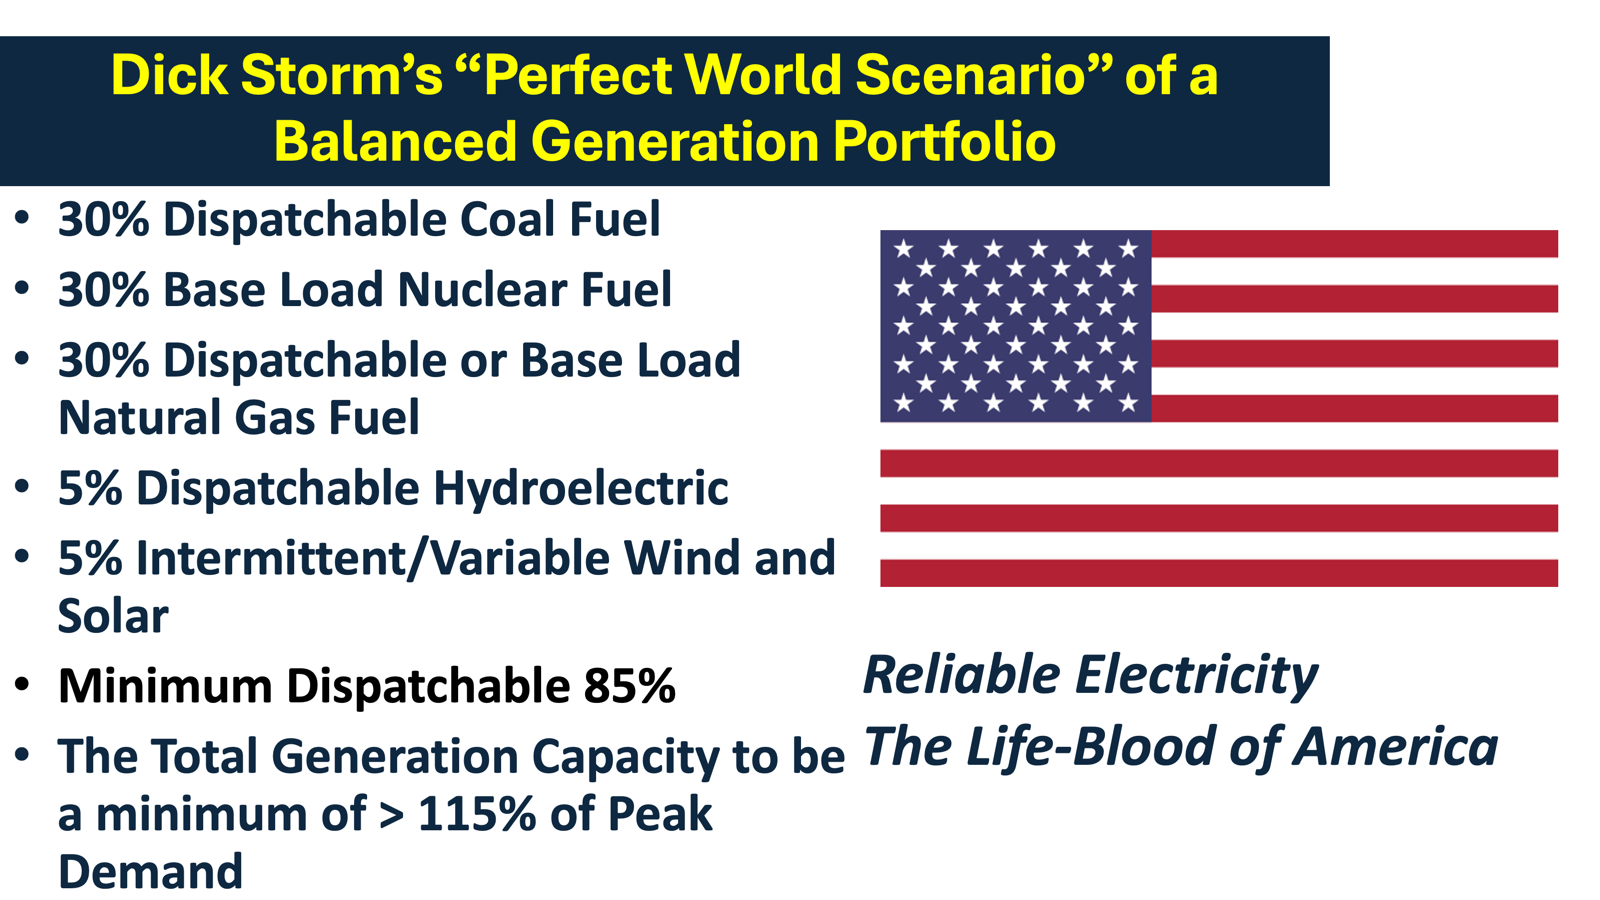
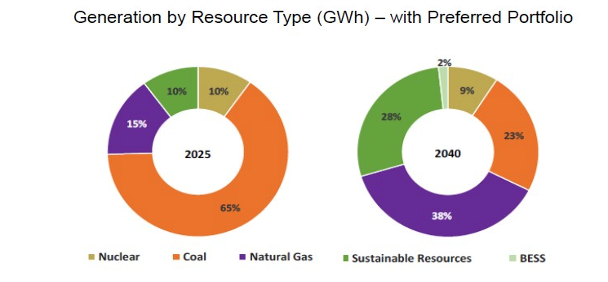
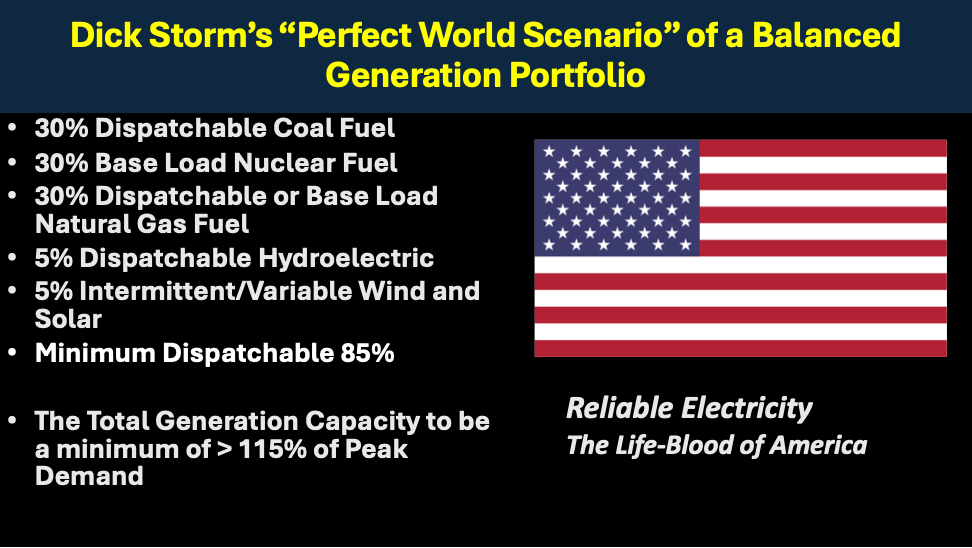
America Needs a Balanced Generation Portfolio for the Grid
Combined cycle power plants (CCPPs) are highly efficient systems that generate electricity efficiently and cleanly. However, in our opinion, America is too dependent on pipeline supplied gas supplies now and increasing the CCGT fleet will only exacerbate that single fuel dependence. For Grid reliability, resiliency and to provide adequate quantities of affordable Bulk Power, we believe a Balanced Generation Portfolio is optimum. Such as, shown below.

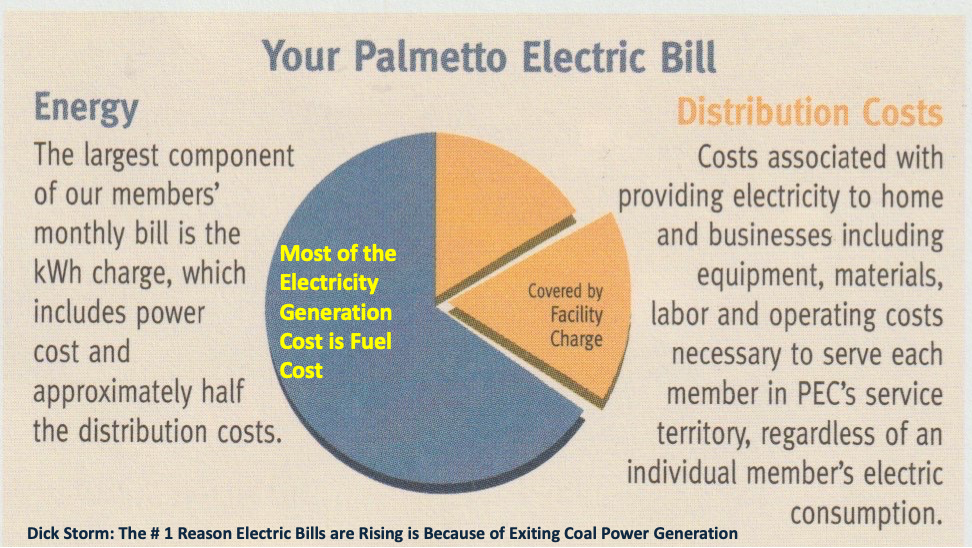
Fuel is the Major Cost Component in the Production of Electricity in a Gas Power Plant
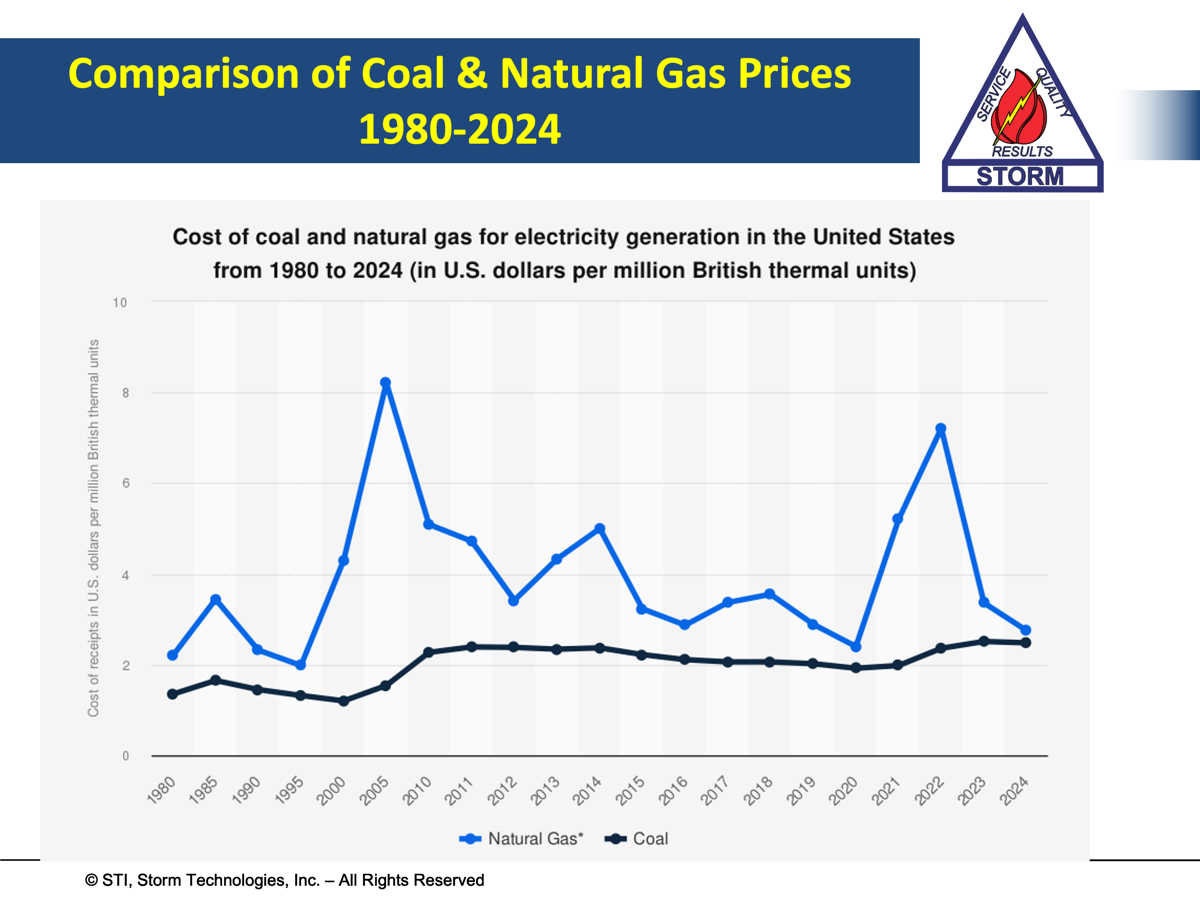
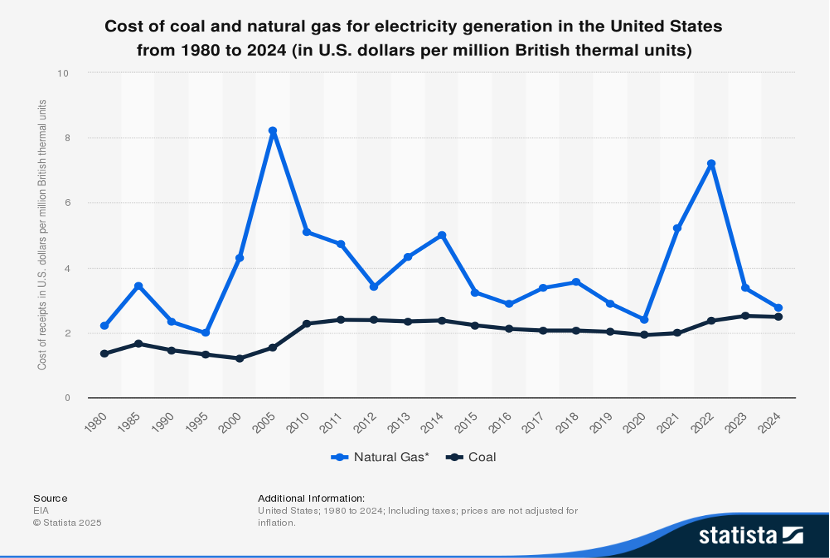
Natural gas has been abundant and cheap since the Shale Gas Revolution which began about 2010. The U.S. produces more gas than any other country and has begun exporting as LNG. The cost of gas, however, has been volatile and will likely remain volatile based on Global demand. Here is a chart comparing the cost of gas to coal over the last 44 years.

The cost component of power production from a CCGT is about 90% fuel cost. Thus, if the fuel cost doubles as it has in the past during extreme demand periods, so does the production cost of electricity double. Thus, our recommendation of a Balanced Generation Portfolio which includes coal and nuclear generation. Another consideration is national security and Grid Resilience. If nearly 50% of America’s Bulk Power is generated from pipeline supplied gas and there is a major pipeline failure, then power shortages can occur. A coal plant has on-site fuel storage capability for months, nuclear, years of on-site energy storage. Batteries, hours.
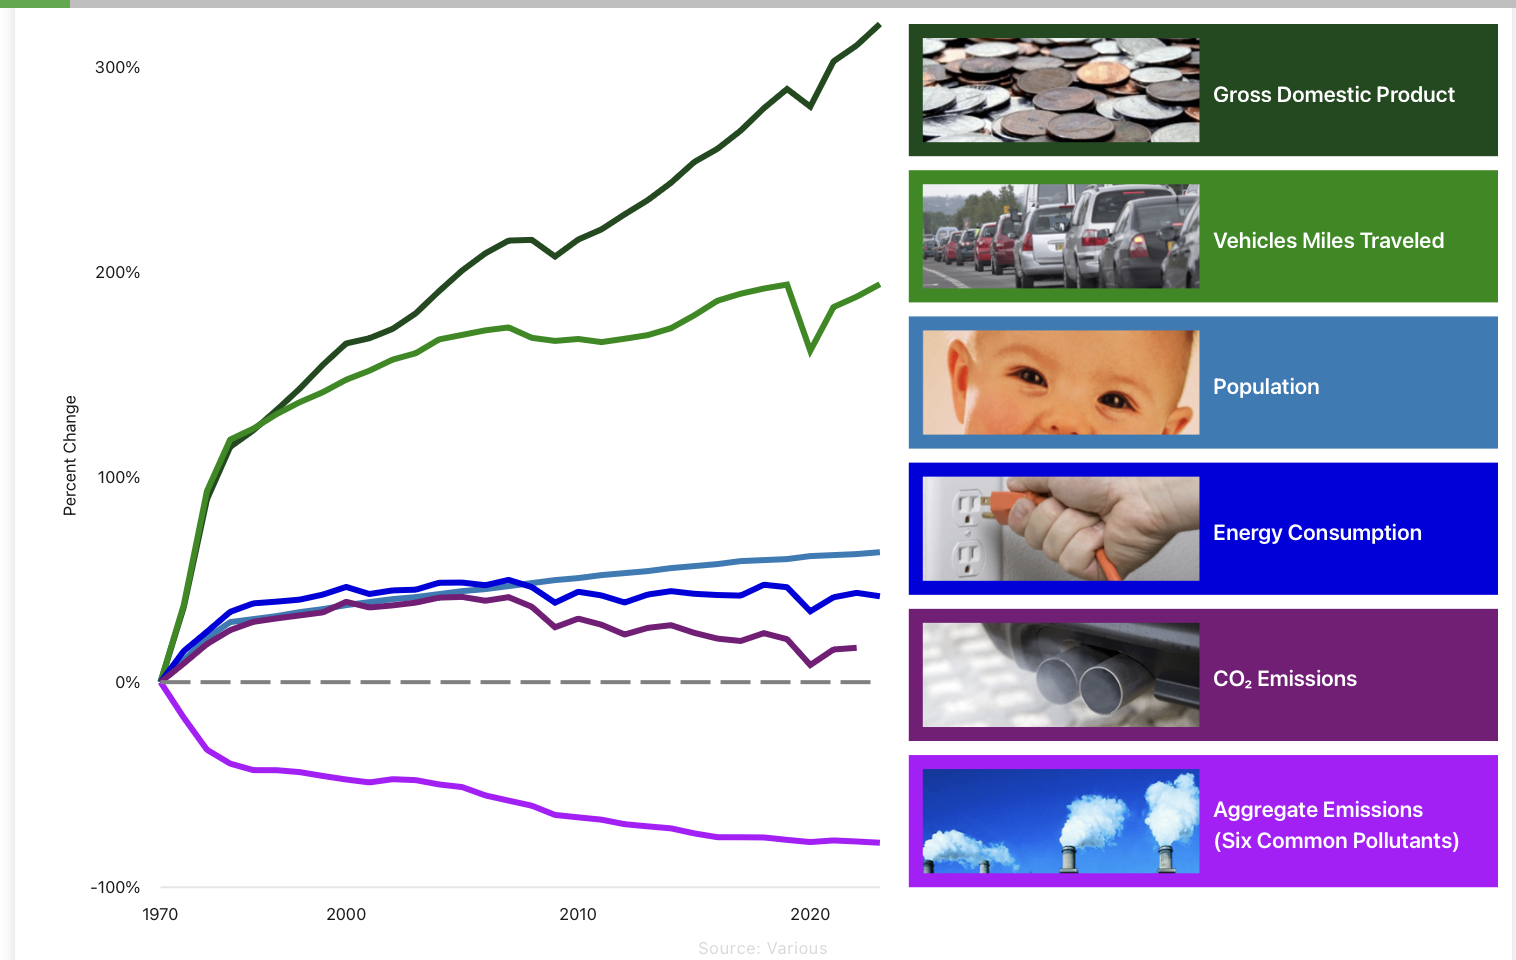
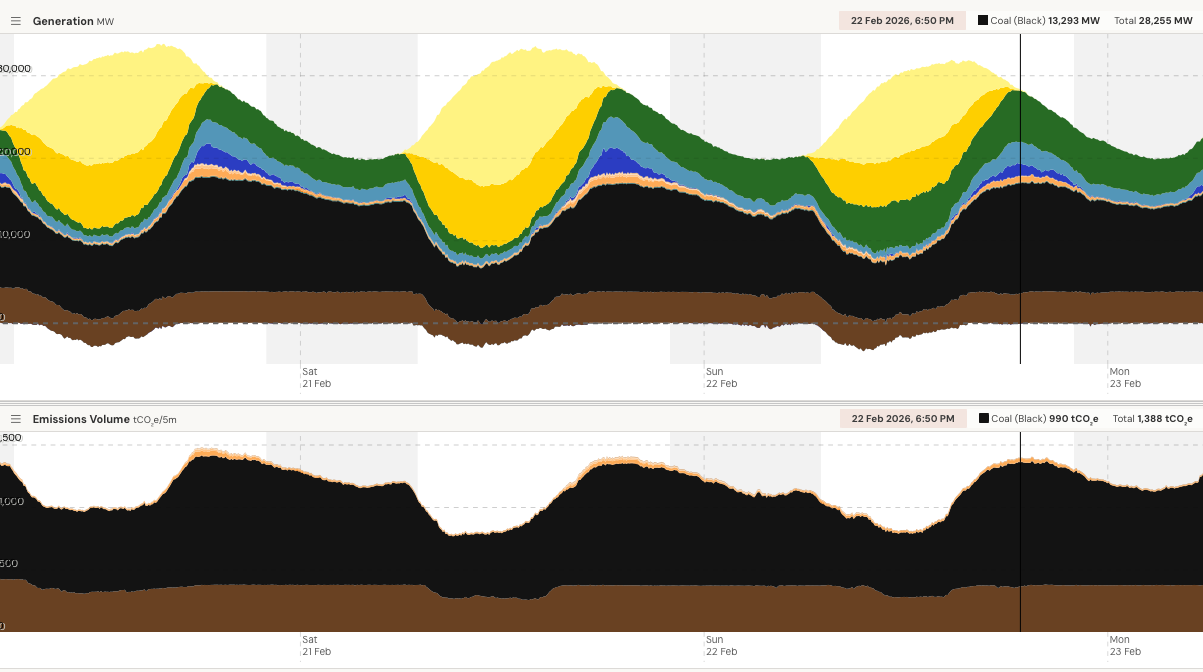
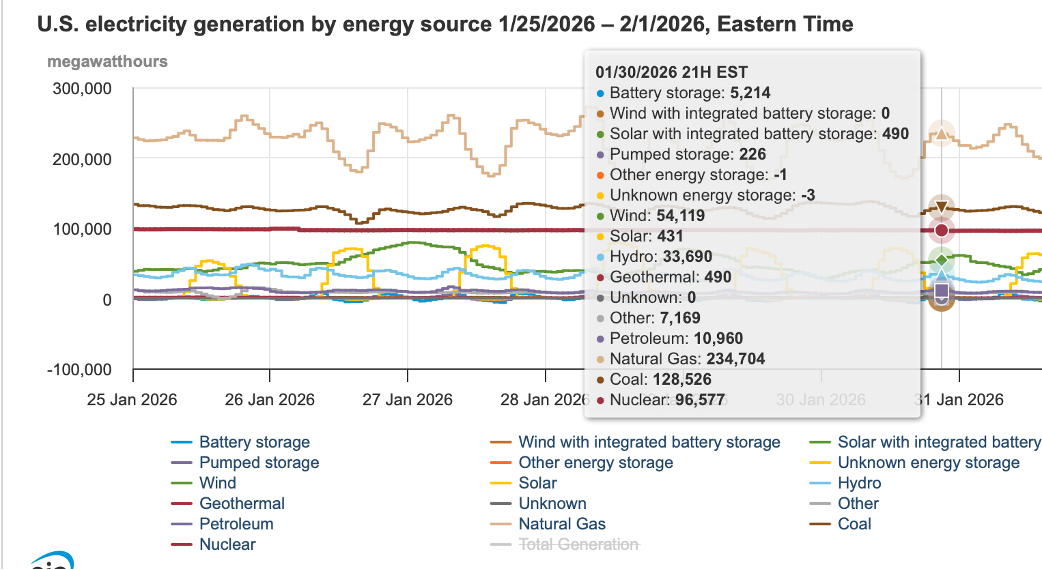
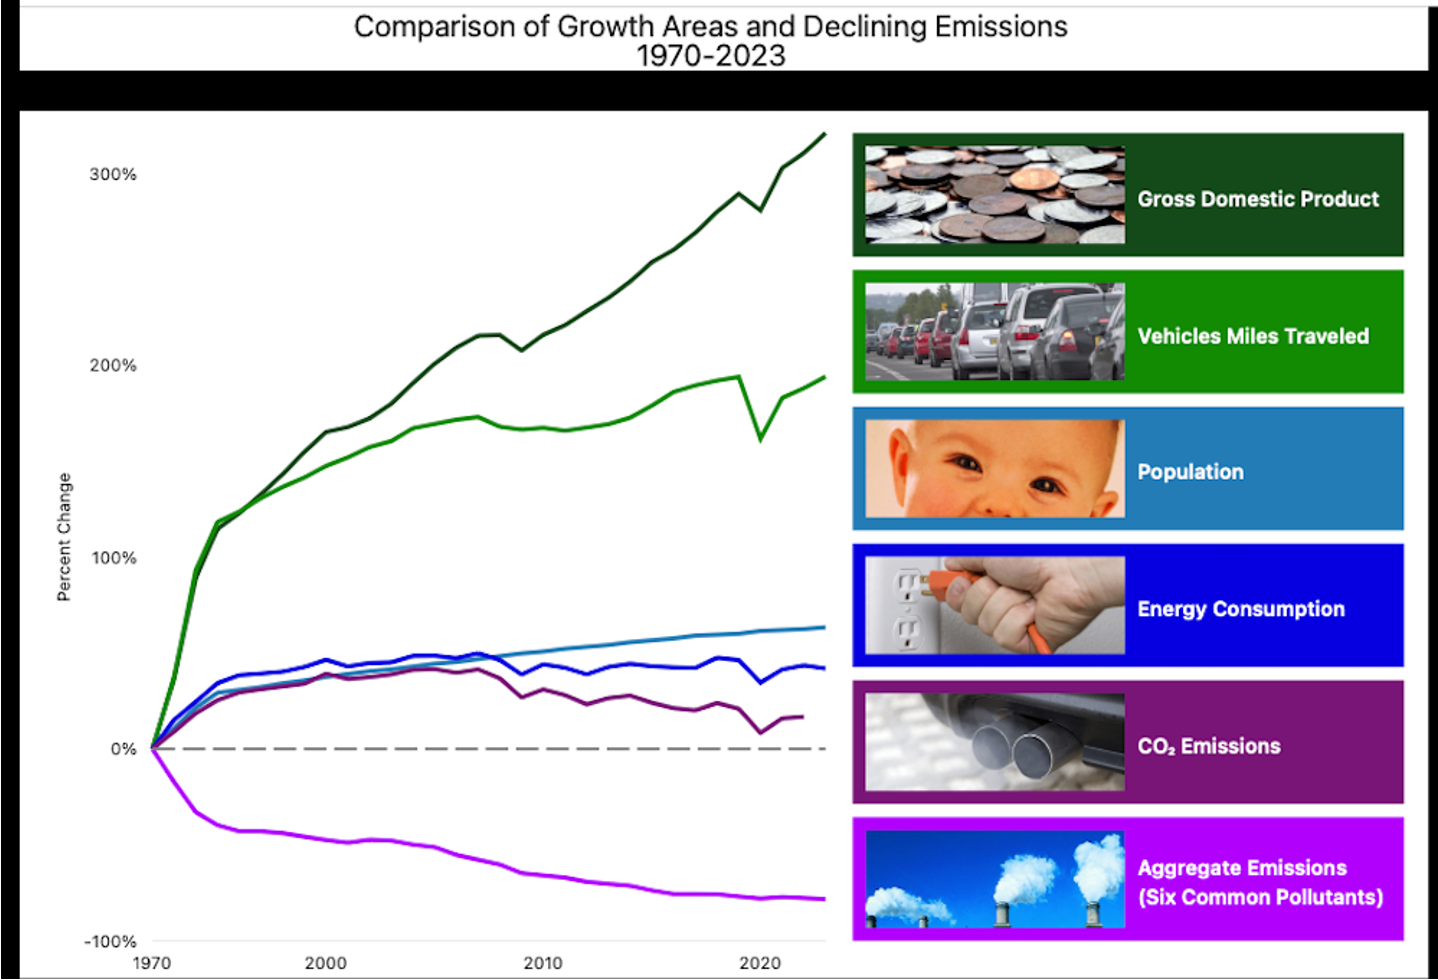
Historical Bulk Power Generation When Coal and Nuclear Provided Approx. 70% of America’s Power
These were the good old days. In 2010 Coal provided about 50% and nuclear about 20% of the fuel for America’s Bulk Power Supply.

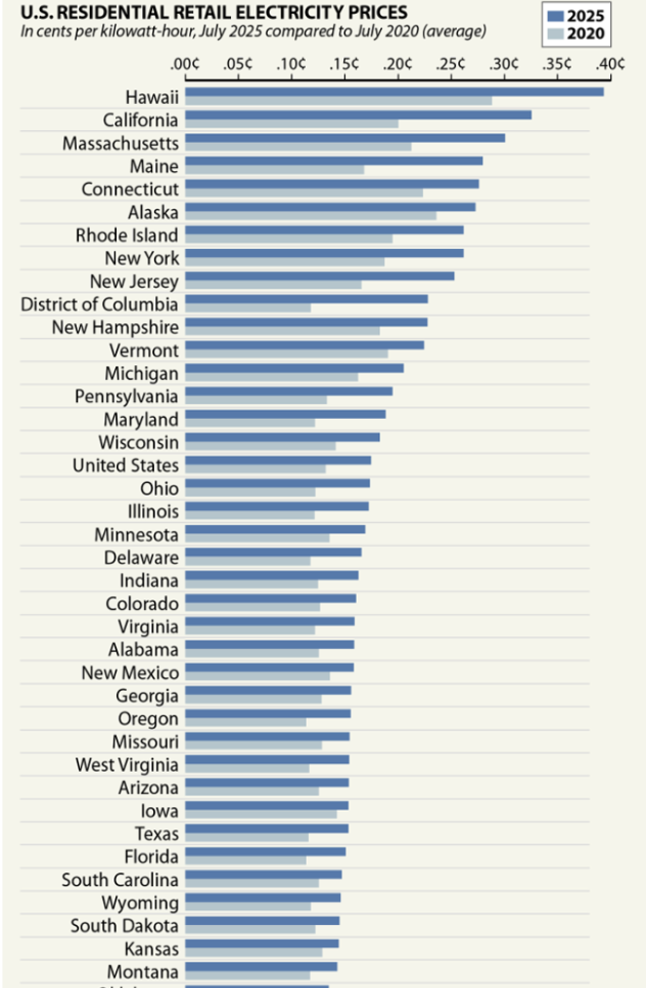
The chart of electricity cost trend in the U.S. by states below is from 1978-2025 by the St. Louis Federal Reserve.
Compare the electricity costs from when nuclear and coal provided over 70% of America’s electricity to after 2020 when the “Green New Deal” also known as the Inflation Reduction Act” was passed into law. After spending billions on wind and solar, the electricity costs have steadily risen and the future electricity supply reliability is compromised. Here is a trend of electricity prices across the U.S. since the huge investment in wind and solar and the destruction of reliable coal plants without replacing with in-kind, Dispatchable power generation capacity.
St. Louis Federal Reserve Graph of U.S. Electricity Rates 1980-2025

The map of the U.S.A. below with electricity costs by state is from 2010 data. As shown by the St. Louis Fed. graph above, since 2010 electricity rates have grown about 75%.

Conclusions
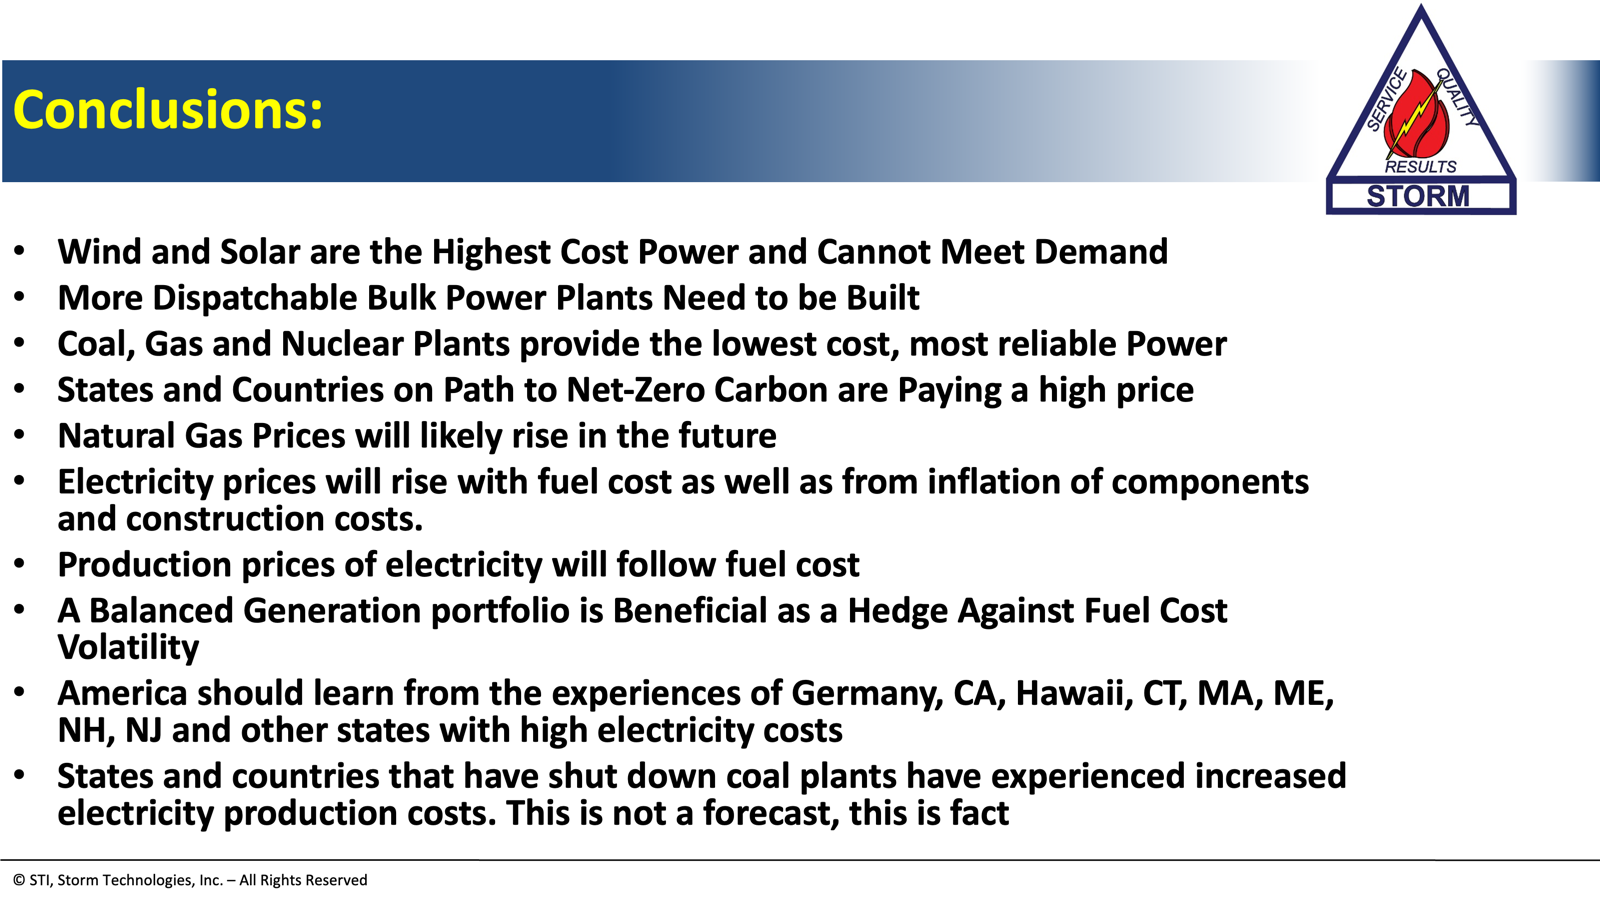
- Since about 2012 American energy policy has been created by academics, politicians, NGOs, green energy advocates, educational institutions, the UN, the WEF, the MSM and others, none of which have any practical experience in electric power generation such as the authors of this article. The energy policy was driven by ideology and politics, not science, engineering or sound economics
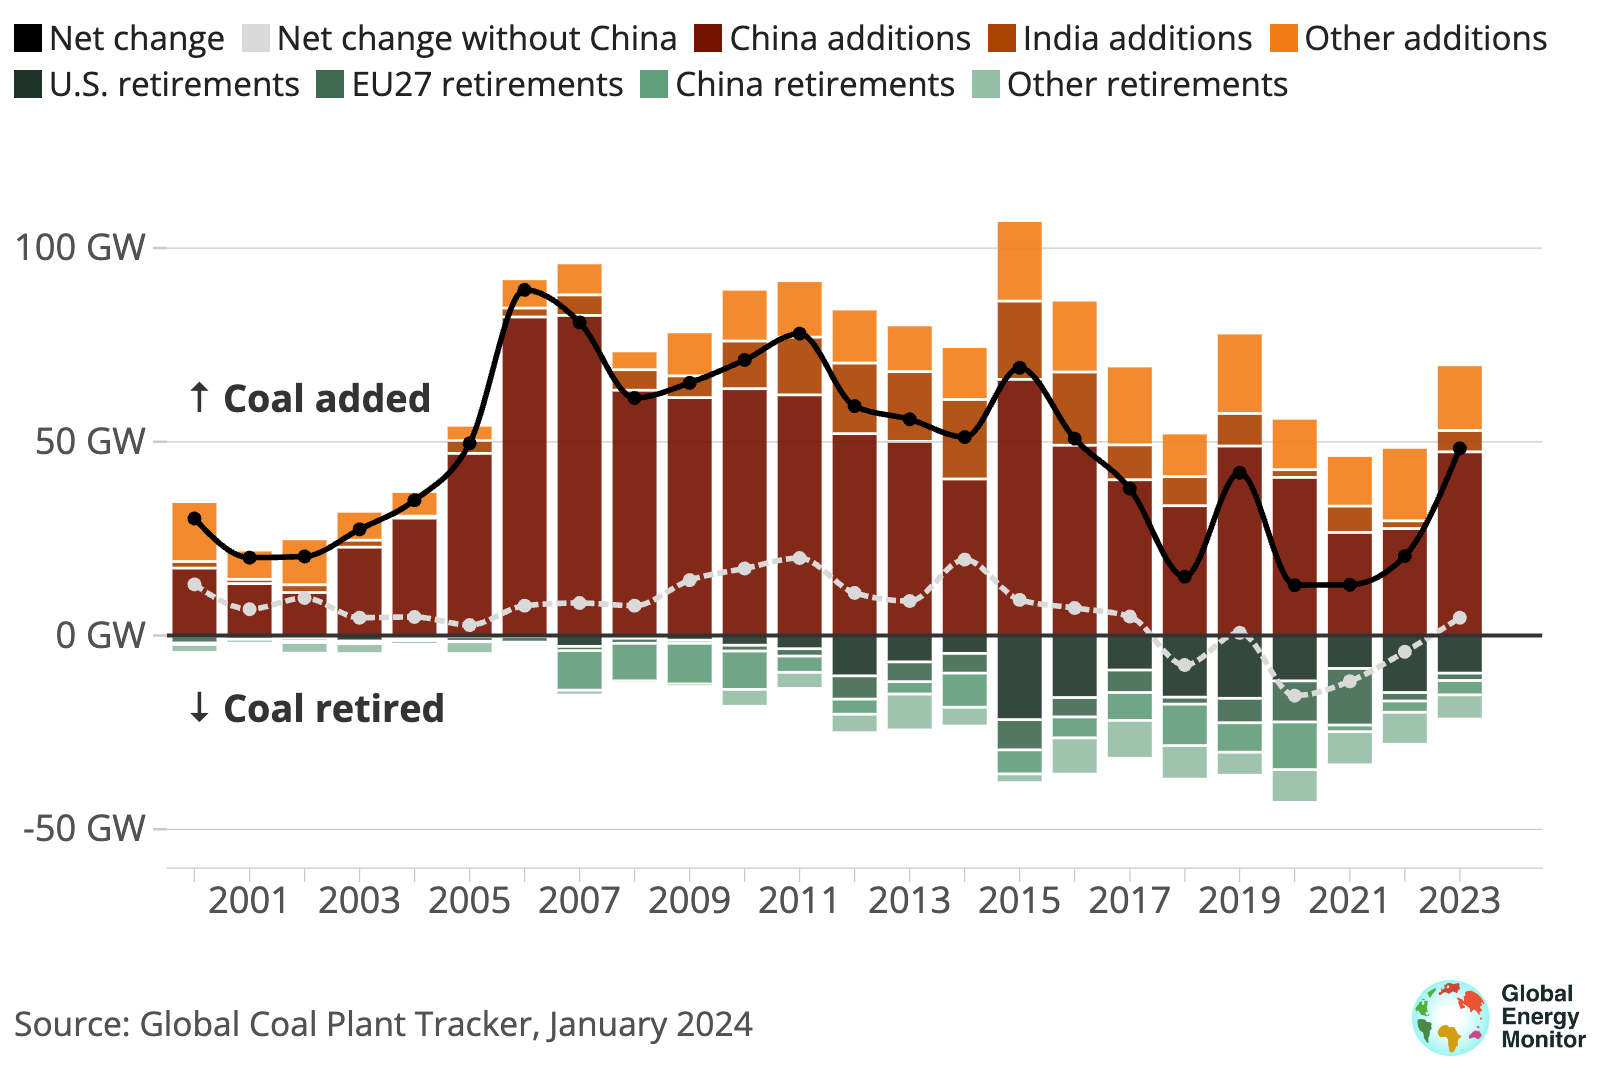
- America’s misguided energy policies have Self-Sabotaged the U.S. Bulk Power Supply by shutting down reliable coal and nuclear plants Since 2010, over 150 GW of Dispatchable or Base-Load capable nuclear generation has been shut down.

- The destructive Net-Zero Carbon path set by Congress and most states, is still in place. This inspiration of President Trump’s energy policies to apply common-sense and science based solutions is helpful. However, President Trump’s Executive Order Declaring and Energy Emergency has NOT yet moved the private sector to begin the process of building the number of new coal plants needed to meet the anticipated electricity generation increases of the future
- The authors of this article are not the sole experts that understand the shortage of future Bulk Power Supply. There are also well respected organizations that have been publishing reports as outlined by us. Examples: FERC and NERC
- A true electricity shortage and severely escalated electricity production costs are predicted beginning December 2016 due to the dereliction of duty of energy policy makers at both the Federal and state levels.
- Building the needed nuclear and coal power generation over the next decade will be difficult for many reasons. Amongst them: Rebuilding the U.S. Domestic Supply-Chain will take time, including both talent in the workforce as well as manufacturing capacity, Regulations must be abolished, including the EPA Endangerment Finding, New Source Review and other Rules, State Regulations, Utility management strategy to use the lowest cost fuels and reversing the public indoctrination which demonized coal and nuclear, by educating the public on the true facts of electric power generation
Respectfully submitted,
Richard F. (Dick) Storm
Donald Spellman
Dick Storm and Don Spellman Bio’s

Dick Storm is a registered Professional Engineer with over 50 years experience in electric power generation with coal power after graduating from Williamson in 1962. Began work with B&W in Nuclear and Special Products but transferred to the B&W Power Generation Division, due to being a young person that hated the paperwork of nuclear regulations and red tape. He then began working in acceptance and special performance testing of coal plants and fuel burning equipment as a B&W Results Engineer. In 1969 joined Riley Stoker as a Senior Service engineer to lead new plant startups. Served as a senior or lead startup engineer at numerous major coal plants over 300 MW size, including; Tampa Electric, City of Lakeland, Jacksonville Electric Authority, SCE&G, and CP&L Sutton #3.
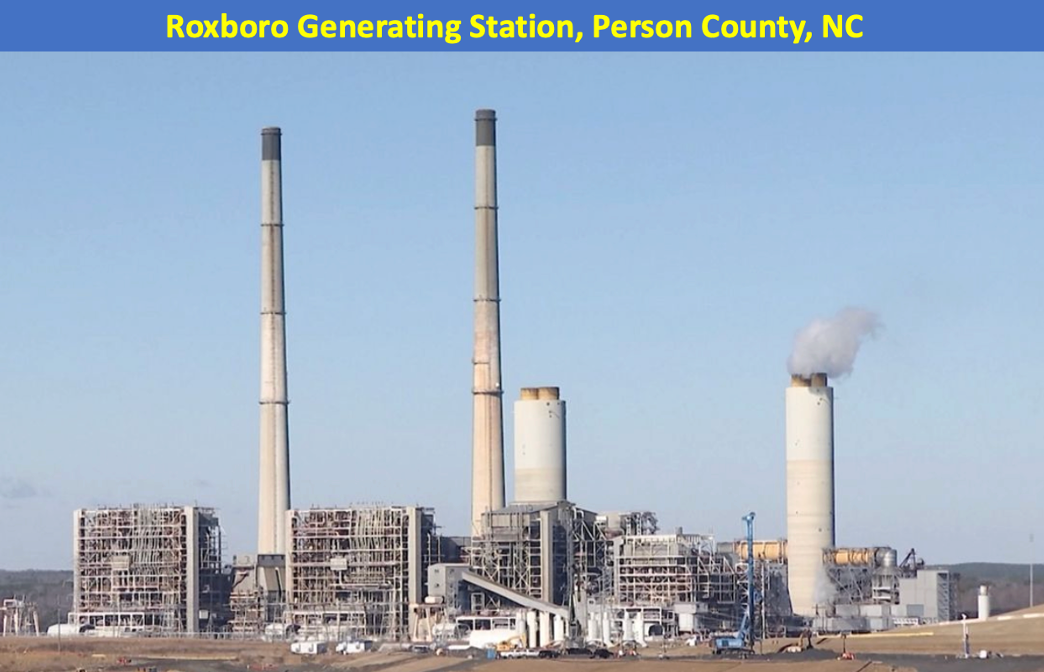
In 1972, joined Carolina Power and Light Company and progressed from lead startup engineer on the 720 MW Roxboro #3. After startup, he was promoted to Operations Superintendent at Roxboro Generating Station, 1973-1977.
Began the Technical Services Group at Flame Refractories, Inc. 1977 -1992. This engineering services group specialized in applied solutions to improve large high pressure boiler performance, reliability, project management of plant upgrades and pressure part renewal and modifications for reduced emissions and improved Heat-Rate
Then, in 1992, Founded Storm Engineering, later, Storm Technologies and Fabricated Solutions.
Storm Technologies, Inc. and the Fabrication Facilities have grown since Dick’s retirement in 2012 to present under the direction of Danny Storm.
Storm now serves as a consultant and part-time instructor of short courses in continuing education programs at USCB-OLLI courses and with Storm Technologies, Inc. Seminars. Has volunteered to present energy and electricity generation courses in Schools and Colleges.
Over the years have authored numerous articles for POWER Magazine, published technical papers and presentations.
Donald J. Spellman
In 1980, Mr. Spellman completed a successful 20-year military career in Navy nuclear submarines reaching rank of Lieutenant Commander and qualification as Nuclear Submarine Chief Engineer Officer. During his Navy career, Mr. Spellman received a Bachelor of Science degree in Electrical Engineering from Purdue University supported by the U.S. Navy and completed Master of Science studies in Ocean Engineering (nuclear programs) at the University of Rhode Island. in 1976. In 1976 He received a Commendation from the Commander U.S. Pacific Fleet for service as Navigator USS Snook during a Western Pacific deployment.
After Navy retirement, Mr. Spellman served as a project manager for Gas-Cooled Reactor Associates (GCRA) from 1980 to 1982, he provided supervision and technical direction for research and development of the modular high-temperature gas-cooled reactor.
After 1982 he was employed for 10 years in various roles as an engineering and management consultant for Management Analysis Company to the commercial nuclear power industry. He was responsible for directing utility assumption of design responsibilities after construction completion as a principal reviewer on the reactor plant Change Control Boards and conducted design change reviews at three different reactor plants.
In 1991, Mr. Spellman joined Oak Ridge National Laboratory as a member of the DOE Technical Standards Program and later as the Program Manager for ORNL support for the Fissile Materials Disposition Program Domestic Reactors Project in support of the Department of Energy (DOE) Office of Materials Disposition (NA-23). He had responsibility for technical support, research and development, and programmatic tasking associated with the U.S. reactor option for disposition of weapons-grade plutonium as mixed-oxide nuclear fuel. Mr. Spellman was a member of the DOE Source Evaluation Board for the selection of a prime contractor to provide design, construction, and operation of the Mixed Oxide Fuel Fabrication Facility at the Savannah River National Laboratory. Additionally, at ORNL he guided laboratory nuclear fuel development activities primarily related to nuclear fuel post irradiation hot cell examinations. He was a member of the ORNL High Flux Isotope Reactor (HFIR) independent safety oversight committee (Reactor Operations Review Committee). Primary responsibility for this committee was to periodically review operations and maintenance activities at HFIR and review periodic updates to the HFIR Safety Evaluation Report to the Department of Energy.
In 2017, Mr. Spellman retired from Oak Ridge National Laboratory after 26 years of service. Since retirement from ORNL, he served as a Subject Matter Expert on retainer back to the laboratory and for various other tasking for Xcel Engineering, Inc., Oak Ridge, TN.
References and factual based technical information for further reading and reference
- Drivers of Electricity Growth: https://gridstrategiesllc.com/wp-content/uploads/FINAL-2025-LTRA-Review.pdf
- NERC December 2025 Report on resource Inadequacy: https://www.nerc.com/newsroom/resource-adequacy-risks-intensify-across-north-america-as-demand-growth-surges
- POWER Magazine on Load Growth and Inadequate Bulk Power Supply: https://www.powermag.com/nerc-warns-long-term-grid-reliability-risks-mounting-from-surging-demand-lagging-resources/
- NERC Long Term Electricity Demand: https://www.nerc.com/globalassets/our-work/assessments/nerc_ltra_2025.pdf
- Cross Generating Station: https://grokipedia.com/page/cross_generating_station
- Roxboro Generating Station: https://grokipedia.com/page/roxboro_power_station
- EIA on Coal Plant Shut Downs since 2010: https://www.eia.gov/todayinenergy/detail.php?id=67427
- Dick Storm presentation to the ASME Plenary Meeting in Dallas, TX, summer 2011 on the importance of coal power
- NERC Long Term Assessment: https://www.nerc.com/globalassets/our-work/assessments/nerc_ltra_2025.pdf
- EIA on Fuels for electricity generation 1950-2025: https://www.eia.gov/energyexplained/electricity/electricity-in-the-us.php
- Grid Strategies on Load Growth: https://gridstrategiesllc.com/wp-content/uploads/2023/12/National-Load-Growth-Report-2023.pdf
- https://www.ferc.gov/news-events/news/fact-sheet-ferc-takes-action-supercharge-americas-grid-efficiency-reliability-and
- https://www.ferc.gov/news-events/news/presentation-report-2026-summer-energy-market-and-electric-reliability-assessment
- Over half of coal plant capacity will be shut down by 2026 by IEEFA (Institute for Energy Economics and Financial Analysis: https://ieefa.org/resources/us-track-close-half-coal-capacity-2026
- NEMA Electricity Growth Forecast to 2050 to be about 50%: https://www.makeitelectric.org/wp-content/uploads/Documents/News_Blogs/grid-reliability-study-nema-deck.pdf
- NEMA now predicts 55% capacity increase by 2050: https://www.publicnow.com/view/A42C2BC3294ACB64F9720CBD22AEC44186D3DE72
- Utility Dive on Load Growth in next five years: https://www.utilitydive.com/news/electricity-load-growing-twice-as-fast-as-expected-Grid-Strategies-report/702366/
- EIA on Coal Plant Shut Downs since 2010: https://www.eia.gov/todayinenergy/detail.php?id=67427


