America’s Treasure of Fossil Fuels

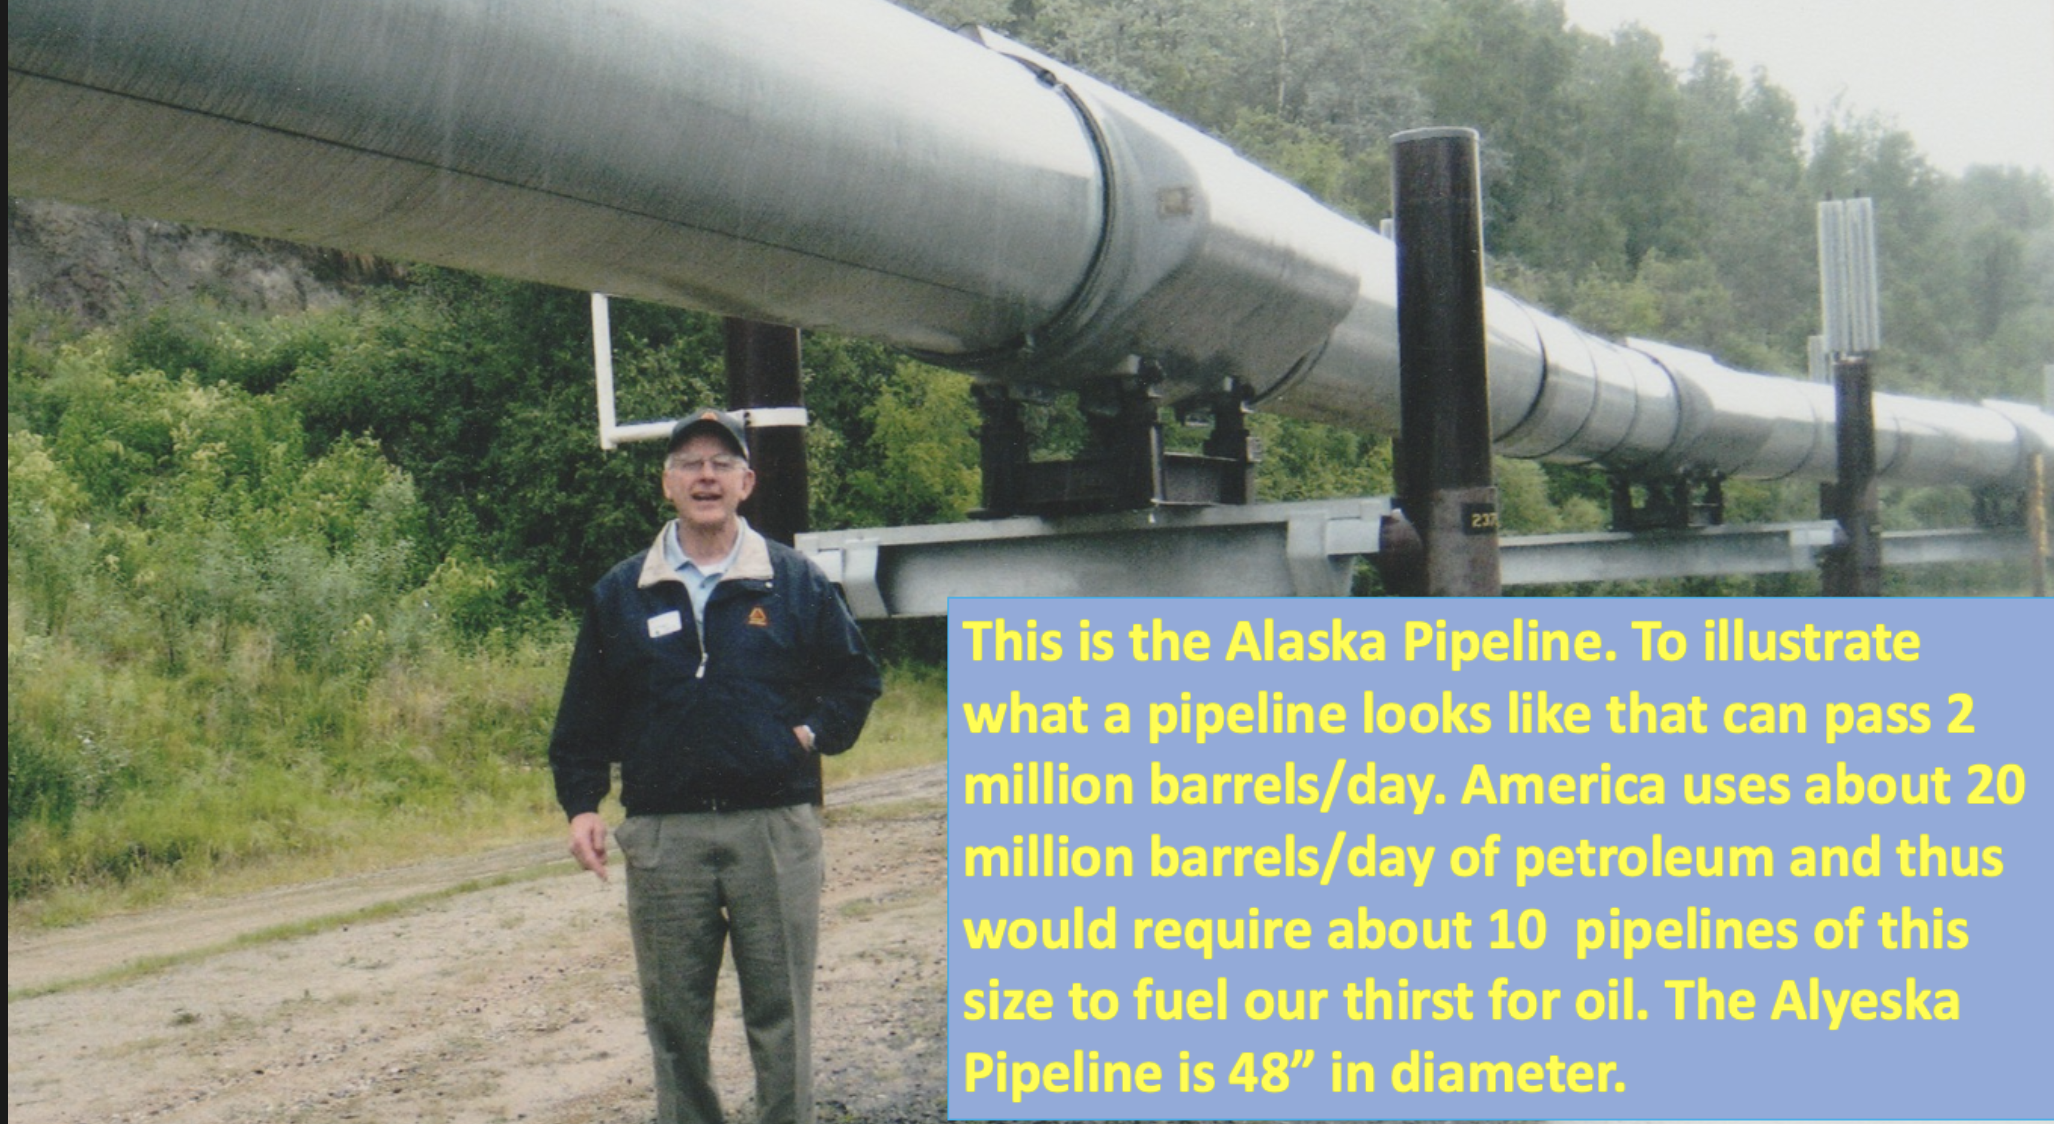
I presented my views on the importance of coal to the ASME Annual Meeting in Dallas at the Plenary Session in the summer of 2011. Back then, over 50% of America’s electricity was generated by coal power and hundreds of new coal plants were in the planning stages to modernize the coal fleet. Electricity costs in the U.S. were amongst the lowest in the world. The map with electricity costs is from 2010 data and from Dick Storm presentation to the ASME Annual Meeting.

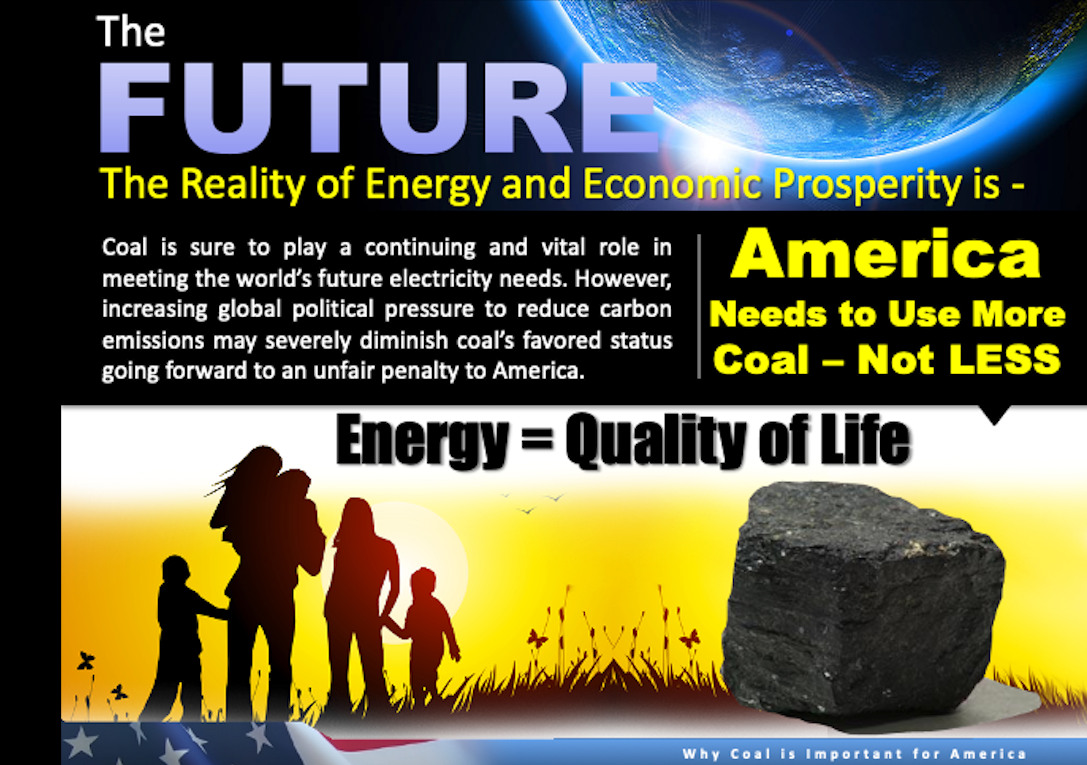
During last Thanksgiving week I was thinking of the many Blessings I have had over my life-time and it occurred to me that not only me but all other Americans are Blessed with an enormous treasure of energy (and many minerals we need too) right within our borders. It has been said before, “America is the Saudi Arabia of Coal”. What follows are some slide excerpts from my 2011 talk to the American Society of Mechanical Engineers (ASME) where my main point was, “Coal is Important”. It was then and remains important in 2022.

Back in 2008-2011 there were hundreds of new coal plants in the planning or construction stages. Many of these were cancelled. At the end of this post, in the Conclusions, I have added a dozen or so references of some of the organizations and individuals that contributed to the stopping new construction or the shutting down of over 200 coal plants. Because the ASME meeting in 2011 was at the beginning of “Wokeness” by the ASME, not all organizers were pleased with what I had to say. However, thanks to a friend who was an ASME official at the time, I was given my full allotted time in the Plenary Session for my presentation. My compliments and appreciation to my career-long friend Sam Korellis, now retired from EPRI. Time flies, that was 11 years ago and since then over 102,000 MW’s of coal generation capacity has been shut down without being replaced in kind. This is a mistake that much of America will realize in a couple months when the 2023 winter begins. Here are my views, as presented 11 years ago on the importance of coal and I believe, still are applicable today.

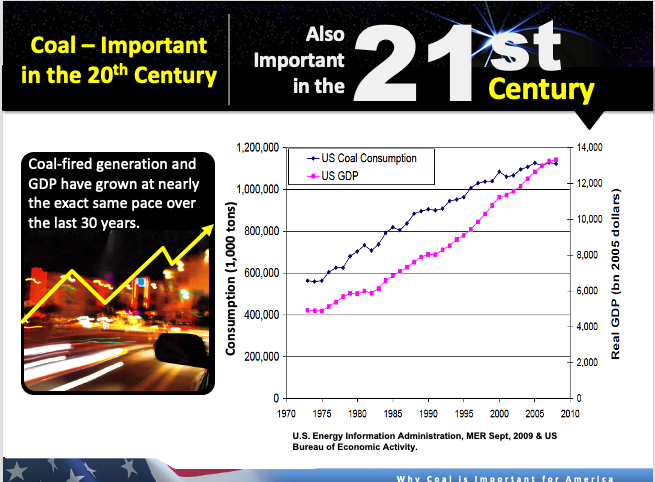
Economic prosperity and coal consumption grew as America prospered 1970-2010. This in spite of the 1973-74 Arab Oil Embargo.

I have used the U.S. Department of Energy Sankey Diagram of “Total Primary Energy” for many years and have discussed the fact that America typically requires 100 Quadrillion Btus of energy each year to power our high quality of life. Here below is the Sankey Diagram showing the Total Primary Energy used in 2008. Note it is 102.75 Quadrillion Btus. What has changed as the years (and War on Coal) have gone by, is the source of the fuels. In 2008 coal was 19.76 Quadrillion Btus. In 2021 coal was about half that at 10.5 Quadrillion Btus as natural gas fuel was more widely used for power generation 2008 to 2021. However, the total primary energy for normal economic activity remains right at 100 Quadrillion Btus. In 2019 before Covid, it was 101 Quads.

Four Facts that I opened my talk with: In 2011 about 82% of the world’s energy was fossil fuels. Today, fossil fuels continue to provide about the same percentage but actually, a greater quantity than in 2011 because more energy is used today than in 2011. My last of the four points is the most important. That is, Much damage to the American people and all of the people of the world has been inflicted by Green policies that are based on political wealth distribution purposes plus the myth that solar and wind can replace fossil fuels.

Summary of Where the U.S. Has Progressed in Energy Policy Since 2011

The presentation to the ASME was in the summer of 2011, 11 years ago. Since then over 102,000 MW of reliable, Dispatchable Coal plants have been shut down and only three new coal plants that I know of were started up in the U.S. (AEP-John Turk Station in Arkansas, Duke-Cliffside #6 and Longview in WVA). For a reliable grid there should be a Rational Energy Policy that would have provided incentives for continuing a Balanced electric generation portfolio. Including All Fuels and All Forms of Clean Energy, including Clean Coal, Nuclear, Gas Turbine Combined Cycle, wind and solar.

As if to highlight the irrational Energy Policy today, my friend Thomas sent me a news clip on the Pirky Plant in Texas being forced to shut down(1) just this week. His appropriate description of the news item is: “Losing the War against Stupidity”. So it seems.

There has been no planning of a so called “Energy Transition to wind and solar, only shut downs of reliable, Dispatchable coal and nuclear plants.

These coal and nuclear plant shut downs have been driven by environmental zealots funded by non energy savvy Billionaires. To be fair, they may have good intentions on contributing to a cleaner and better world. However, Net-Zero Carbon by 2035 or even 2050 will not be possible without sacrificing our quality of life. The folks that contribute to the environmental extremists and the organizations have indoctrinated many of the people of the world by demonizing the very fuels that have lifted billions from poverty. Amongst them are the Sierra Club, National Resources Defense Council, Environmental Defense Council and many more. Many of the executives from the environmental extremist groups have served both the EPA and government agencies. This is well documented by a 2015 report by Congress . Numerous references below document the revolving door of extremists being placed in high government positions. Background and expertise in electric power production or any proficiency in energy production or engineering is not a requiremment for these individuals that are now in powerful government positions. The lack of an energy policy is partially explained by the lack of proficiency or understanding by people in high office. The organizations that set U.S. Energy (Non) Policy are depicted in the illustration below which I have used in recent presentations.

So, What Went Wrong?

The root cause of our foolish and anti-American energy policy in my opinion, is due to many years of mis-education and indoctrination of the public on the Myth that Solar and Wind can replace coal, natural gas and nuclear generation. Also, replace Fossil Fuels for transportation, plastics, Fertilizer, concrete and steel production. The indoctrination of the public on the myth that wind and solar can provide all of America’s energy has been well orchestrated, but it is wrong for America and wrong for the Free World.

The organizations shown in the above illustration have done much to misguide the public. In addition to the organizations above, there are many “Woke” corporations and organizations that may have “good intentions” to promote “Electrifying Everything” but…. it is simply not possible to do so. So here we are at the end of a Decade of misinformation and Indoctrination and the result is a worldwide Energy Crisis. According to the head of the IEA, Dr. Faith Birol, yes it is a world energy crisis, worse than the 1973 Arab Oil Embargo. Similar dire warnings from energy experts, such as Daniel Yergin of Cambridge Energy Experts.

Conclusions

  1. I still believe the 2011 ASME presentation on the Importance of Coal, to be valid and a valid component of a Rational Energy Policy. America should use our enormous treasure of nuclear, coal, oil and gas minerals that lie within our borders.
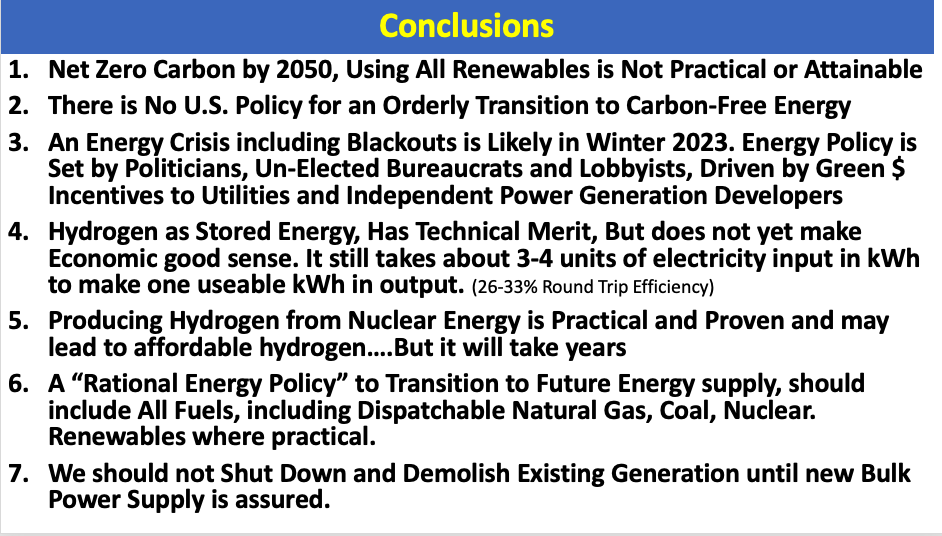
  2. Net Zero Carbon by 2050, Using All Renewables is Not Practical or Attainable
  3. Energy Policy in the U.S. is determined by Environmental Extremists and Politicians that do not have training or proficiency in engineering and energy production.
  4. There is No U.S. Policy for an Orderly Transition to Carbon-Free Energy
  5. Energy Independence should be a central component of any U.S. Energy Policy.
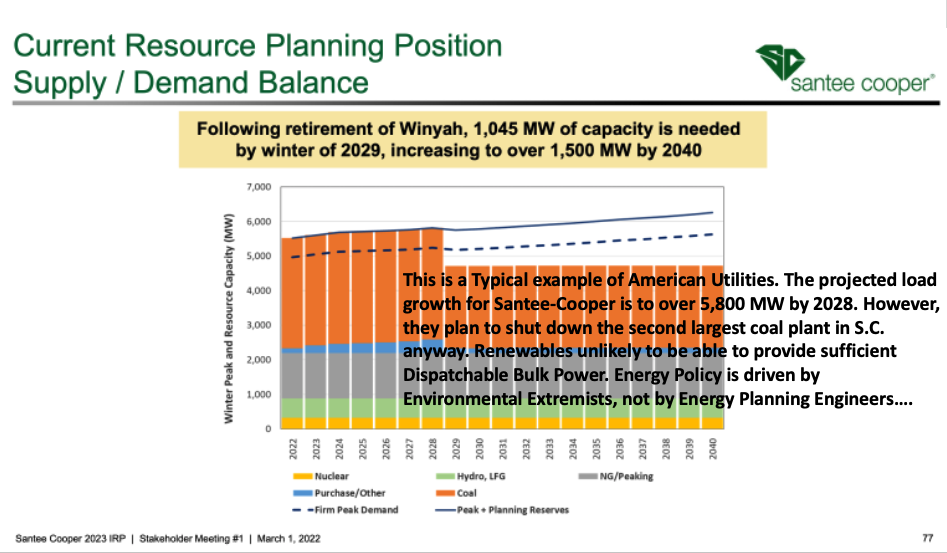
  6. .An Energy Crisis including Blackouts is Likely in Winter 2023. Energy Policy is Set by Politicians, Un-Elected Bureaucrats and Lobbyists, Driven by Green $ Incentives to Utilities and Independent Power Generation Developers
  7. Hydrogen as Stored Energy, Has Technical Merit, But does not yet make Economic good sense. It still takes about 3-4 units of electricity kWh to make one useable kWh
  8. .Producing Hydrogen from Nuclear Energy is Practical and Proven and may lead to affordable hydrogen….But it will take years
  9. A “Rational Energy Policy” to Transition to Future Energy supply, should include All Fuels, including Dispatchable Natural Gas, Coal, Nuclear.  Renewables where practical. 
  10. We should not Shut Down and Demolish Existing Generation until new HELE Coal Plants for Bulk Power Generation is assured in order to maintain a Balanced Generation Portfolio.
  11. A partial list of key players that are setting U.S. Energy Policy. (Hint, These are not people trained in engineering & planning Electricity Generation Capacity):
  12. The preceding list of organizations and individuals are some of the anti conventional fuels Zealots that have molded the United States Energy Policies, which are in fact, Not Energy Policies at all, just a continuing “War on Coal and Conventional Fuels” This my friends is how America the greatest country in the world, is self inflicting harm on our economy, national security and against the best interests of the American people. One would think that the Bureaucrats in Washington do not read the news of the energy problems and causes in Europe? We should know by now, the importance of true Energy Independence.

Respectfully and yours truly,

Dick Storm, November 25, 2022

References and for further reading:

  1. Eco regulations force massive coal plant to shut down, sparking community uproar | Fox Business. Typical news of the harm done to citizens by out of control Bureaucrats: https://www.foxbusiness.com/politics/eco-regulations-force-massive-coal-plant-shut-down-sparking-community-uproar
  2. Gina McCarthy, Climate Czar, IRS 990 form when she worked at NRDC between Obama and Biden Administrations: Click to access nrdc-actionfund-990-2020.pdf
  3. Big Green Radicals, 2014  : https://freebeacon.com/wp-content/uploads/2015/01/epa-report.pdf
  4. Business Insider, Links of Russian Funds to NRDC Funding to fight Fracking: https://www.businessinsider.com/a-russian-linked-company-in-bermuda-is-funneling-millions-to-us-anti-fracking-groups-2015-1
  5. 2011 American Society of Mechanical Engineers, Plenary Meeting presentation, Why Coal is Important: https://www.stormeng.com/wp-content/uploads/2020/08/2011-Why-Coal-is-Important-for-America-ASME-Annual-Meeting-2011.pdf
  6. Joe Gothman Atty in EPA Revolving Door of well funded non-Profits and EPA: http://www.scientificintegrityinstitute.org/USSEWP080415.pdf
  7. Donn Dears article on U.S. Energy Resources, July 2022https://bit.ly/3J5OnTc
  8. What is Endangered, Freedom or Climate: https://dickstormprobizblog.org/2022/02/27/what-is-endangered-climate-or-freedom-this-is-the-sub-title-of-the-book-blue-planet-in-green-shackles/
  9. Is Manmade Global Warming causing more hurricanes? https://wattsupwiththat.com/2022/10/16/is-global-warming-responsible-for-hurricane-ian-the-evidence-says-no/
  10. On Arctic Ice: :  https://www.heartland.org/news-opinion/news/no-melting-greenland-ice-is-not-about-to-swamp-coastal-areas
  11. On Tidal Rise: https://www.heartland.org/news-opinion/news/no-melting-greenland-ice-is-not-about-to-swamp-coastal-areas
  12. Benefits of CO2 to the planet:  http://sepp.org/twtwfiles/2022/TWTW%2011-05-22.pdf
  13. Urban Heat Island science: http://sepp.org/twtwfiles/2022/TWTW%2011-05-22.pdf
  14. On Scientific Consensus of Anthropogenic Global Warminghttps://www.heartland.org/news-opinion/news/97-consensus-on-climate-change-survey-shows-only-59-of-scientists-expect-significant-harm
  15. Monuments to Poor Planning, What Do you Think they will be in 2024:  https://dickstormprobizblog.org/
  16. Donn Dears, Blackouts Threaten New England Again?:  https://ddears.com/2022/10/25/blackouts-threaten-new-england-again/
  17. If the Climate Zealots Really Cared about CO2 Then, they would embrace Nuclear Power: WSJ, Opinion, May 27, 2022, Jason Hayes, “Why Blackouts are Coming to Michigan” Regarding shutdown of Palisades Nuclear Generating Plant: https://www.wsj.com/articles/why-electricity-blackouts-are-coming-to-michigan-nuclear-power-plant-green-energy-renewable-climate-11653685521?cx_testId=3&cx_testVariant=cx_2&cx_artPos=5&mod=WTRN#cxrecs_s
  18. World Nuclear Organizationhttps://world-nuclear.org/information-library/current-and-future-generation/nuclear-power-in-the-world-today.aspx
  19. U.S. Grid Monitor, Real Time Bulk Power across U.S. https://www.eia.gov/electricity/gridmonitor/dashboard/electric_overview/US48/US48
  20. Liberty Energy, “Bettering Human Lives Report”: https://www.libertyenergy.com/betteringhumanlivesv2/
  21. Capital Research Center, Nov. Dec. 2021 Issue: https://capitalresearch.org/app/uploads/Capital-Research-2021-8.pdf
  22. WUWT Blog on Global Fuels Use, July 11, 2021: https://wattsupwiththat.com/2021/07/11/2020-global-energy-data-shows-fossil-fuels-completely-dominate-world-energy-use/
  23. IEA Energy and Food Production: https://www.iea.org/commentaries/how-the-energy-crisis-is-exacerbating-the-food-crisis
  24. Activist Facts,  Environmental Report (Follow the Money): https://www.activistfacts.com/organizations/19-natural-resources-defense-council/
  25. China and World Carbon Dioxide emitters Columbia Univ.: https://www.energypolicy.columbia.edu/research/report/getting-30-60-how-china-s-biggest-coal-power-cement-and-steel-corporations-are-responding-national
  26. Capital Research Center, The Left’s War on Coal: https://capitalresearch.org/article/the-lefts-war-on-coal-part-3/
  27. There is No Climate Emergency, Dr. Judith Curry: https://m.youtube.com/watch?v=YBdmppcfixM&feature=emb_logo
  28. Dr. Steve Koonin, Is There Really a Climate Emergency?: https://www.prageru.com/video/is-there-really-a-climate-emergency?utm_source=Iterable&utm_medium=email&utm_campaign=campaign_5331670

ENERGY AND ECONOMIC PROSPERITY

A few weeks ago, I commented on a post on LinkedIn by Donna Castro. My question was, “I wonder what the correlation is between Economic Prosperity and Energy Use”. So, to answer my own question I did a little research and here is the result of that search.

The “Visual Capitalist”(1) published the graphic above Dec. 21, 2021. I have been interested in the relationship of energy use to fuel Economic Prosperity for many years and liked this graphic.

The total world GDP is projected to be 94 Trillion Dollars. Only 18 countries have greater than a 1% share of the total world economy. The U.S.A. and China comprise about 42%. The ten largest economies are:

So, back to my curiosity of relating energy use to economic output, I thought it would be useful to show the top ten countries ranked by total energy use. Statista and other organizations list these. I used the chart from Statista. Not surprisingly, the data from all sources show the largest economies use the greatest quantity of primary energy. China is the world’s largest manufacturer and they produce over 50% of the world’s steel and aluminum. Primary metals production is very energy intensive, thus, it is expected that China will use the greatest amount of primary energy and they do.

Chart by Statista.com

The Net-Zero Carbon Emissions Policies of America brings to mind the threat to our economic prosperity and our comfortable life styles. I have written my thoughts on Net-Zero Carbon, the War on Coal, War on Carbon and my opinion of Net-Zero Carbon, in other posts on my Blog.

A new book by Donn Dears is available which has lots of background and details with fresh information of why the Net-Zero Carbon policies of the Biden Administration are harmful to the U.S.A. I recommend his book for anyone who is interested in the relationship of Economic Prosperity and Reasonable and well thought out Energy Policy. Net-Zero Carbon and the current “Green” initiatives in Congress are not reasonable and not well thought out by people who understand energy and electricity generation.

The Net-Zero Carbon Emissions Policies of America brings to mind the threat to our economic prosperity and our comfortable life styles. How can we reshore more manufacturing and become energy independent again by following anti-American energy policies as laid out in the path to Net-Zero Carbon? I have written my thoughts on Net-Zero Carbon, the War on Carbon and my opinion of this policy on this Blog and other publications. However, Mr. Dears has done a very nice job of condensing many issues of Net-Zero Carbon into about 100 pages.

Donn Dears.org

Note the Sub-Title: Which correctly states, “The Climate Policy Destroying America”

The theme and title of this post is “Energy and Economic Prosperity” the current U.S. Climate Policy is weakening America and Mr. Dears is correct with his choice of sub-title.

I recommend his book and the information available on his web page for reference on Energy Policies that affect our Economy and our life styles:  https://ddears.com

I have been concerned about the war on coal and now the war on carbon for many years. Not only is Net-Zero carbon harmful to the U.S.A. but it is also slowing down Human Development of countries in the Developing World. Going back to the first illustration above, note that the U.S.A. and China comprise 42% of the World’s GDP and that only 18 countries exceed 1% of the total 94 Trillion Dollars of World GDP. 

Energy and Human Development Index

The Illustration below is available on the ExxonMobil(3) website and is based on U.N. data.  Note that 50% of the world’s countries and 20% of the world population do not have fuel for cooking. I personally have experienced walking down the streets of cities in numerous Developing countries. I have witnessed heavy pollution which stings the eyes. Such pollution is not found in the U.S. Many Asian countries still use cow dung for indoor cooking.

My point: The Net-Zero Carbon Path that the U.N. has adopted does not serve the Developing countries very well either.

Let me show another of my favorite illustrations of Energy Poverty in the world. This is the NASA Composite Photo, “The Earth at Night”. These night time photos show the differences of energy and electricity abundance or shortages by the illumination that is visible from space. First let’s look at Africa and Europe: 

NASA, Earth at Night Composite Photo

NASA, Satellight Photo at night showing Europe and the continent of Africa. Also apparent in the Human Development Chart above showing Yemen and Nigeria as two Developing countries that have a low HMI (Human Development Index) with a corresponding low energy consumption.

Compare this to the United States at night below:

Conclusions:

  1. The U.S. President & Congress’ quest to enact Net-Zero Carbon into law will weaken America’s capability to sustain our economy and our life styles.
  2. Energy and Economic Prosperity are inextricably linked and restricting energy production and development weakens our country. Don’t forget the Fossil fuels needed for our Nations Defense. F-22’s and F-35’s require high quality Jet fuel.
  3. The United Nations Framework Convention on Climate Change (UNFCCC) and the Intergovernmental Panel on Climate Change (IPCC) both of which are worldwide, are harmful to Developing Countries as well as OECD countries.
  4. The only winners in the UNFCC and IPCC agreements (if they are fully implemented) is China and Russia.

For more details, I suggest reading Mr. Dears books on the subject. He has written several excellent texts.

Dick Storm, January 3, 2022

References:

  1. Visual Capitalist:  https://www.visualcapitalist.com/visualizing-the-94-trillion-world-economy-in-one-chart/
  2. Statista.com for ranking of energy use by country: https://www.statista.com/statistics/263455/primary-energy-consumption-of-selected-countries/
  3. ExxonMobil Outlook for Energy 2021: https://corporate.exxonmobil.com/-/media/Global/Files/outlook-for-energy/2021/2021-Outlook-for-Energy-fundamentals-infographic.pdf
  4. NASA, “The Earth at Night” composite photo: https://earthobservatory.nasa.gov/ContentFeature/NightLights/images/media/BlackMarble_2016_EuroAfrica_composite.png
  5. https://eoimages.gsfc.nasa.gov/images/imagerecords/79000/79800/dnb_united_states_lrg.jpg
  6. NASA Earth Explorer: https://earthobservatory.nasa.gov/map#6/40.000/-100.000

Demystifying the Importance of Energy and Electric Power

Monday evening I was invited to the Sunset Rotary Club to provide a presentation on energy and electric power generation. I accepted the invitation because I believe it is important for the general public to understand the importance of affordable, reliable energy and electricity generation. Rotary Clubs are comprised of great civic minded people that are involved in the community. Thus, the title of the talk, “Demystifying the Importance of Energy and Electric Power” . My intention was to help the Rotarians understand the differences of Primary and Secondary Energy, Dispatchability of electricity generation and provide an overview of the sources of our energy. Here is the presentation with a short narrative of each of the slides I used to compress a two hour topic into 30 minutes:

The object of the short talk was to cover the importance of energy and to attempt to bring the facts to community leaders that care, but are not experts in or involved in energy engineering or businesses.

Rotary members are very active in the community and the world in helping the less fortunate. The first part of the meeting was members discussing helping students and those people in the community that are living in poverty. (Yes, on Hilton Head Island we have a lot of poverty) In my attempt to pique the attention of members on the plight of people living in Developing countries and the relationship of energy and economic prosperity, I used the cover of the June 2021 Rotary Magazine. This showed an example of indoor cooking of a family in Mongolia. Another photo of a woman cooking over a wood fire in Africa. Lifting people such as these from poverty can be done with the wise and careful use of fossil fuels. Such as propane and natural gas for cooking and coal for electricity generation.

Most of America’s energy is provided by conventional forms of energy; petroleum, natural gas, coal, nuclear, biomass and hydroelectric. These six forms of primary energy provide over 90% of the energy we use, need and depend on to power our high quality of living. I used the John Deere tractor as an image to get attention to the energy component of food production. Rotary is involved in helping the less fortunate all around the world. The Energy cost component of food production is over 50% for most foods when “farm to table” is considered. Costs such as; fertilizer, tractor fuel, grain drying, food processing, refrigeration for dairy and meat products and distribution transportation power and supermarket refrigeration. As energy costs rise, they become one of the root causes of inflation.

The relationship of energy and economic growth is well known by those of us that have worked in the energy business but not so well known by the general public. To illustrate this relationship I used the data compiled by the U.S. Department of Energy back in 2010 to show the correlation of coal consumption and GDP growth from 1970-2010. This GDP growth was steady and in spite of the Arab Oil Embargo’s of 1973 and 1980. Back in the late 1970’s, when Jimmy Carter was President, his Administration promoted a National Energy policy that focused on Domestically produced energy. Because America is the “Saudi Arabia of Coal” over 50% of the U.S. ever growing electricity generation, continued to be from coal fuel.

Moving forward from 2010 to 2021, the Energy Flow Chart shows the sources and uses of each form of energy. Including renewables.

The LLNL Sankey Diagram of total primary energy flows is my favorite illustration. This shows on one diagram the total energy sources and consumption. I think it is an easy to understand graphic that any reasonable person can understand. Thus, it is my favorite energy chart.

Three points are to be made with this chart: 1. America uses about 100 Quadrillion Btus of energy each year and that this has been steady for the last 20+ years. The year 2021 energy use dipped to 97.3 Quads because of Covid and reduced travel and industrial output. 2. The LLNL chart shows PRIMARY Energy Flows. The distiction of Primary and Secondary Energy needs to be understood. For example, electricity and hydrogen are forms of Secondary Energy 3. The most important point emphasized by this chart is that wind and solar only provided 4.96% of the U.S. Primary Energy. This after decades of subsidies and taxpayer funded incentives for wind and solar.

Each South Carolina citizen uses an average of 866,000 Btus per day. Each of us in the room live a slightly above average life style. Thus, I submit that each one of us uses over a million Btus of conventional energy each day. The slide above shows the forms that energy is used by each of us, or on our behalf. I say on our behalf considering for example, the Diesel fuel used to power a truck delivering an Amazon shipment to our home, or Jet Fuel for a Fedex air freight shipment. Also, many of us will travel to see friends and family over the Thanksgiving Holiday and vacations. Travel such as that uses much more than a million Btus/day/person when gasoline and jet fuel are considered. The number is derived from dividing the total primary energy BTUs used in the state by the population then divide by 365 days, to come up with the energy/person/day consumption. The information on the illustration below is compiled by the U.S. Department of Energy for SC residents.

This reminds me of one of the excellent questions asked at the end of my presentation. The question was, “If we each use about a million Btus per day, how much do they cost in dollars?”. Great question and the answer reminds us of how fortunate we are to be Americans! A million Btu’s of natural gas costs about $7.00/million Btu and a million Btus of Diesel fuel costs about $46.00/million Btus. Depending on our personal use of energy it will be somewhere in between. Coal energy is the least costly and before Covid was less than $3.00/million Btus. But, lately due to so many factors resulting from the government’s “War on Carbon”, delivered coal costs are about the same as natural gas. This is what the proponents for renewables want, higher costs of fossil fuels which then makes renewables more competitive by increasing the costs of the once affordable fuels. In my opinion, this is not a good strategy to keep America strong.

The Alaska pipeline was approved by Congress and built after the 1973 Arab Oil Embargo. It presents a vivid image of the amount of oil America depends on each day. The Alaska pipeline is above ground because of the Permafrost Tundra in northern Alaska. The above ground image provides a graphic illustration of a pipeline capable of transporting about two million barrels of oil per day. America uses about twenty million barrels per day of oil, so to illustrate that, imagine ten pipeleines like the one shown above, side by side. Yes, that is a lot of oil to be refined into gasoline, jet fuel, kerosene, lubricating oil, grease and many other petroleum products. Not to mention the oil used in making plastics and other materials used for manufactured products of all types.

Total Primary energy production and use 1950-2020. I stated earlier that America has leveled off at about 100 Quadrillion Btus of energy each year. This chart by the EIA shows that from about the year 2000, the U.S. has used right at 100 Quadrillion Btus/year. Another point to make: Note that in 2019 it was the first year since about 1960 where America produced as much Domestic energy as we consumed. In other words, in 2019 America became energy Independent.

The total energy consumption since 1776 is shown on this chart. If you close your eyes and imagine the inventions from 1850 on such as the end of darkness with Edison’s development of the light bulb, the gasoline engine, the Diesel engine, steam turbines, airplanes, air conditioning, refrigeration, synthetic ammonia production from natural gas, plastics, steel, aluminum, airplanes and etc. All of these modern inventions, most developed during the 20th Century have provided a very high quality of life or as the United Nations quantifies it, “HDI” (Human Development Index”). The modern devices, including automobiles, airplanes and home appliances all depend on energy. Substituting muscle power for machines. As recent as 1900 farming was done with muscle power until tractors were invented and mass produced. Perhaps this is a good time to interject the fact that many of the eight billion people now living on this planet do not have the HDI that American’s enjoy.

The data above is a few years old as it shows the world population at 7.2 billion. Just this week the U.N. estimated that the world has now passed 8 billion in total population. It is my opinion that not much has changed in the percentages of people living below the energy and HDI levels of the Developed world. As shown on the chart, about half the world population lives well below our quality of life in energy poverty. The difference? Energy and Liberty. This is the season of Thanksgiving and all Americans have much to be thankful for. I know I am.

While Americans have much to be thankful for……There are some quirky and misguided organizations and people in government that do not understand the importance of conventional forms of energy. Some of these organizations and people are: the Sierra Club, Yale University, Stanford University, Princeton, many members of the Democrat Party, celebrities and the Entertainment Industry, the United Nations, the Main Stream Media, the World Economic Forum, Public Education the EPA and “Woke” corporations . They and others have waged a “War on Carbon” for decades and wealthy Billionaires such as Jeff Bezos and Michael Bloomberg have contributed hundreds of millions (together-Billions) of dollars to shut down coal plants and stop the use of fossil fuels. Their solution is to basically, “Electrify Everything”. The graphic above includes a couple screen prints from the Yale 360 and Sierra Club websites. They are not alone, many organizations and celebrities have taken up the “Green Energy” cause. What I am attempting to show in this presentation is, that everything cannot be electrified! How do you think the people living below the poverty line feel when diplomats and wealthy indivduals like John Kerry, Barack Obama, Gina McCarthy, Joe Biden, Michael Bloomberg, Jeff Bezos and others from the government and World Economic Forum, gather together after flying in their private jets half way around the world and then they lecture people living in Africa, Indonesia and India on how they should Decarbonize? One example is the importance of ammonia fertilizer production. This uses about 1.2% of the world’s energy and if ammonia fertilizer production was stopped, Vaclav Smil, an energy expert and author has estimated that half the people on the planet would perish from famine.

The 100 Quadrillion Btus of energy we Americans use each year cannot be replaced by wind and solar. It is impossible to do so and still continue our good quality of lives. Below is another couple figures from the U.S. Dept. of Energy which show where our electricity came from in 2021. Note that it is over 80% conventional. As far as carbon free electricity, the greatest source is nuclear power which provides almost 20% of America’s total electricity.

A reminder that Energy Independence is important not only to power our HDI but also for National Security. Both militarily and for economic security. If one does not believe energy is important for a sustainable and good life, then that person should read up on the current events in Europe and Ukraine with energy shortages. Read the news on BASF downsizing fertilizer production in Germany because of high energy costs and also other German industrial plants are being downsized or shut down. All older Americans should remember the Oil Embargo’s of 1973 and 1980. Taking the U.S. Oil Embargos and Russian war on Ukraine into consideration this should elevate the understanding of the importance of energy independence and affordable production of energy to sustain our lives. Also, those of us living on the coast remember how our lives changed when hurricanes like Mathew in 2016 knocked out electricity and stopped gasoline deliveries.

Electricity generation that is “Dispatchable” is important for reliable electric service. The 24 hour chart above shows typical electric Demand for a Utility. The red lines are summer with higher air conditioning load and the winter in blue. Whether summer or winter, electric load is greatest in the morning and late afternoon. The Demand at 5:00 PM will typically be about 150% to 200% of the Demand at 5:00 AM. This is because of increased commercial lighting, cooking for dinner, folks returning home from work and turning on TV, etc. As my first “Electricity 101” instructor put it in 1959, “Electricity Needs to be Generated the Instant it is Needed”.…This is called Dispatchable electricity generation.

The Current Grid example above shows electricity generation for the 48 states of the U.S.A. This example is from October 2021 but it was similar for 2022. The cycling lines representing natural gas power illustrate the electric load Demand swings from daytime to night-time. The variations are similar but less extreme for coal and hydro. These four sources of electric generation are Dispatchable. Over 80% of the generation for the 48 states up till now, is from Dispatchable generation. Solar and wind are Not Dispatchable. So, as in California a year or two ago, as people came home from work, started cooking dinner, charged their EV’s and turned on TV’s…..the Demand for electricity exceeded the available supply and rolling Blackouts occurred. Texas in the winter of February 2021 had a similar experience. Both Blackout events were the result of too much intermittent power generation from wind and solar with too many Dispatchable coal and nuclear plants having been shut down in the last few years.

The graphic above is from the Midcontinent Independent System Operator known as MISO. Actual data from July 2022. The point is to show the generation by fuels which includes 41.85% coal. Many of these coal plants are planned to be shut down in the coming years, without planning replacement generation fron Dispatchable sources. (This is an absence of a Rational Energy Policy)

The chart above is from the North American Electric Reliability Corporation known in the indstry as NERC. As is shown, about 102,600 MW of Dispatchable, afffordable coal and nuclear electric generating capacity has been shut down since 2011. More shut downs are planned for the next couple of years.

For people like myself that have been involved with energy and electricity generation for decades, it just seems foolish and ill planned. I started digging a year or two ago to attempt to determine why America has no energy policy to replace the coal and nuclear plants that have been shutdown with more to follow? The answer is that America’s energy policy is driven by environmental extremists that know little about energy and electricity generation and seem to not care about the consequences and weakening of America. Some of these organizations are shown below.

The public Indoctrination has been highly successful in indoctrinating the general public believe that green power can replace coal, gas, oil and nuclear energy. It cannot if we are to continue to enjoy our high HDI style of living.

Another RTO (Regional Transmission Operator) is the PJM Interconnection. This RTO serves as the electric power equivalent of an “Air Traffic Controller” to distribute the power genaration to the least cost electric generating plants between NJ and Illinois. A huge portion of the Northeastern states. Like MISO, much of the pwer generation this summer was from coal plants. Like MISO, many of the Dispatchable coal plants are planned for shut down in the near future. Until then neeeded preventive maintenance is not the same as if they were valued assets to be depended on for decades into the future. Also, there are no plans to replace the lost generation with new coal or nuclear units, at least, not yet.

As a side note, when RTO’s were formed, rather than having Regional Utilities plan for future Generation, it relieved the Regional Utilities of responsibility to plan future generation assets. Thus, when we get to Blackouts because of poor planning, no one will be held accountable. It is bizarre for our great country to come to this.

Let’s talk about South Carolina and where we get our electricity.

Over 56% of SC electric generation is from nuclear power generation. SC ranks #3 in the U.S.

Here on Hilton Head Island our electricity is distributed by Palmetto Electric Co-Op. Palmetto Electric receives most of their Bulk Power from Santee-Cooper. The generation assets of Santee-Cooper are shown on the chart above. In the lower right inset, is shown the Summer Nuclear Plant which is operated by Dominion Energy. Santee-Cooper owns 322 MW of the nuclear generation capacity of Summer Unit #1. Two additional nuclear units were planned when SCE&G was the owner but mismanagement resulted in quitting the construction process after spending about nine Billion dollars on the expansion. Had it been successful, it would have been a good plan for carbon free electric generation capacity. Currently, most of Santee-Cooper’s power generation is from the Cross and Winyah coal power plants. As can be seen from the Santee-Cooper table above of electricity generation assets, over 67% of them are coal plants. The Cross Steam plant is about 130 miles north of Hilton Head in Pineville, SC. This plant is rated at 2,350 MW. Just to put that in perspective, the Cross coal plant is close to the same size as the American side Hydroelectric plant at Niagara Falls. This is serious Bulk Power generation capacity.

The Santee-Cooper utility also owns the 3.5 MW rated Solar Farm off of I-95 near Walterboro. Again, referring to the generation assets of Santee-Cooper, the solar capacity is about 0.1% of the total.

The solar collectors are not Dispatchable and obviously only can generate power only about 4-8 hours during the sunny portion of a 24 hour period. Also considered “Green Power” and can function 24/7 is the Landfill Gas plants that Santee-Cooper operates. These capture and use the methane gas which is produced from the decomposition of the organic materials in municipal waste.

Santee-Cooper management recognized the electricity Demand growth of the future. As mentioned above, they correctly planned for the needed increase of new generation capacity by a 45% joint ownership of the Summer Units 2 & 3 nuclear units. Also, Santee-Cooper approved the design and construction of a new 600 MW clean coal plant near Florence, SC. The components for this plant were designed and purchased. However, extreme opposition from environmental extremist organizations forced it to be cancelled. As I understand it, The large Central Electric Co-Operative in upstate S.C. negotiated a power purchase agreement with Duke Energy to purchase excess Bulk Power generation from Duke’s nuclear plants. This agreement provided excellent low cost Bulk power up to about 2030. After 2030 the contract will need to be renegotiated. Also, in 2030 the Oconee #1 nuclear power plant operating license will need to be extended by the NRC. (Nuclear Regulatory Commission)

The chart below is from the Santee-Cooper projection of electricity growth from 2020 through 2040. As can be seen from the chart, the 1,045 MW Winyah coal plant is planned for shut down in 2028. The difference between the expected growth to over 6,000 MW by about 2035 could have easily been made up for, were the Pee Dee coal plant and one of the planned additional units at Summer been completed. As this is written, Santee-Cooper and their stakeholders are working to figure out where to secure the replacement generation to replace the 1045 MW’s in capacity that will be lost when the Winyah plant is shut down. From what I have read, the most likely approval will be solar, batteries for backup and when all that is inadequate, they will install more Gas Turbine Combined Cycle units. Time will tell.

Based on the foregoing and a lot of additional information, some of which is included in the references at the end, I have formed my conclusions….

Thank you for this opportunity to be part of your program tonight. I sincerely appreciate your interest in energy and electricity. Feel free to contact me should you have any further questions,

Yours very truly,

Dick Storm, Monday November 14, 2022

Energy equivalents and other information relevant to this presentation is copied below. Further references and information for further reading are listed following these conversions:

Energy Units and Conversions The data and information which follows is listed for reference and further reading.

1 Watt is the power from a current of 1 Ampere flowing through 1 Volt 
1 kilowatt (kW) is a thousand Watts

1 kilowatt-hour is the energy of one kilowatt power flowing for one hour. (E = P t)

A BTU (British Thermal Unit) is the amount of heat necessary to raise one pound of water by 1 degree Fahrenheit (F). 

1 Megawatt (MW) is a thousand kilowatts  (if Dispatchable power, up to 164 homes)

Hilton Head Island uses about 150-200 MW on a hot summer day

1 Gigawatt (GW) is a thousand Megawatts

1 kWh=3,412.6 BTUs (if converted at 100% efficiency)

1 BTU to convert to work at 100% efficiency= 778 Foot Pounds

1 Quadrillion = 1015 BTU  (World energy usage is about 600 Quads/year, US is about 100 Quads/year since 1996) 

Important Points on the use of Hydrogen (Secondary Energy)  as Fuel: 

Conversion by Electrolyzer of water to Hydrogen, takes about 50 kWh/pound of hydrogen (39 kW/pound is at 100% efficiency)

Electrolyzer produced electricity back to electricity = 26-30% round trip

It takes 9 pounds of water to create 1 pound of hydrogen

Hydrogen Energy from 1 cubic foot=325 BTUs, Methane CH= 1,030 BTUs Hydrogen has less Energy Density

Liquified Hydrogen is -423 Degrees F.  (Liquifying is at cost of of about 30% of the energy available from the Liquid Hydrogen Fuel itself)

Liquified Natural Gas (LNG) is  -260 Degrees F.

Power Conversion

1 horsepower (hp) = 745.7 watts

I Air Conditioning Ton approx. 1 kWh

Gas Volume to Energy Conversion

One thousand cubic feet of natural gas (Mcf) -> 1.027 million BTU 

Energy Content of Fuels

Coal     (Bituminous)             10,500- 12,500 BTU/pound               (Recent cost $15.00/million BTUs, Cost in 2019 about $2.50/million Btus)

Coal (Wyoming PRB)             8,000-9000 BTU/pound
Natural gas (Methane CH4) 1,030 BTU/cubic foot                        (Recent cost $7.00/million BTUs)
Wood                                       8,200-9,600  Btus/pound

Hydrogen                             51,600 BTUs/pound (LHV)                (Recent cost $17.00+/million BTUs If you can find it)

Approximate Fuel Energy Content/million BTU 

Gasoline                       115,400-125,000 BTU/gallon                 (at $3.50/gallon= $30.00/million BTUs)

Gasoline E10                 114,300 BTU/gallon

Diesel                           128,700-135,000 BTU/gallon                 (at $6.00/gallon= $46.62/million BTUs)

Ethanol (E100)                75,700 BTU/gallon

Propane                          83,500 BTU/gallon

References for further research on Energy and Climate Policies:

  1. Reuters, Oct. 25, 2022, Dr. Faith Birol of IEA states, “This is the World’s First Global Energy Crisis”: https://www.reuters.com/markets/commodities/global-lng-markets-further-tighten-next-year-ieas-birol-2022-10-25/
  2. Energy is Life by Dr. Samuele Furfari, Oct 17, 2022: https://blog-friendsofscience-org.cdn.ampproject.org/c/s/blog.friendsofscience.org/2022/10/17/energy-in-addition-to-the-security-challenge-now-the-safety-challenge/amp/
  3. 97% CONSENSUS ON CLIMATE CHANGE? SURVEY SHOWS ONLY 59% OF SCIENTISTS EXPECT SIGNIFICANT HARM:

https://www.heartland.org/news-opinion/news/97-consensus-on-climate-change-survey-shows-only-59-of-scientists-expect-significant-harm

4. Blackouts Threaten New England Again, Donn dears Blog :  https://ddears.com/2022/10/25/blackouts-threaten-new-england-again/

5. Dick Storm Blog, November 2022, “Electric Generation Planning, Then and Now”: https://dickstormprobizblog.org/2022/11/10/electric-generation-planning-then-and-now-what-will-be-the-monuments-to-poor-planning-in-2024/

6. Dr. Steven Koonin on Catastrophic Climate Change:  https://www.prageru.com/video/is-there-really-a-climate-emergency?utm_source=Iterable&utm_medium=email&utm_campaign=campaign_5331670

7. Donn Dears Politics of Energy Part 1 (Largest energy reserves): https://bit.ly/3J5OnTc

8. North American Electric Reliability Corp., Long Term Reliability study: https://www.nerc.com/pa/RAPA/ra/Reliability%20Assessments%20DL/NERC_LTRA_2021.pdf

9. SEPP (Science and Environmental Policy Project): http://www.sepp.org/the-week-that-was.cfm  

10. Mark Mills, Prager University, On Energy: https://www.youtube.com/embed/wDOI-uLvTnY

11. Dick Storm Short Link, Elitists & Special Interests Govern Climate Policies: https://dickstormprobizblog.org/2021/11/03/glasgow-cop-26-elitists-and-special-interests-promote-china-first-america-last-why-because-energy-savvy-engineers-were-not-successful-in-educating-the-public-and-politicians-on-the-true-facts/

12. Americans use about a Million Btu’s per day per person to sustain our economy & quality of life: https://dickstormprobizblog.org/2022/05/17/providing-a-sustainable-million-btus-per-day-per-person-by-fuel-source/

13. Donn Dears Article on Net-Zero Carbon Reality Conclusions:  https://bit.ly/38ZVjDZ

14. The Right Stuff Climate Team (Retired NASA Engineers): https://www.therightclimatestuff.com

15. The Energy Crisis will Worsen, Daniel Yergin, July 11, 2022: https://www.project-syndicate.org/commentary/energy-crisis-will-deepen-no-supply-by-daniel-yergin-2022-07

16. Nuclear Energy Institute, Area required for wind, dwarfs land needed for nuclear power: NEI Land Area Required for Wind and Solar to replace a 1000 MW Nuclear Plant: https://www.nei.org/news/2015/land-needs-for-wind-solar-dwarf-nuclear-plants

17. World Nuclear Organization: https://world-nuclear.org/information-library/current-and-future-generation/nuclear-power-in-the-world-today.aspx

 18. Real Time US Power Grid link to EIA: https://www.eia.gov/electricity/gridmonitor/dashboard/electric_overview/US48/US48

19. No, we cannot electrify everything, Capital Research, December 2021 issue: https://capitalresearch.org/app/uploads/Capital-Research-2021-8.pdf

20. Michael Schellenberger article on German experience of “Green Power”: https://www.forbes.com/sites/michaelshellenberger/2019/05/06/the-reason-renewables-cant-power-modern-civilization-is-because-they-were-never-meant-to/?sh=6da16be6ea2b

21. CONGRESSIONAL RESEARCH CENTER REPORT, An excellent primer on energy with outstanding illustrations:https://crsreports.congress.gov/product/pdf/R/R46723

22. American Public Power Assoc. Electric Generation by Sources, 2022: https://www.publicpower.org/resource/americas-electricity-generating-capacity

23. International Energy Agency, How the Energy Crisis is Exacerbating the Food Crisis, June 2022: https://www.iea.org/commentaries/how-the-energy-crisis-is-exacerbating-the-food-crisis

24. Vaclav Smil, Scientist Interview on “How the World Really Works” by New York Times, April 2022: https://www.nytimes.com/interactive/2022/04/25/magazine/vaclav-smil-interview.html

25. Vaclav Smil Books: “Power Density”, “How the World Really Works”, “Energy and Civilization”, “Grand Transitions” and more. He has written about 40 books, most based on the importance of energy.

26. POWER Magazine, Sonal Patel, Sept 9, 2022, EPA Rules likely to shut down about 86 GW of coal generation in next few years: https://www.powermag.com/group-epas-coordinated-regulatory-assault-on-coal-power-could-push-retirements-beyond-86-gw-by-2030/?oly_enc_id=3247D5884312C9W

27. EIA Coal to Nuclear Report, Sept. 2022: https://www.energy.gov/ne/articles/could-nations-coal-plant-sites-help-drive-clean-energy-transition

28. You Tube, “How Much Energy Will the World Need”: https://www.youtube.com/embed/wDOI-uLvTnY

29. Dr. Nicolas Kokell, Sources of Primary Energy :  https://portfolio-pplus.com/Communicator/Details_Article/1023

30. Professor Furfari article Sept. 2022, Hopeless European Green new Deal: https://clintel.org/the-many-hopeless-european-climate-change-laws/

31. Bloomberg, China to Build 150 new nuclear plants, valued about $440 Billion. November 2021: https://www.bloomberg.com/news/features/2021-11-02/china-climate-goals-hinge-on-440-billion-nuclear-power-plan-to-rival-u-s#xj4y7vzkg

32. IEA Energy Costs to Produce Food, June 2022: https://www.iea.org/commentaries/how-the-energy-crisis-is-exacerbating-the-food-crisis

33. WSJ May 8, 2022, Power Plants Struggling With Electricity Shortages to Keep Power on: https://www.wsj.com/articles/electricity-shortage-warnings-grow-across-u-s-11652002380?cx_testId=3&cx_testVariant=cx_2&cx_artPos=0&mod=WTRN#cxrecs_s  

34. WSJ June 18, 2022, West Risks Blackouts From Drought and loss of Hydroelectric Capacity: https://www.wsj.com/articles/west-risks-blackouts-as-hydroelectric-power-dries-up-11624008601?mod=article_inline  

35. WSJ, Opinion, May 27, 2022, Jason Hayes, “Why Blackouts are Coming to Michigan” Regarding shutdown of Palisades Nuclear Generating Plant: https://www.wsj.com/articles/why-electricity-blackouts-are-coming-to-michigan-nuclear-power-plant-green-energy-renewable-climate-11653685521?cx_testId=3&cx_testVariant=cx_2&cx_artPos=5&mod=WTRN#cxrecs_s

36. NERC Warning of Blackout Risk: https://www.datacenterdynamics.com/en/news/north-american-electric-reliability-corp-warns-of-increased-risk-of-grid-blackouts-this-summer/

37. The Guradian (UK) China’s Premier Calls For More Coal Plants, June 24, 2022: https://www.theguardian.com/world/2022/jun/24/chinese-premier-calls-for-more-coal-production-as-electricity-demand-soars  

38. Global Food Supply at Risk Due to High Energy Prices, The Guardian, June 25, 2022: https://www.theguardian.com/australia-news/2022/jun/25/our-global-food-supply-is-at-risk-when-high-gas-prices-limit-the-creation-of-fertiliser

39. US and World Coal Reserves Map: https://www.researchgate.net/figure/Coal-reserves-volumes-by-countries-of-the-world-3_fig1_328037099

40. EIA 2nd reference on World Coal Reserves, EIA 2011: https://www.eia.gov/todayinenergy/detail.php?id=2930

41. American Geosciences institute, World Coal Reserves: https://www.americangeosciences.org/critical-issues/maps/interactive-map-coal-resources-united-states

42. EIA Total Energy Use 1950-2020: https://www.eia.gov/todayinenergy/detail.php?id=43515

43. St. Louis Fed. Renewable Power Increases have reduced Conventional Power Generation Capacity Factors, thus weakening cash flow for O&M and improvements: https://fredblog.stlouisfed.org/2020/10/renewables-have-increased-the-capacity-for-electricity-production/?utm_source=series_page&utm_medium=related_content&utm_term=related_resources&utm_campaign=fredblog

44. Fact Check on Wind Power Cost: https://www.factcheck.org/2019/07/does-wind-work-without-subsidies/

45. Forbes, Michael Schellenberger article on True Cost of Wind Power: https://www.forbes.com/sites/michaelshellenberger/2021/04/20/why-renewables-cause-blackouts-and-increase-vulnerability-to-extreme-weather/?sh=6400daf54e75  

46. EPA Retains Tools to Harm Coal Power Production, Utility Dive, July 1, 2022: https://www.utilitydive.com/news/supreme-court-epa-GHG-carbon-power-plant/626456/?utm_source=Sailthru&utm_medium=email&utm_campaign=Issue:%202022-07-01%20Utility%20Dive%20Newsletter%20%5Bissue:42837%5D&utm_term=Utility%20Dive

47. VOX, Electrify Everything! : https://www.vox.com/2016/9/19/12938086/electrify-everything

48. Stanford, Mark Jacobson, Net Zero Carbon by 2050 : https://news.stanford.edu/2015/06/08/50states-renewable-energy-060815/

Jacobson’s website: https://web.stanford.edu/group/efmh/jacobson/Articles/I/WWS-50-USState-plans.html

49. UN Net Zero Carbon website: https://www.un.org/en/climatechange/net-zero-coalition  

 50. Princeton University Net Zero Carbon Plan: Net Zero Carbon Project Princeton University Researchers, Jenkins et al: https://cmi.princeton.edu/annual-meetings/annual-reports/year-2019/the-net-zero-america-project-finding-pathways-to-a-carbon-neutral-future/

51. Cornell Daily Sun, Speaker discusses Coal Plants in a Death Spiral: https://cornellsun.com/2016/10/03/keynote-speaker-investigates-recent-transformations-in-the-energy-grid/

52. WSJ Australia Warning on Green Energy Risks:  https://www.wsj.com/articles/a-warning-from-australias-power-crisis-green-energy-anthony-albanese-11655659465?cx_testId=3&cx_testVariant=cx_2&cx_artPos=3&mod=WTRN#cxrecs_s

53. National Coal Council, Enhanced Oil Recovery using C02 from Coal Plants, 2012: http://www.nationalcoalcouncil.org/reports/07-10-12-NCC_Harnessing_Coals_Carbon_Content_to_Advance_Economy_Environment_EnergySecurity.pdf

54. Detroit News, Consumers Energy to End Coal Use in 2025: https://www.detroitnews.com/story/business/2022/06/23/michigan-panel-approves-consumers-energy-plan-end-coal-use-2025/7716918001/

55. Alliant and WEC Change Plans to Retire Coal to Meet Demand, June 22, 2022: https://www.utilitydive.com/news/wisconsin-utilities-coal-retirement-miso-delay/626005/

56. The Permian Basin, The Gift of An Almost Permanent Supply of Oil at 2.5 million barrels/day, Sept 2022: https://wattsupwiththat.com/2022/10/04/the-permian-basin-the-gift-that-keeps-on-giving/

57. Liberty Energy, “Bettering Human Lives, ESG Report” August 2022: https://investors.libertyfrac.com/press-releases/2022/08-02-2022-222014779

58. Donn Dears Blog on Electric Vehicles and Lithium Batteries: https://bit.ly/3RDXOfB

59. BP Statistical Review of World Energy 2022:  https://www.bp.com/content/dam/bp/business-sites/en/global/corporate/pdfs/energy-economics/statistical-review/bp-stats-review-2022-full-report.pdf

60. IEA World Energy Outlook Reports: https://www.iea.org/topics/world-energy-outlook#reports

61. EIA (U.S. Dept. of Energy) Annual Energy Outlook: https://www.eia.gov/outlooks/aeo/

62. China, Keeping Coal King, Bloomberg: https://assets.bwbx.io/images/users/iqjWHBFdfxIU/iBjpZ.bmbits/v0/-1x-1.png

63. Coal is King in China, Bloomberg: https://assets.bwbx.io/images/users/iqjWHBFdfxIU/i3CKBFPaA7g0/v0/-1x-1.png

64. China Climate Advisers Say More Coal Needed for Energy Security, Bloomberg, Nov. 15, 2022:
https://www.bloomberg.com/news/articles/2022-11-15/china-climate-advisers-say-more-coal-needed-for-energy-security?mc_cid=72c8bf23a3&mc_eid=dddcf9dc32&leadSource=uverify%20wall

65. Facts on EV Charging by EVESCO, Good explanation of electrical Demand for EV Charging: https://www.power-sonic.com/blog/levels-of-ev-charging/

66. EIA Electricity Generation Facts, 2021: https://www.eia.gov/energyexplained/electricity/electricity-in-the-us-generation-capacity-and-sales.php

67. Mark Mills, Prager Univ. Myths of Green Energy, Nov. 2022: https://twitter.com/prageru/status/1589634529253261312

68. Competitive Enterprise Institute, Fifty Years of Wrong Predictions, 2019: https://cei.org/blog/wrong-again-50-years-of-failed-eco-pocalyptic-predictions/

I hope these references are useful to you to discover facts and information that are not readily discussed by the Main Stream Media.

Yours very truly,

Richard F. (Dick) Storm, PE

Richard.storm@stormeng.com

Electric Generation Planning, Then and Now. What Will Be The Monuments to Poor Planning in 2024?

The U.S. has No Energy Policy in 2022. Only a Decarbonization Policy without a Rational plan to achieve a low carbon Energy supply. Keep in mind, Energy is needed for not only electricity generation, but also for Transportation, Industrial production, Commercial and Residential uses. Currently, about 87% of our total primary energy is provided by conventional sources of natural gas, coal, nuclear and hydroelectric. Wind and Solar provided less than 5% of total Primary Energy in 2021. Yet, there are many influential groups calling for policies to “Electrify Everything”.

Let me digress and quote a highly respected Utility Engineering Manager from the 1970’s. That man is Mendall H. Long, a member of the Greatest Generation who after graduation from NCSU served as the youngest Chief Engineer of the Standard Oil Fleet during WWII. After the war he joined Carolina Power & Light and rapidly rose through the ranks from shift supervisor to Manager of Fossil Plant Engineering. Me and many others loved that man for both his engineering skills as well as his wisdom and leadership. In the 1970’s CP&L and Duke Power’s electricity growth was almost 10% per year with growing industrial load and wide use of residential heat pumps. At CP&L which then was a 4,000 MW regional utility, the Asheville Unit #2 (200MW) was built about 1970, then the 700 MW H.B. Robinson nuclear plant about 1971, 420 MW Sutton #3 in 1972 and the 720 MW Roxboro #3 started up in June 1973. Except for Robinson, all were coal plants and needed to satisfy load growth. That was when Utilities planned for electric load growth and added generation based on projections of future demand. The four new units built between 1970 and 1973 above totaled 2,040 MW and the total peak generation was in the range of 4,000 MW. The quote from Mr. Long that I remember as he motioned toward some Internal Combustion gas turbines that were built for peaking and backup of the large new coal plants, “Those are Monuments to Poor Planning”. So, I wonder what the “Monuments to Poor Planning will be in 2024? I worked with (both as a Riley startup engineer and as an engineer employed by CP&L) and for CP&L during those years and the information provided is from my personal experiences and memory.

Lets take a look at what a Rational plan would be to add generation in anticipation of future Demand. In fact, lets take my adopted state of South Carolina as an example.

South Carolina Electricity Generation Planning 2006-2016

Before I retired from full time employment, I participated in consulting, testing, trouble shooting and design of performance improvements for coal power plants at South Carolina Electric and Gas and Santee-Cooper power plants (as well as many other utilities). During this process I got to know and respect a number of senior managers at these Utilities. One such senior manager was Mr. Bill McCall of Santee-Cooper. I remember one technical conference where Mr. McCall gave a presentation on Santee-Cooper’s load growth from both electricity intensive Industrial plants within the Santee-Cooper service territory, such as Alumax (now Century Aluminum) and Nucor Steel and the rapid growth of housing (like NC in the 1970’s) and commercial enterprises along the coast north and south of Myrtle Beach. Mr. McCall went on to describe how electric demand was growing at unprecedented levels, and it was. He went on to show the need for building the two additional coal units at the Cross Generating Station, increasing the generation capacity of that plant to 2,340 MW and the need for the proposed 600 MW Pee Dee Generation Plant. Then there was the joint effort/ownership of SCE&G and Santee-Cooper to build the two additional nuclear units at Summer Station in Jenkinsville, SC. The significant dates of new units built or planned to be built during this period is shown below:

1984 Santee-Cooper Electric Generation Peak exceeds 5,000 MW

1984 Cross Generating Station Is Commissioned

1995 Cross Unit #2 Becomes Commercial

1999 800 MW Rainy Gas Turbine Combined Cycle Plant Approved for Construction

2004 Two 600 MW Cross Units #3&4 Construction in progress

2004 600 MW Pee Dee Energy Campus is approved by Santee-Cooper Board for construction

2007 New Peak Demand record set at 5,563 MW’s, Cross Unit #3 begins commercial operation

2008 SCE&G and Santee-Cooper File appliction for Summer Unit #3 Nuclear Unit (1,100 MW)

2011 NRC approves second Summer Nuclear Unit for a total expansion of 2,200 MW of new nuclear power generation capacity. This is shared capacity of SCE&G and Santee-Cooper with Santee-Cooper having a 45% ownership share. Now, the foregoing new plants to be added from 2007 on would seem to be a good plan for growth. It was until two major problems: 1. The 600 MW Pee Dee Energy Campus was cancelled in 2009 due largely to outside interference and agitation from environmental extremist groups and 2. Mismanagement of construction of the two nuclear units at Summer by SCE&G. A Rational Plan for new generation capacity of Dispatchable coal and nuclear generation capacity was scrapped. Now, there are continuing and increasing public and government pressures to install only wind and solar and to shut down existing coal plants as soon as possible. The 1,045 MW Winyah coal plant is planned to be shut down in 2028. But, at this writing there is no definite plan (that I am aware) to replace the 1,045 MW of coal generation. The illustration below is from Santee-Cooper’s IRP presentation.

When I first became associated with Santee-Cooper in 1971 as one of the test engineers performing acceptance testing at the Jefferies Coal plant in Moncks Corner, the system peak load was about 3,000 MW. Since then as can be seen from the projections to the future, Santee-Cooper’s service territory will grow to over 6,000 MW by 2037. This is natural growth without the MSM and government screaming, “Electrify Everything”!

Who is Accountable for Poor Planning?

In my opinion, there are multiple reasons and organizations that have brought our country to the absense of proper generation planning. Nine major contributors to “Poor Planning” are the U.N.-IPCC, the World Economic Forum, the Main Stream Media, Public Indoctrination by Politicians that follow the “Green Religion”, the U.S. Democrat Party, Environmental Extremist Organizations, Billionaire activists such as Bezos and Bloomberg and Public School Indoctrination of Green Policies and “Woke” corporations. I presented my views to the ENERUM Energy Forum in Columbus in August of this year. One slide I used is copied below:

On a national level, the slide covers many of the major players that have thrown a monkey wrench into generation planning, as it was once done by responsible regional utilities. Now, with the emphasis on interconnecting all Utilities with Regional Transmission Operators and a Federal War on Carbon, there is No Rational Energy Policy. Only a policy to attempt to kill coal and gas plants. It is un-American. My respected and Patriotic engineering manager friend Mr. Long would be screaming from his grave if he knew the madness that has taken over in the U.S. Oh, how I miss gutsy and knowledgeable managers like Mendall Long!

Getting back to S.C. and the lack of planning here. Here are a couple newspaper reports regarding the cancellation of the Pee Dee Coal plant and the Summer units 2&3 nuclear plant.

Conclusions

  1. America did better generation planning in the 1970’s than we do now. In spite of the 1973 Arab Oil Embargo, America’s electricity remained reliable, was affordable and it fueled great economic growth 1970-2020.
  2. There is no energy policy today. The “Electrify Everything” policy promoted by many here and in Eurpope is based on the myth that wind and solar can provide sufficient power. It can’t. Many promoting this myth should know better!
  3. The Regional Transmission Operators such as MISO, PJM and ERCOT combined with economic incentives for wind and solar have made the Grid fragile and less Resilient.
  4. The Environmental Extremists have made policies to shut down vital coal plants that will contribute to unreliable electricity generation.
  5. The EPA and government is run by environmental extremists that escape accountability for the actions and harm they are causing.
  6. Europe is an example our elected officials could look too to observe the costs and harm that extreme green policies can cause.
  7. Meanwhile, China is growing their economy and is on track to become the world’s largest economy passing the U.S.A. and doing so with massive amounts of coal power.

In closing let me ask you, what do you think the Monuments to Poor Planning will be in 2024?

Respectfully and yours truly,

Dick Storm, November 10, 2022