History of Energy and Electricity

Part 3, 2010-2022, by Dick Storm

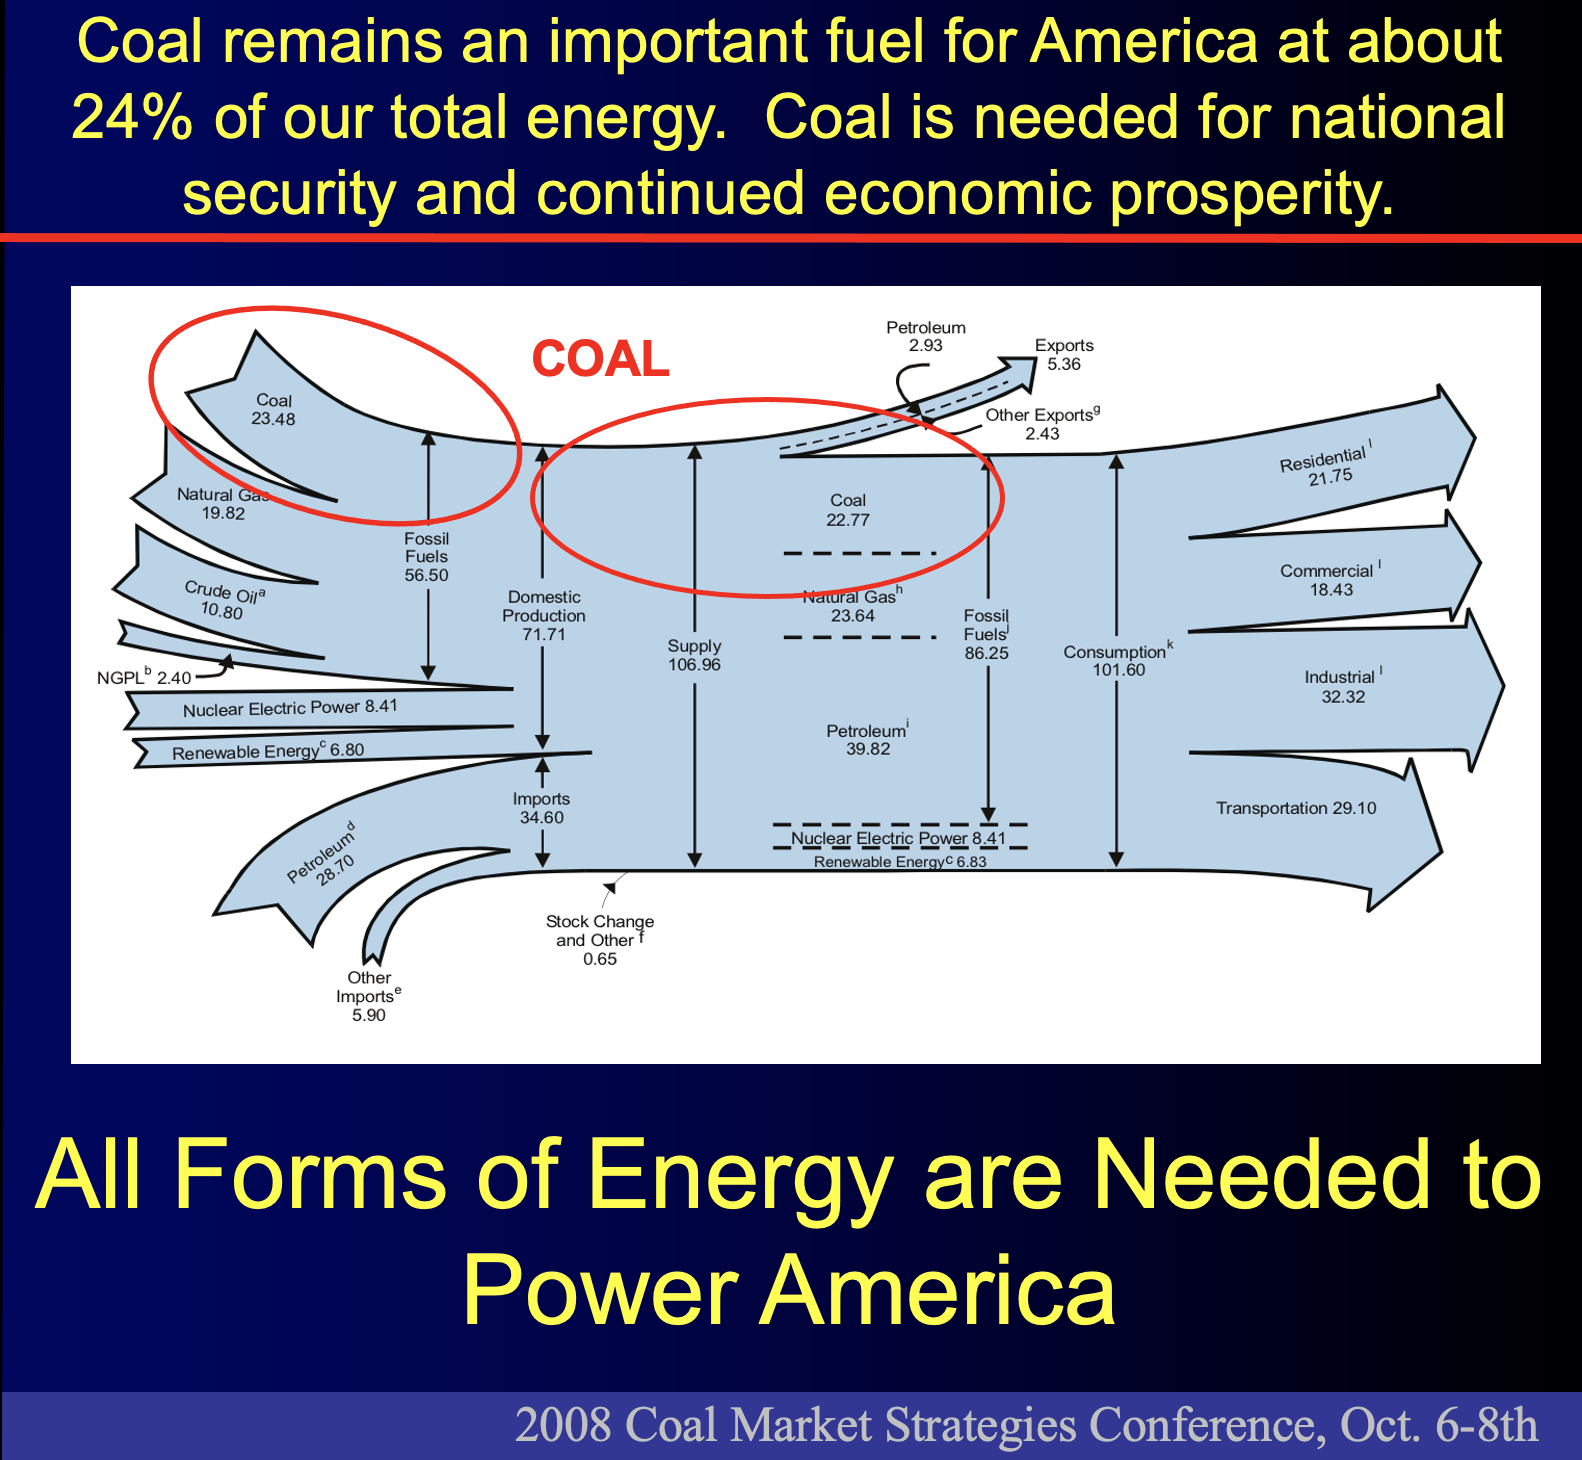
AMERICA BUILDS THE CLEANEST, MOST EFFICIENT COAL PLANTS IN THE WORLD, ACHIEVES ENERGY INDEPENDENCE, BEGINS RESHORING AMERICAN MANUFACTURING, CLEANS OUR AIR AND THEN….

COMMITS SELF INFLICTED ENERGY EUTHANASIA

My intention for the first two parts of the “History of Energy and Electricity Generation” was to outline the importance that energy and electricity played in improving our quality of living & growing our economy to become the largest in the world. America is still the world’s largest economy, but if we continue on the Net Zero Carbon Path of the “Green New Deal” then America will become weaker and China’s influence in the world will exceed America’s. Perhaps not a problem if China was run by Boy Scouts with high morals. But, the CCP does not share our values.

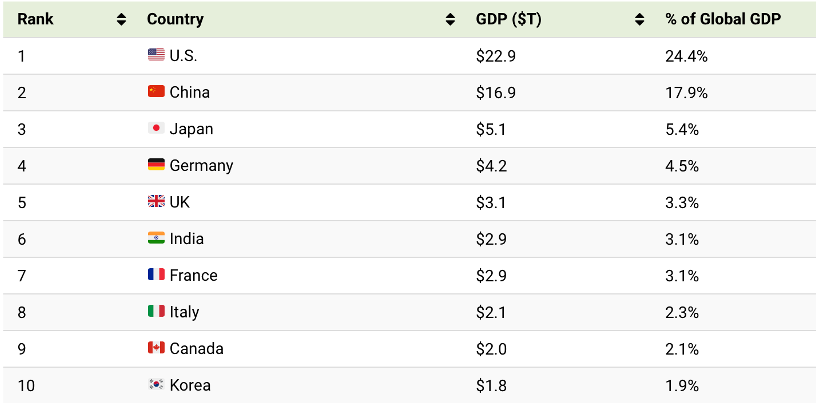
At current trends of economic growth, China’s GDP is likely to surpass the U.S.A.’s before 2030. The Sub-Title of this post is a reminder that during the Obama Presidency America’s Energy Policy was essentially committed to a Self-Inflicted path of energy euthanasia for our great country.  Meanwhile, China ramped up energy production from All Fuel sources. I have written before on the relationship of energy and economic prosperity. That was the theme of parts 1 & 2 of this series. Abundant, reasonable cost energy fueled America’s economy for all of the 20th Century as America became the most productive country in the world with the world’s largest economy.

TWO MAGNIFICENT POWER PLANTS MADE IN THE U.S.A

On a positive note, let’s start with a description of two magnificent Ultra-supercritical clean coal plants. Made in the U.S.A. and amongst the best coal plants ever built. We should have more like these being built now!

AEP Company’s John Turk Ultra-Supercritical Power Plant
Turk Plant Boiler Island and Some of the Air Emissions Control Equipment

The Best Clean Coal Plants Ever Built, Sadly amongst the last ones Built in the U.S.A.

In December 2012 one of the finest examples of American Clean Coal Plants started up. The 600 MW John W. Turk Plant in Arkansas. Power Magazine(3) awarded the plant the highest honor in 2013 for clean, reliable and efficient power generation. Here below is an excerpt of the article in POWER Magazine.

AEP’s SWEPCO requested proposals in December 2005 for new generation to meet long-term capacity needs, and by August 2006 the company settled on coal-fired technology for a new plant site in Arkansas. Construction began in early 2008, and the new plant entered commercial service in December 2012. For overcoming numerous legal and regulatory obstacles and for building the first ultrasupercritical plant in the U.S., the John W. Turk, Jr. plant is awarded POWER’s 2013 Plant of the Year Award. 

The new 600-MW John W. Turk, Jr. Power Plant owned by American Electric Power’s (AEP) Southwestern Electric Power Co. (SWEPCO) is located on a 2,800-acre tract near Fulton, in Hempstead Country, Arkansas, about 20 miles northeast of Texarkana. The Turk Plant, the first modern plant in the U.S. to commercialize ultrasupercritical (USC) boiler technology, was officially declared commercial on Dec. 20, 2012.”

The specifications are impressive. The steam generator is rated at 650 MW power generation capacity. The steam generator evaporates 4,420,000 pounds per hour of water to superheat to 1,100 degrees F. Think about what that means. Four million pounds per hour, if it is expressed as gallons per minute, the evaporation rate is the equivalent flow in GPM of about 8,800 gallons per minute.  This quantity of water is pumped at a pressure of over 4,400 pounds per square inch and then super-heated to over 1,100 degrees F. every minute. That still impresses me to think about it. Thanks to the American metallurgical and welding technology, the ASME Boiler and Pressure Vessel Code and over 150 years of experience, that is one of the American Power Industry’s most magnificent accomplishments, in my opinion.

Plants such as Turk can do this 24/7 constantly and at a high-capacity factor. Unlike Wind or Solar Power, the Turk Plant is fully Dispatchable too.  That is why I describe plants such as Turk and Longview as magnificent! They are truly engineering marvels.

Another example of a modern, efficient supercritical coal plant is the Longview Power Plant near Morgantown, West Virginia. Longview has also attained the accomplishment of becoming the most efficient coal plant in America (different years for Turk and Longview)

Longview Power Plant Located in WVA, Award for Most Efficient Power Plant in U.S. in 2016 by POWER Magazine

Both Turk and Longview are clean coal plants equipped with Flue Gas Desulfurization equipment, Baghouses for particulate collection and Selective Catalytic Reactors for Oxides of Nitrogen correction. Called “Clean Coal because the truly harmful pollutants have been removed.

These two highly efficient HELE Plants, (HELE=High Efficiency Low Emissions) are amongst the last several major coal generating plants built in America. That’s right, about 2012 marked the end of new coal plant design and construction of coal plants in America. Few people outside the power industry understand the implications of what this means for our future. 

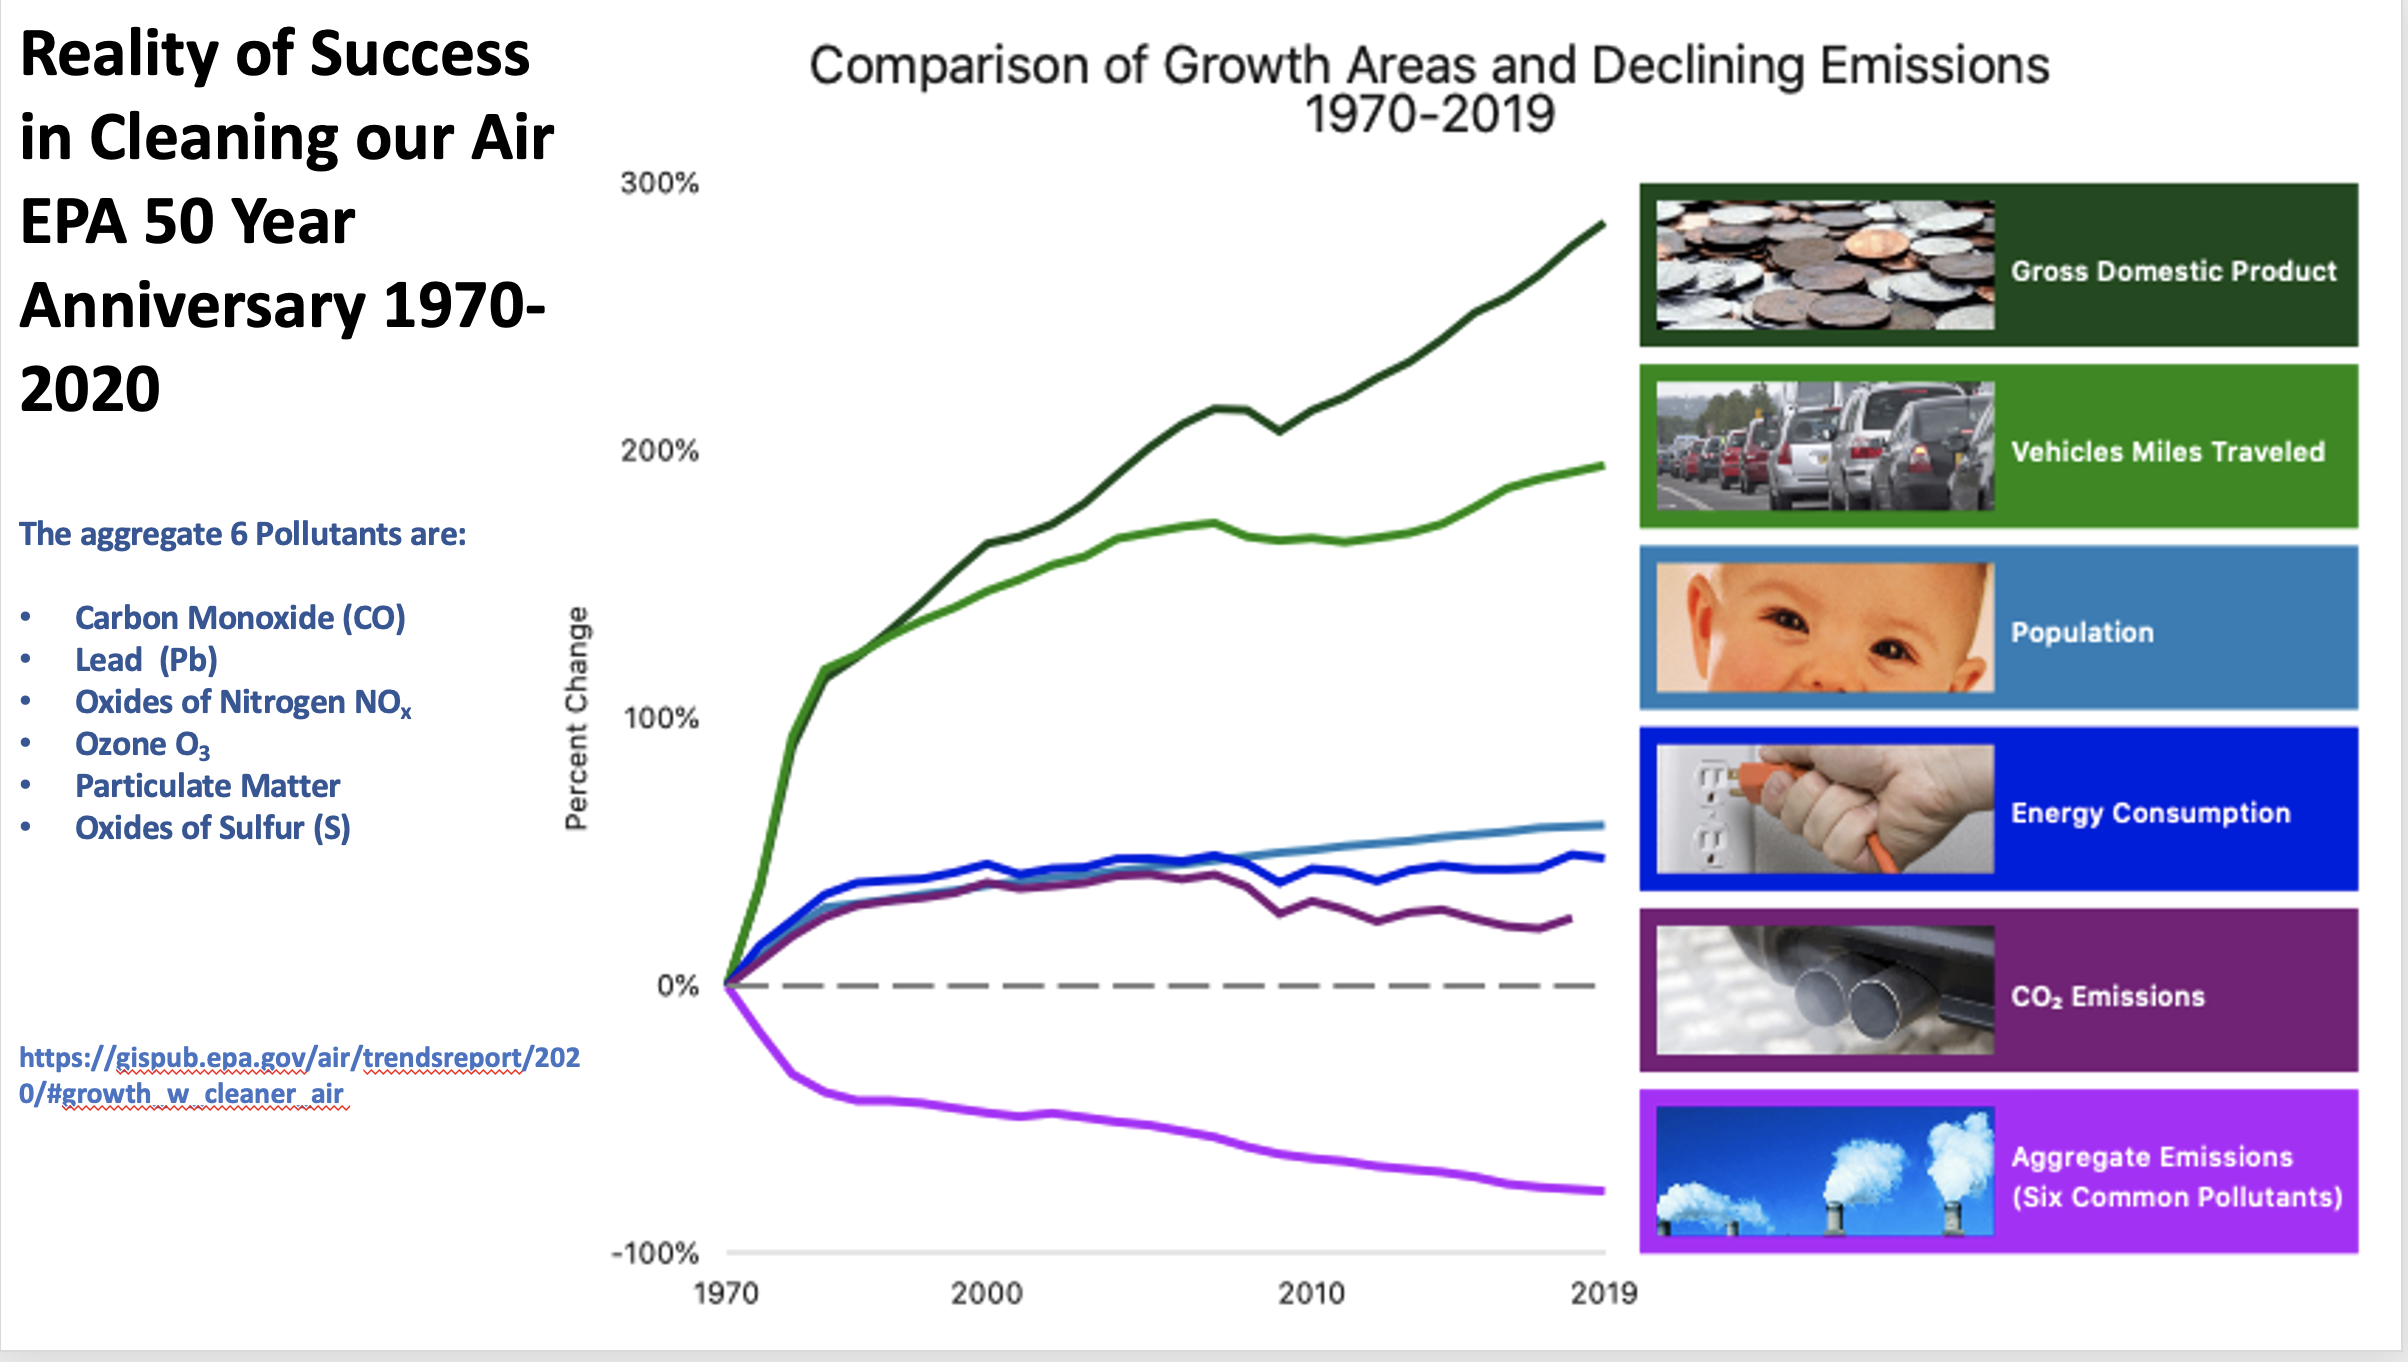
Let me state here that I worked my entire career in the pursuit of excellence in coal power generation. Including efficiency and emissions improvements. I believe in clean air and clean water. The EPA was needed in 1970 because acid rain, fine particulates and ground level ozone were problems which large coal fired power plants contributed to. The success of the efforts of the EPA to clean the air is best described on the chart below which is prepared by the EPA(11)

EPA Comparison of Economic Growth and Air Quality 1970-2018

From my viewpoint, cleaning the air of harmful emissions was accomplished by the time that Obama became President. From that point on, the EPA was weaponized against the best interests of America. Weaponzizing the EPA to create what I call, Energy Euthanasia. It continues today with the Climate Policies that are Destroying America. Check reference # 15 below, Donn Dears Book entitled, “NET-ZERO CARBON, THE CLIMATE POLICY DESTROYING AMERICA”

Weaponizing the EPA:

Commiting to the Present Path of Climate Policy has Seriously Wounded America’s Supply Chain for Power Generation Equipment

The Obama years 2008-2016 set a course for American Energy that were very difficult. Especially for coal power. During Obama’s Presidency, he led the EPA to declare that Carbon Dioxide should be regulated. This was later, upheld by the Supreme Court, the COregulations, right or wrong, became the law of the land. Here is a short summary of how the “War on Coal” during the Clinton administration ratchetted up to becoming “The War on Carbon” and becoming lethal for American Energy Independence, the Fossil Power Plant Equipment Supply Chain & the Economic growth and prosperity that Energy Independence provides.

According the WSJ April 18, 2009, “In 1998, the Clinton administration EPA studied the question and determined that the Clean Air Act was “potentially applicable” to CO2 and other greenhouse gases. But despite continued pressure from environmental groups, the Clinton administration never moved to regulate the gases.

The EPA lumped carbon dioxide with five other gases — methane, nitrous oxide, hydrofluorocarbons, perfluorocarbons and sulfur hexafluoride — into a single class for regulatory purposes. That’s because they share similar properties: All are long-lived and well-mixed in the atmosphere; all trap heat that otherwise would leave the earth and go into outer space; and all are “directly emitted as greenhouse gases” rather than forming later in the atmosphere.”

According to the bulk of somewhat biased scientific research, such as that assembled by the Intergovernmental Panel on Climate Change, the more greenhouse gases there are in the atmosphere, especially carbon dioxide, the more heat is trapped. That leads to rising temperatures. The EPA endorsed the (Politically Biased) IPCC research and specifically said that “natural variations” in climate, such as solar activity, couldn’t explain rising temperatures. For the record, I believe that global rising temperatures have mostly been from natural forces for thousands of years, even before the Ice Age. I am not a Climate Scientist, but there are many highly qualified well credentialed Climate Scientists that I agree with. Such as Professor Richard Lindzen, Judith Curry, Roy Spencer, John Christy, Steven Koonin and many more. Here below is an excerpt from Koonin’s book, “Unsettled, What Climate Science Tells Us and What it Doesn’t and Why it Matters”(18) His closing thoughts are in green font below:

Dr. Steven E. Koonin is a leader in science policy in the U.S. He served as Undersecretary for Science in the Dept. of Energy under President Obama.

“What we think we should do, in short, is begin by restoring integrity to the way science informs society’s decisions on climate and energy-we need to move from The Science back to science. And then take the steps most likely to result in positive outcomes for society, whatever the future might hold for our planet. As President Biden exhorted in his inaugural address, “We must reject the culture which facts themselves are manipulated, or even manufactured”

In my opinion, Dr. Koonin is correct, we should let science get back to science and that much of the huge volumes of research on manmade climate change has been politically inspired, not science inspired.

The current policy of “Net Zero Carbon” has been based on politically biased science and is driven by special interests, but not in the best interests of America.

Further, the Chinese for one country outside the U.S. have worked to  influence alarm with American University students to go green. See reference below (10) where Professor Lindzen of MIT writes on China’s recent actions.

China is Fortifying Their Supply Chain, While We are Self-Inflicting Harm on Ours

The Weaponization of carbon became very effective during the Obama Administration. Interrupted by President Trump and then intensified under the Biden Administration. The path to harm the Fossil Power Systems and Fossil Power Production was ratcheting up to becoming more and more lethal. (Lethal to the Made in U.S.A. supply chain) Electricity prices were kept reasonable and the Greenhouse Gas emissions reduced during this time, thanks to the Shale Gas Revolution.

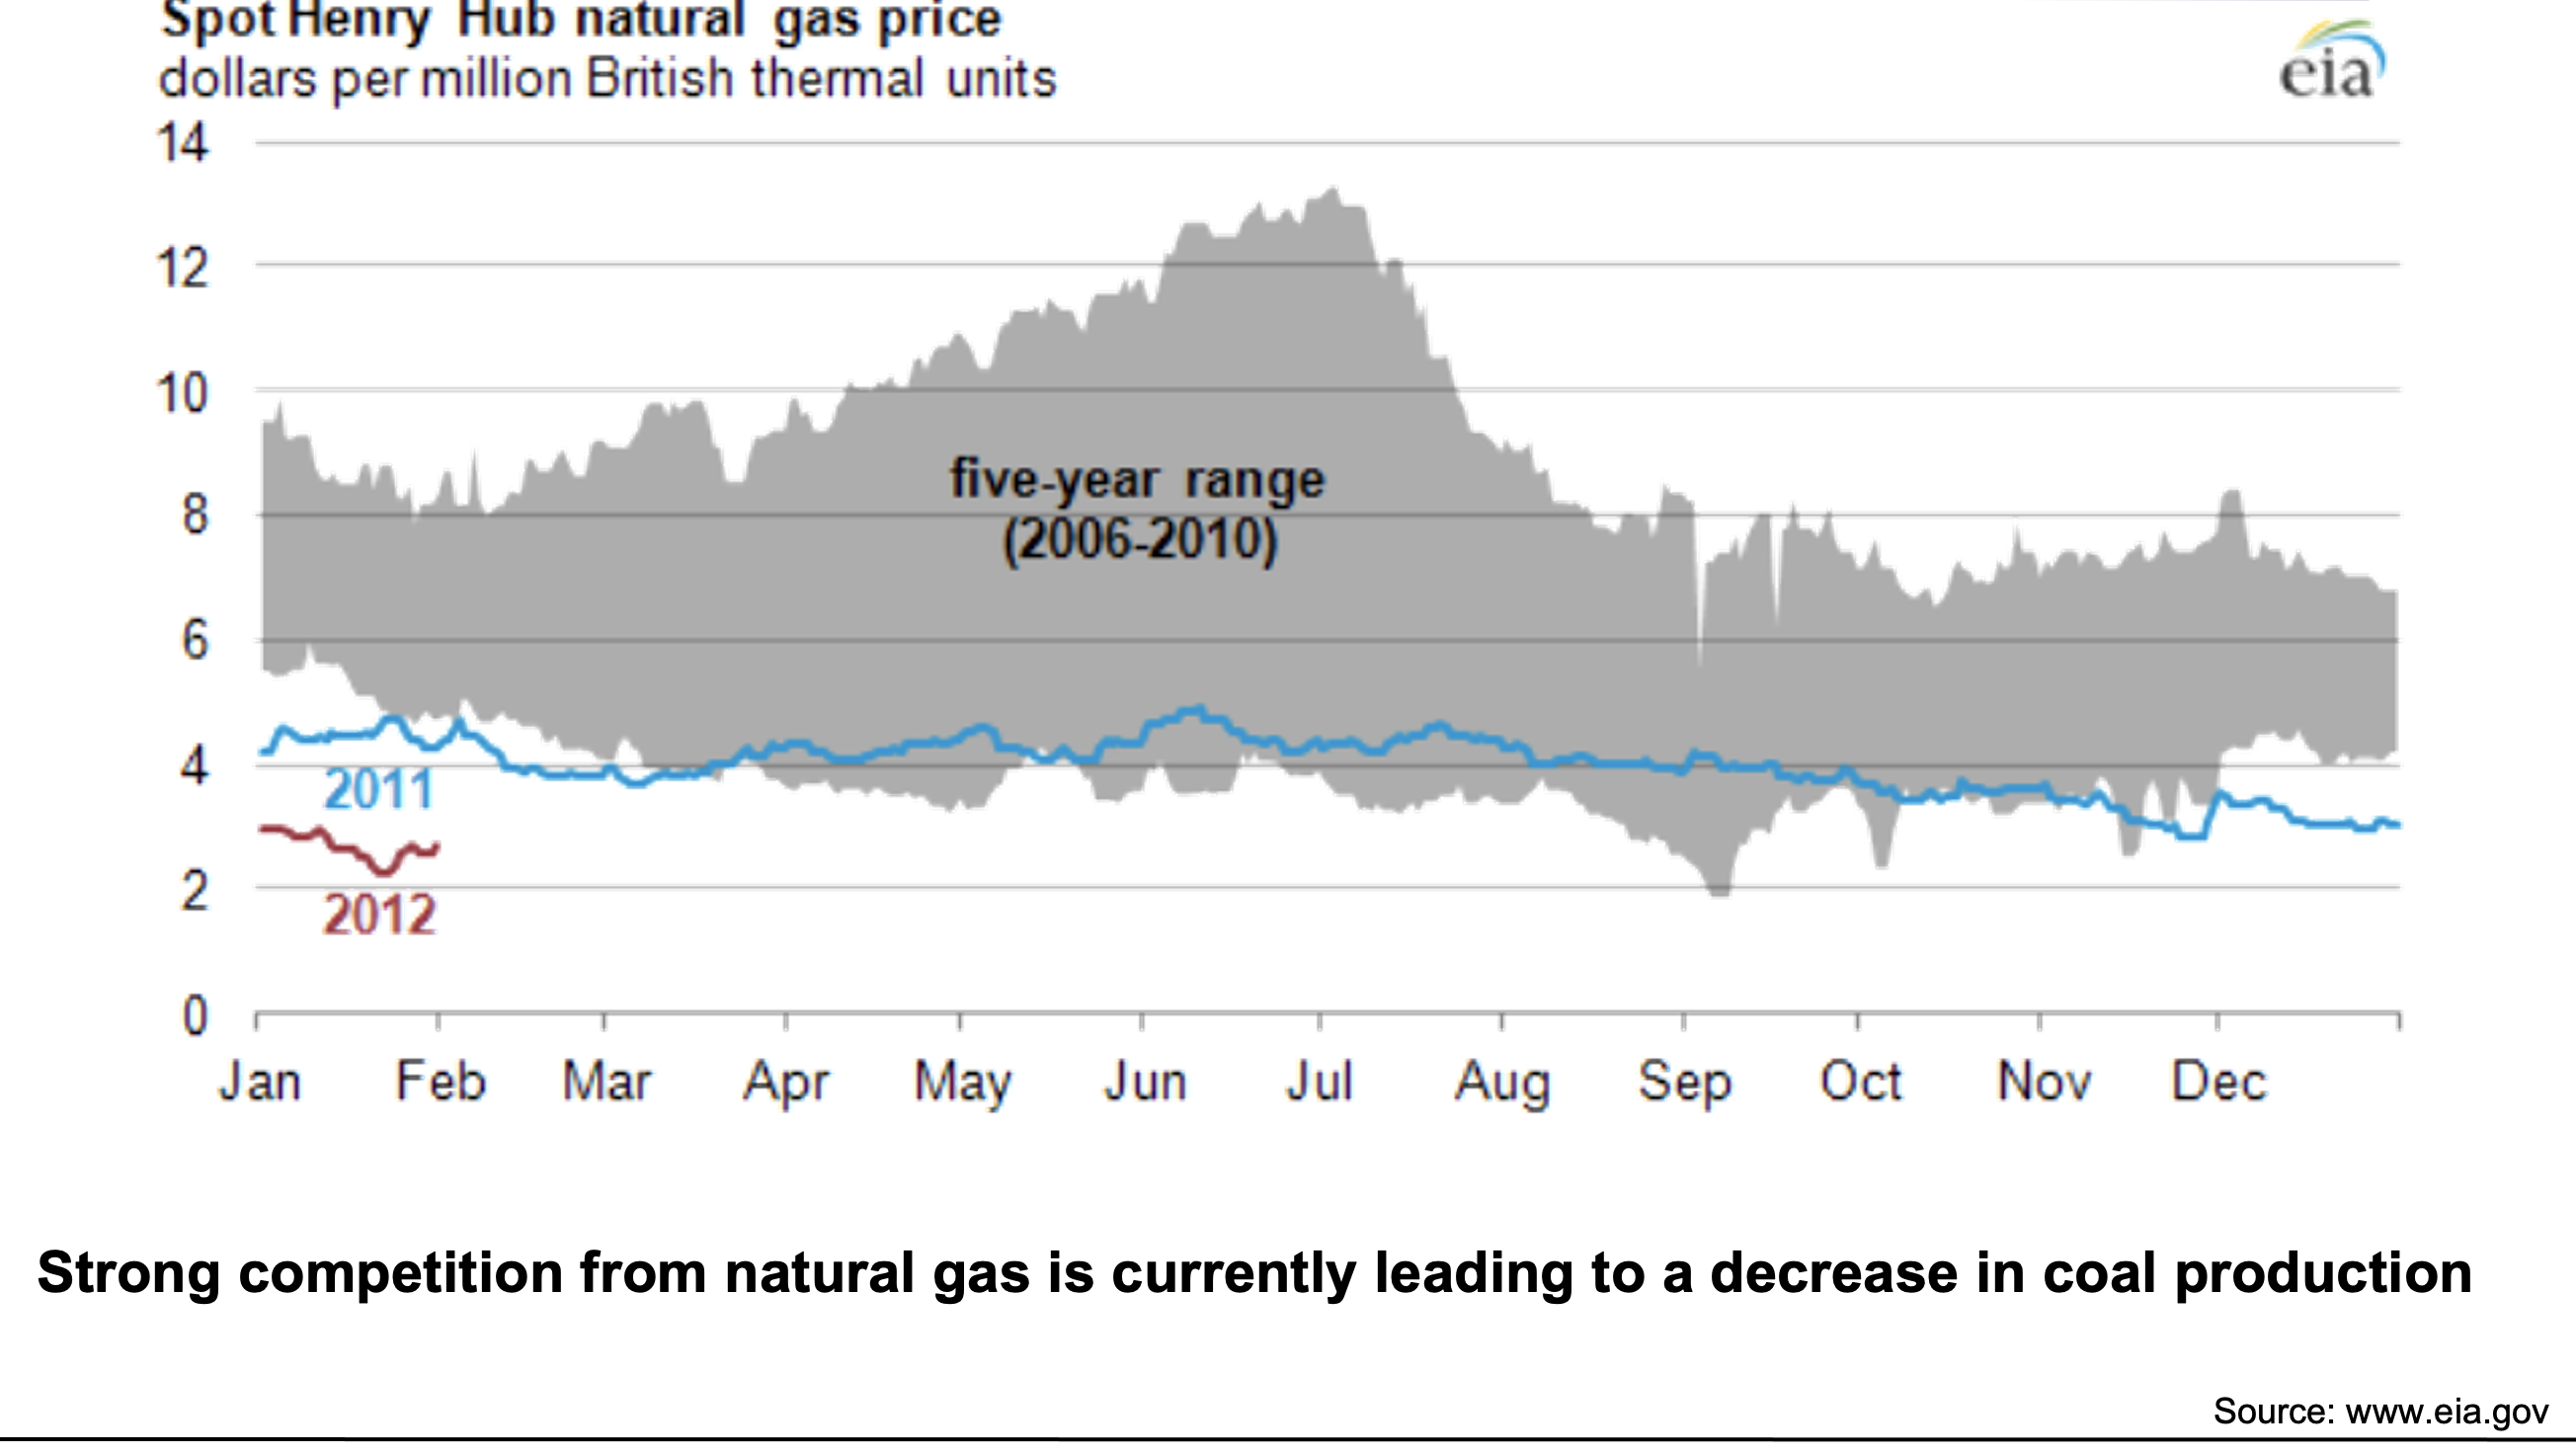
The Shale Gas Revolution Aids the War on Coal

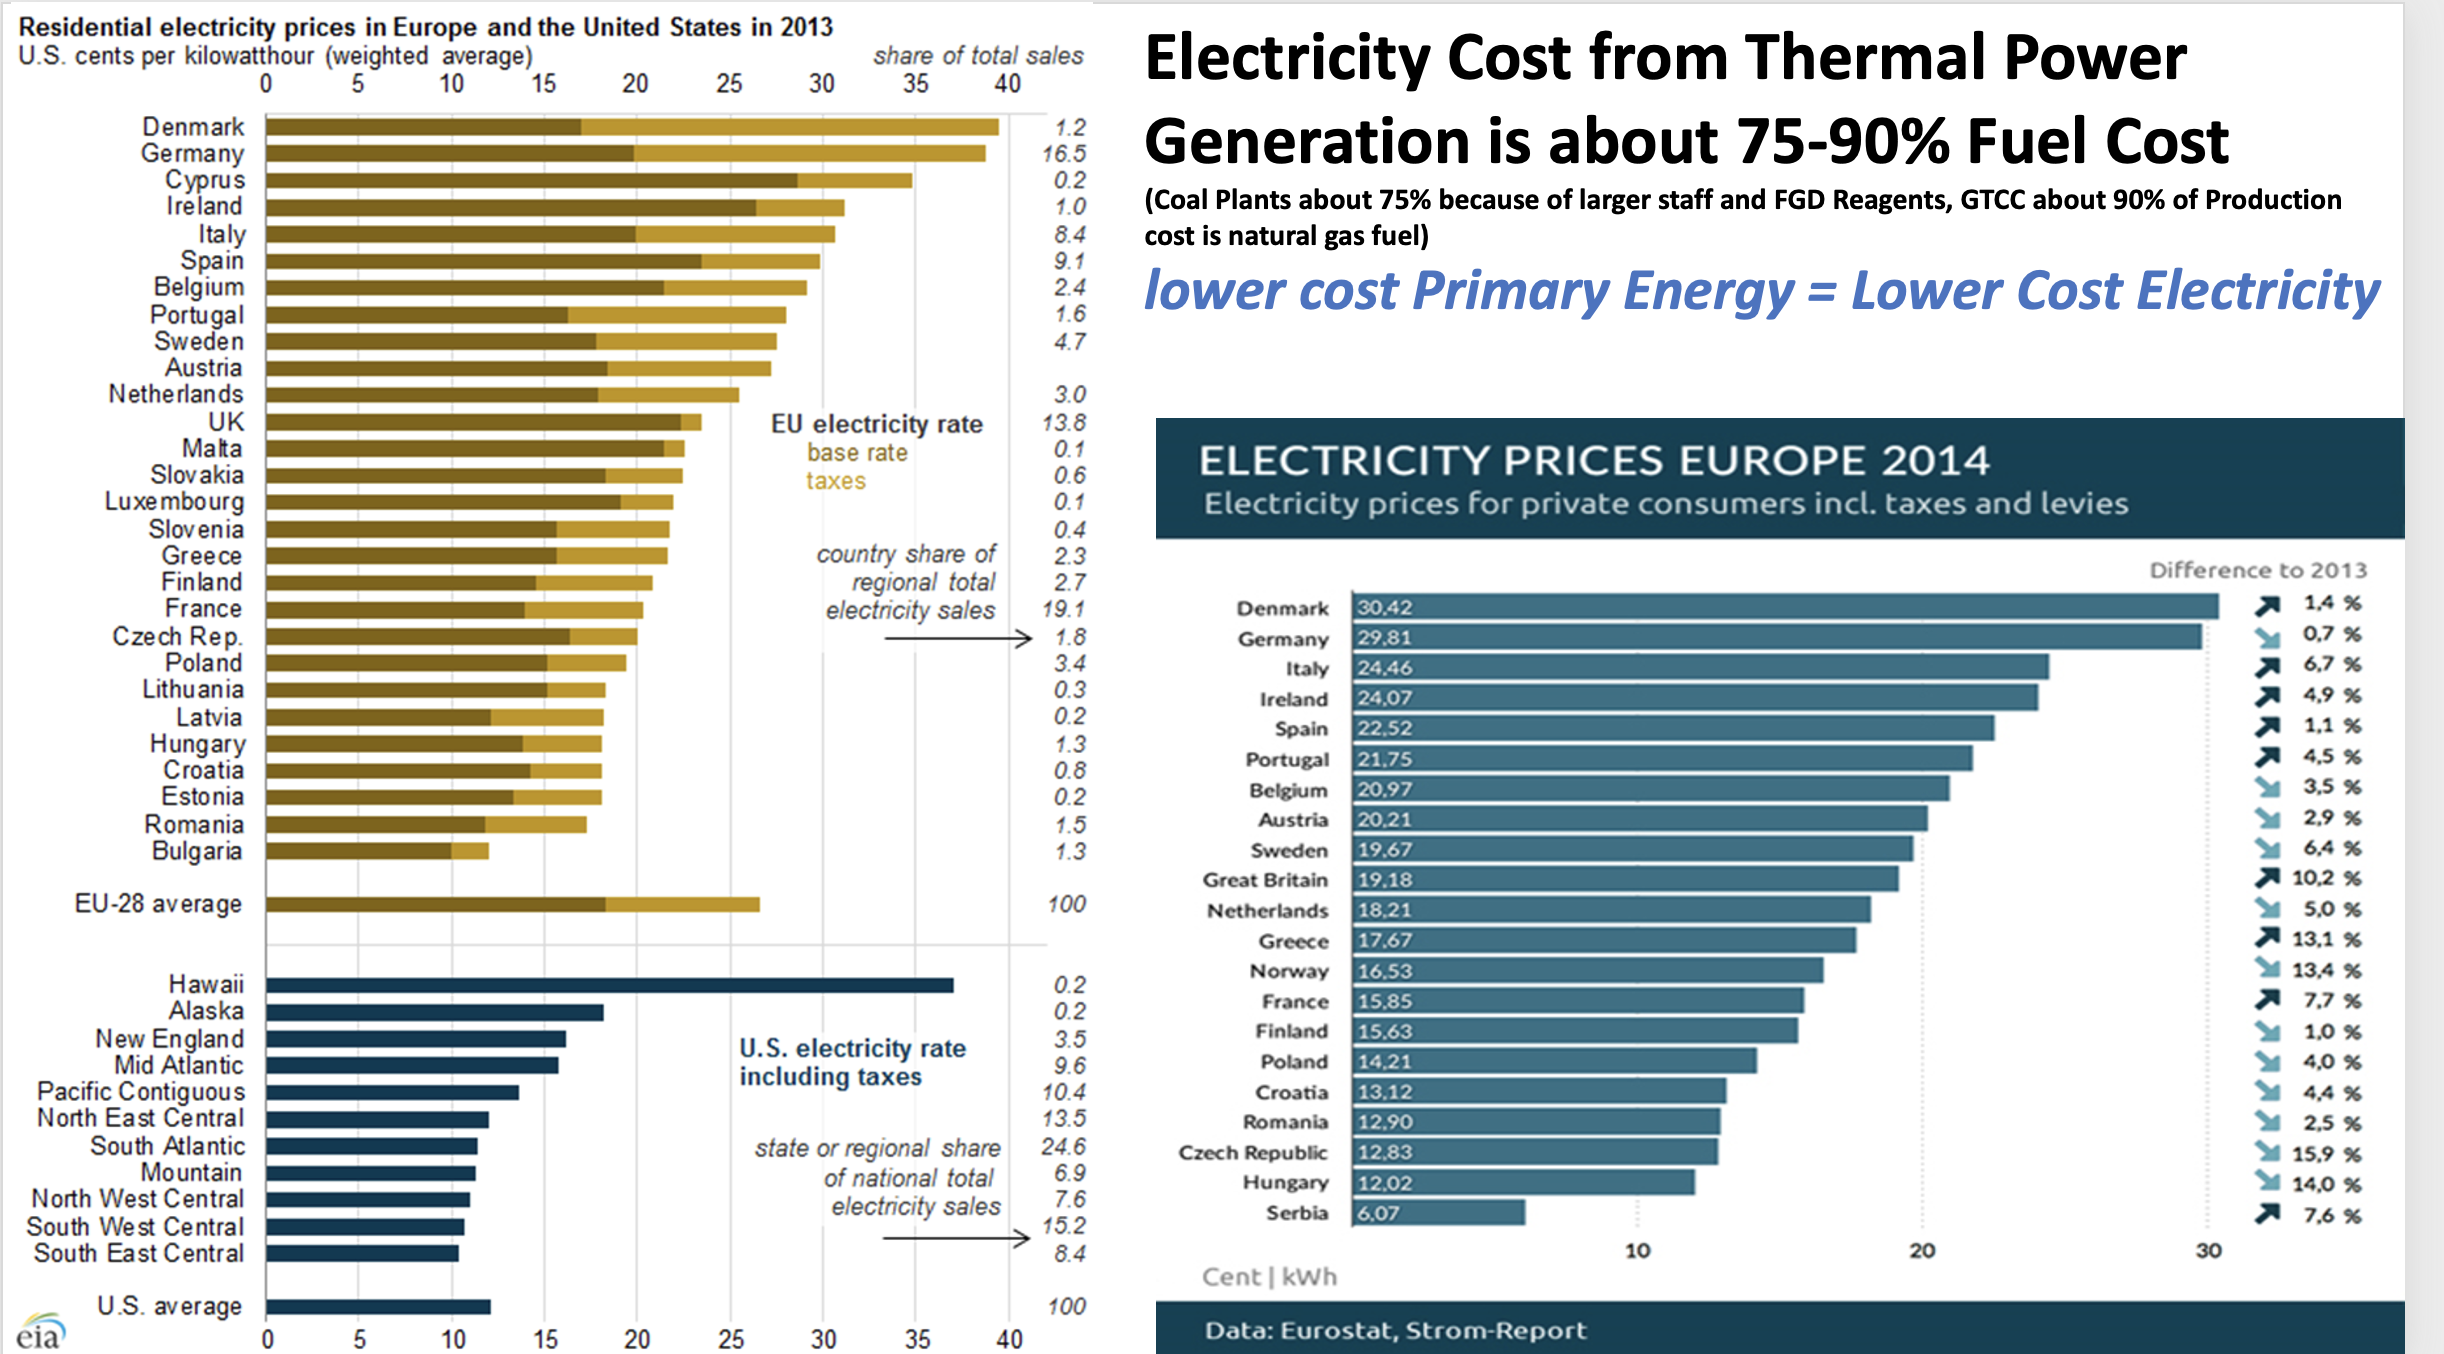
As the War on Coal progressed, the public was insulated from electricity price rises due to enormous natural gas productivity and falling natural gas prices. The graph below shows the path of natural gas prices/million BTU’s from 2006-2012. Ultimately, gas prices dropped to levels below coal prices on a $/million Btu basis. This illustration was used for a training class I was involved with in 2012 to a coal plant staff to emphasize why excellence in O & M and best Heat-Rate operations were important for competitive power generation from coal. At the time, natural gas fueled power generation had suddenly became less expensive than coal. This is because in a Thermal-Power Plant, most of the electricity generation cost is for fuel. In GTCC (Gas Turbine Combined Cycle) plants the fuel cost component is about 90% of the production cost of electricity. Thus, doubling fuel cost/million Btu’s by itself nearly doubles the production cost of electricity. Conversely, halving the fuel cost nearly halves the production cost for electricity generation.

Also during this time Gas Turbine Combined Cycle Plant technology had improved to approach 65% Thermal Efficiency. The most efficient Heat-Engines in History. Thus, it appeared between 2010 and 2020 that America could wage war on carbon and enjoy economic prosperity including the lowest electricity costs in the world.  We also had the largest drop in Carbon Dioxide emissions in the world. A 52% drop.

The following charts will illustrate the path from 2005 forward of reducing carbon emissions and keeping electricity prices reasonable.

First, fuel changes from coal to natural gas created drastic COemissions, because natural gas generated electricity produces about 50% of the COthat coal fueled plants do. 

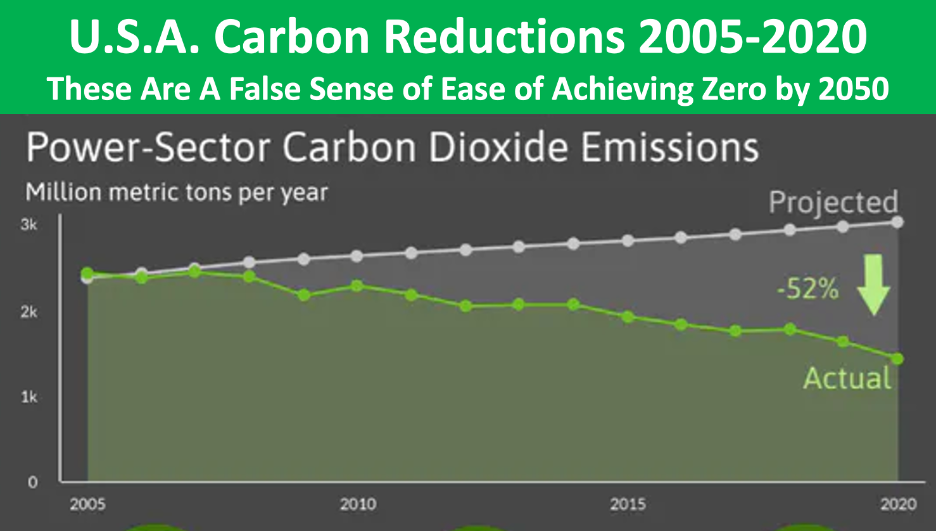
Because electricity produced by natural gas creates about half the carbon dioxide as coal generated electricity, the first 50% reduction in Greenhouse Gases was painless. Low natural gas cost (Thanks to the Shale Gas Revolution) plus high efficiency GTCC plants provided this huge first step.

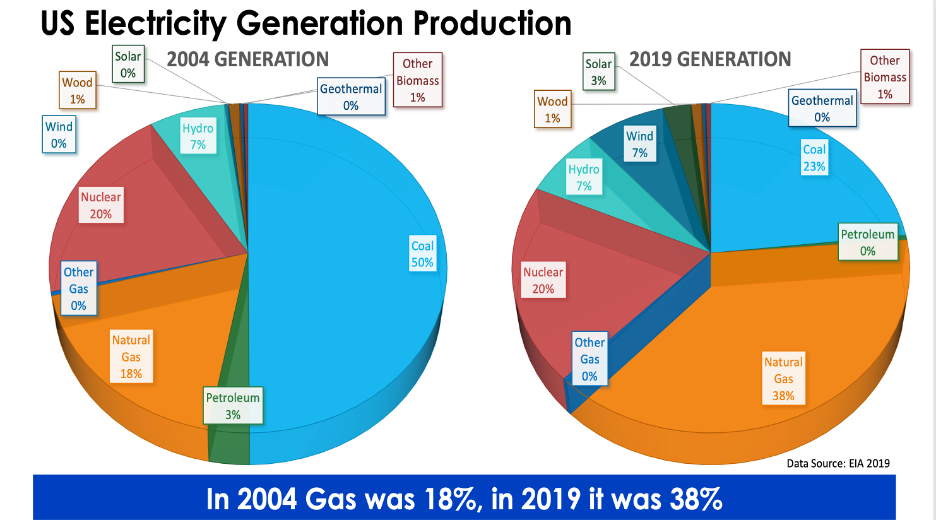
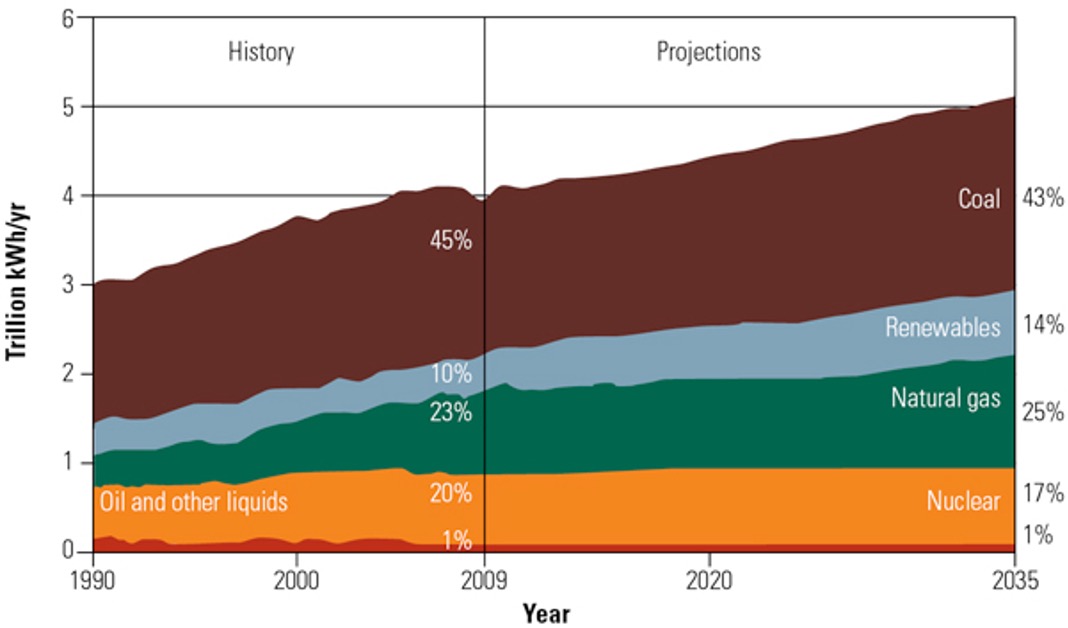
The increase in natural gas power production replaced coal power production. Together, coal, gas and nuclear still provide over 80% of our electricity. The chart above is 2004-2019. The one below is the actual (Dispatchable too!) generation across the U.S.A. in September-October of 2021:

The two pie charts of generation by Fuel (below) are from the Midwest Independent System Operator (MISOEnergy.com) and the PJM Interconnection (PJM.com) for January 26, 2022. Note the importance of coal power generation. Again, coal, nuclear and natural gas are providing over 80% of our nation’s electricity generation when it is most needed. Many of the coal plants providing this power are planed to be shut down in the next few years. They will be missed. Note reference(17) below, list of coal plants to be retired in the next few years.

AMERICA ACHIEVES ENERGY INDEPENDENCE IN 2019

US Department of Energy, EIA

The U.S. Supply Chain for Manufacturing Fossil Power Systems Equipment

Besides the importance of reliable, reasonable cost electricity, there is the Supply-Chain which we should all be concerned about.

The Supply Chain of Coal Plant Components includes thousands of tons of components. Once manufactured solely in the U.S.A., these components provided hundreds of thousands of jobs. For example, when I worked for B&W in 1969, B&W employed over 35,000 employees. Combustion-Engineering also employed over 35,000 employees. General Electric and Westinghouse Electric back then employed hundreds of thousands of employees. America was the world’s #1 manufacturer and this served our country very well. Take a look at the illustrations below of major coal plant components during construction.

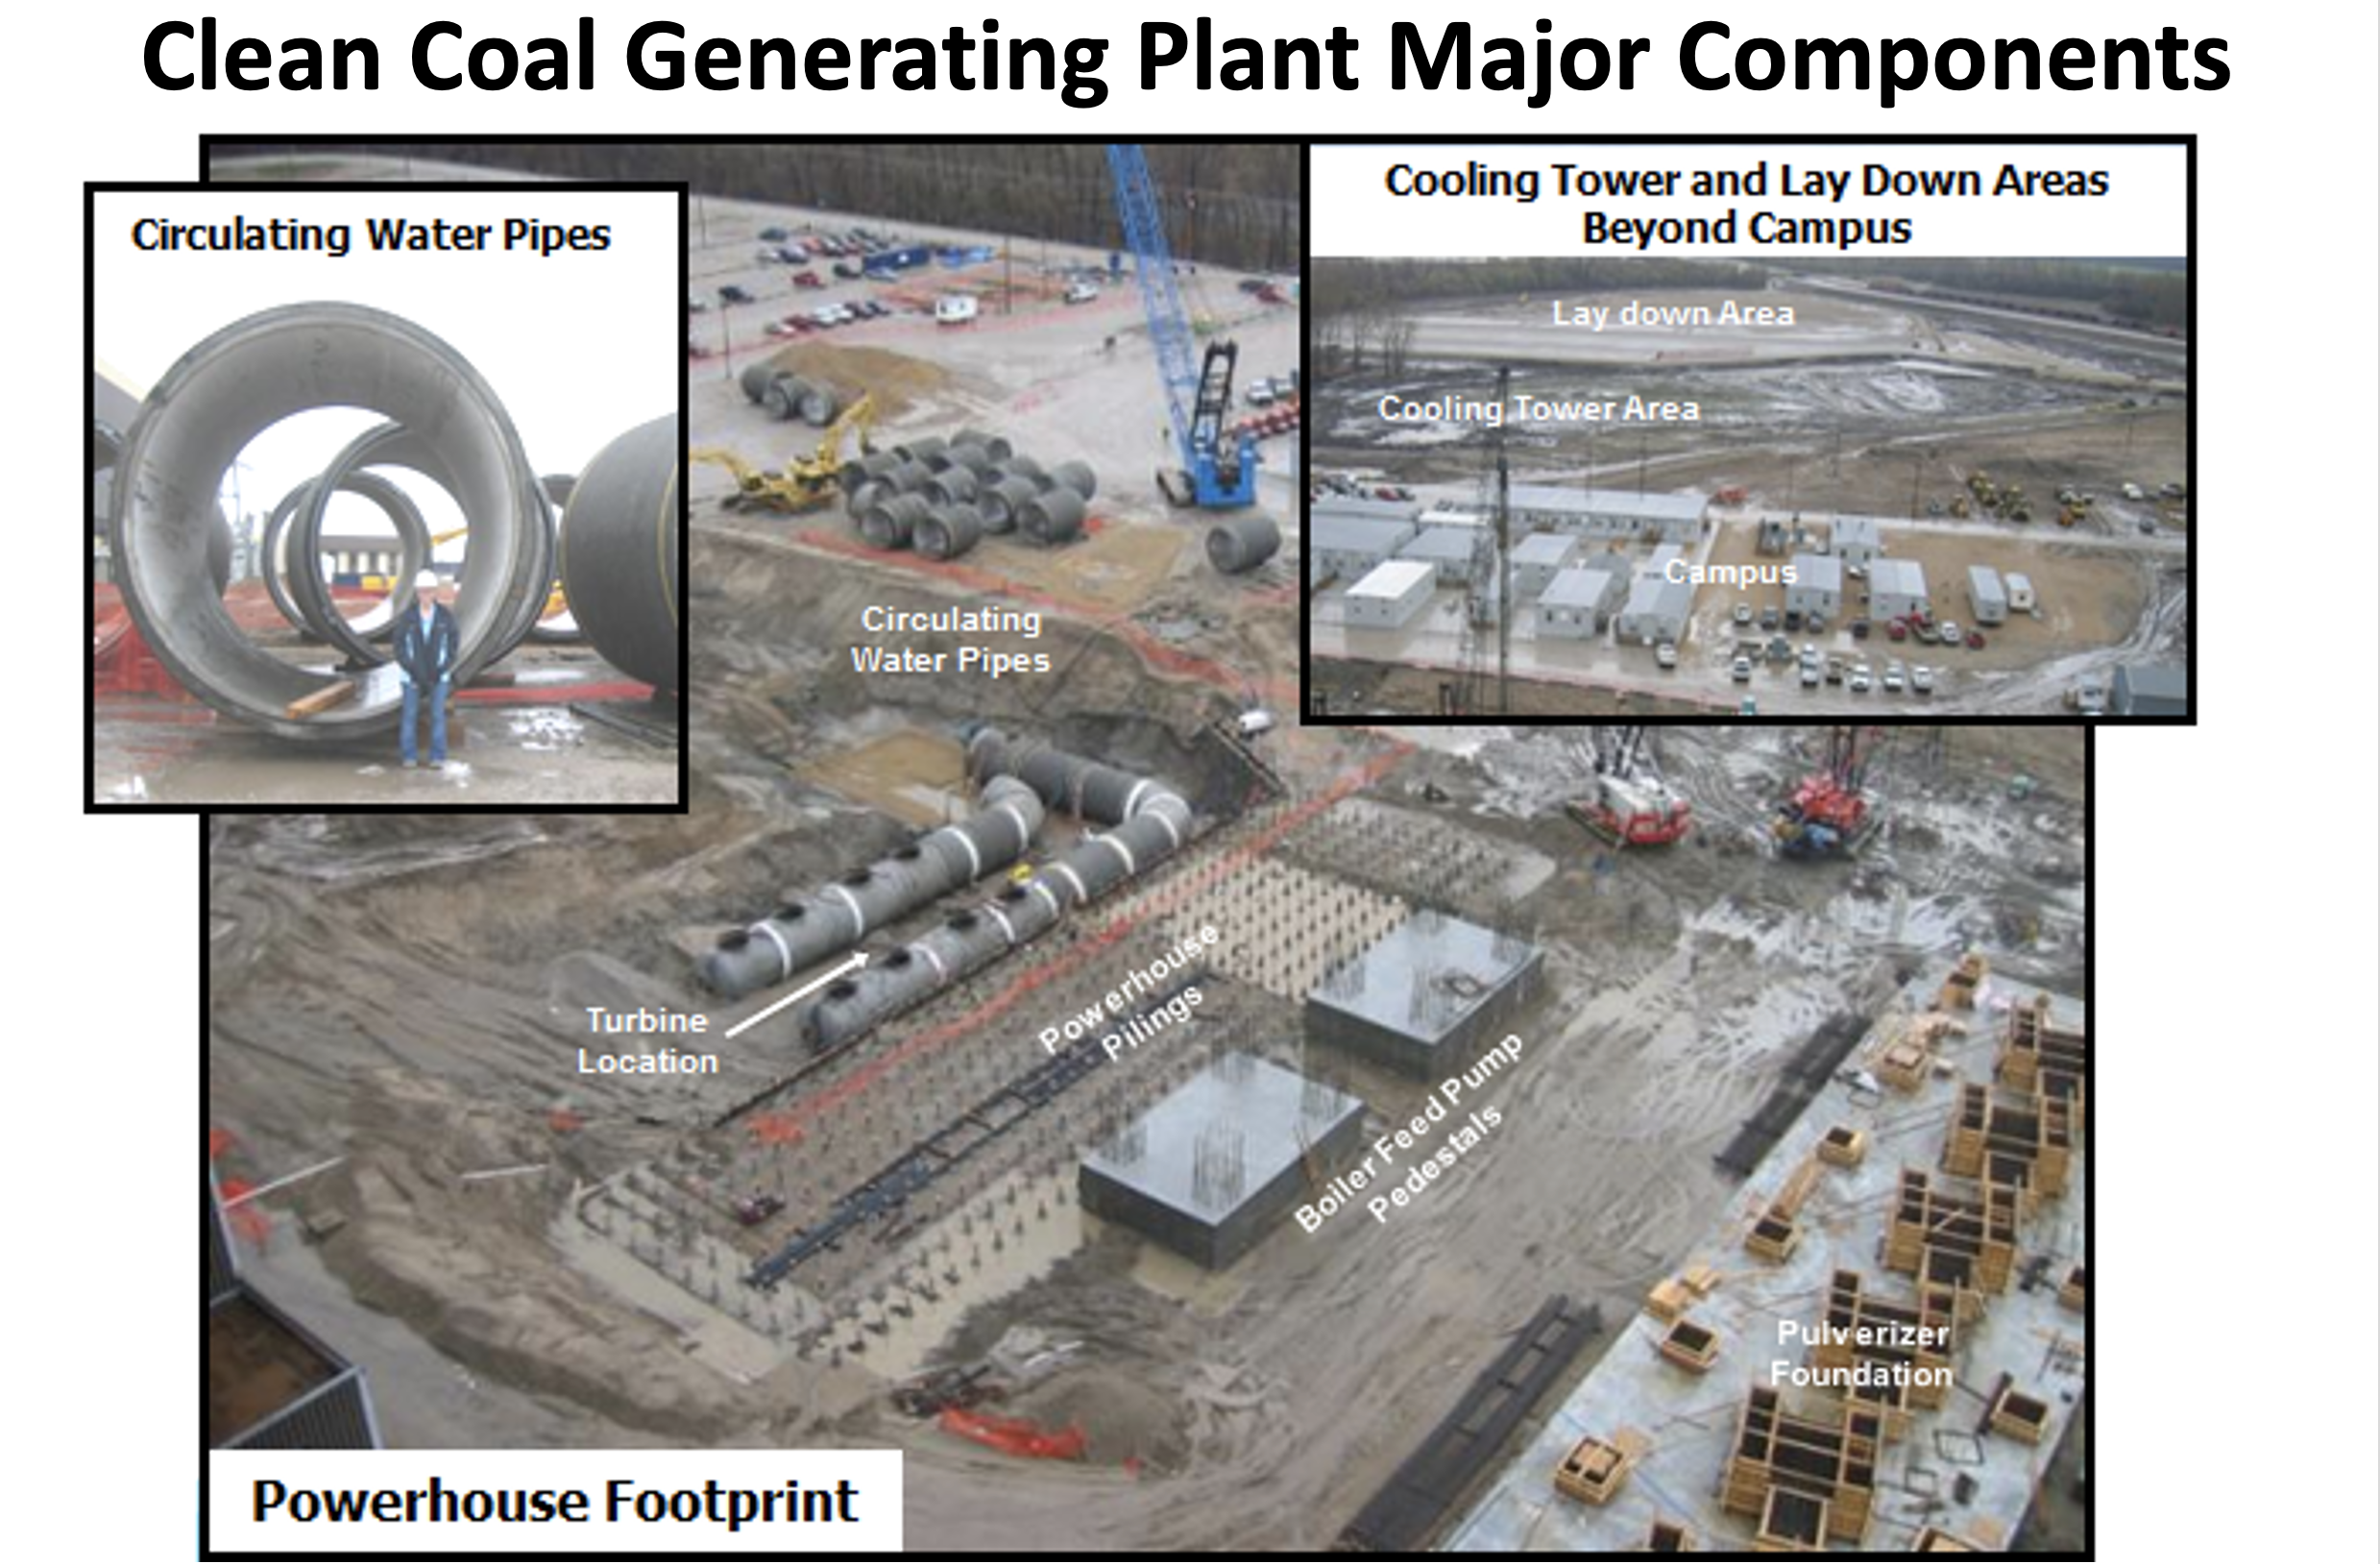
A large clean coal plant involves tens of thousands of tons of steel manufacturing, seamless high alloy tubing, high pressure piping, hundreds of miles of copper wire, transformers, steam turbines, large pressure vessel manufacturing, pumps, heat exchangers, motors, generators and many other components. Manufacturing of these components involves hundreds of thousands of jobs for skilled engineers, technicians and craftsmen. The Supply-Chain is very large and spreads all across the U.S.A. Here below is a list of the suppliers to the Turk Plant. This is from the POWER Magazine article.

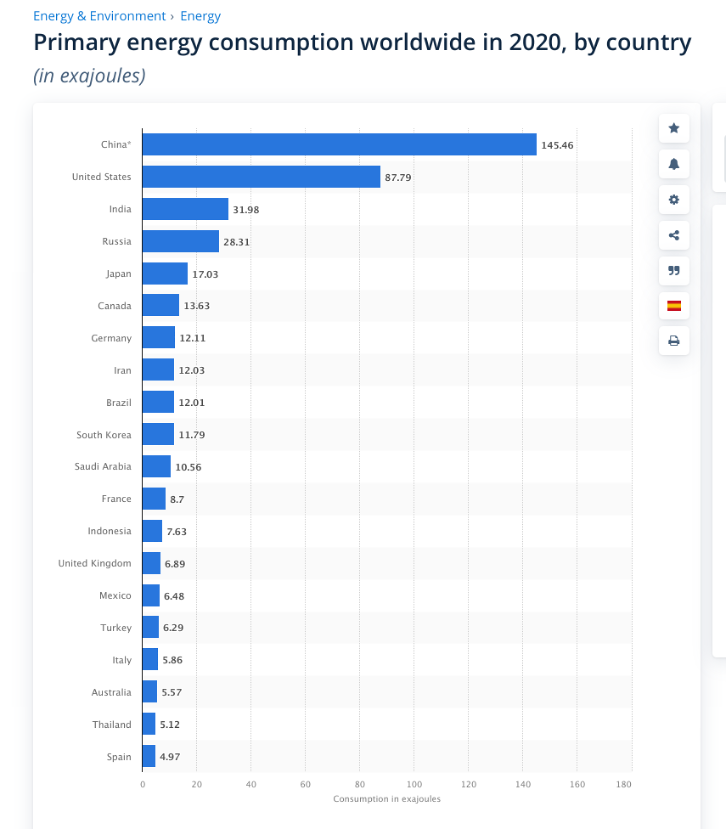
We stopped building large coal plants about 2014. With that comes a withering and loss of our productive manufacturing capacity. Recently, our Supply-Chain woes have been in the news. My friends ask me, How could we invent computer chips and then lose the capability to produce them here in the U.S.? How about steel tubing, steel shapes, aluminum, Rare Earth minerals and EV components? Pharmaceuticals? Where do most of these come from now? Most, come from China. China is the World’s largest manufacturer, so it seems reasonable to accept the published data that shows China using more energy than any other country.

China Energy Consumption, compared to the Rest of the World

From BP Statistical Review

Meanwhile, China is Getting a Lot of Practice in Building Large Coal Power Plants, All of the Equipment Involved and Many Other Products…..

Pakistan Power Plant, Financed and Built by China
From LinkedIn Post by Mike Caravaggio

Boston University has a web site that tracks China Coal Plants:

Closing Summary

In my life-time I saw America as the top Industrialized Country of the world. We shared our wealth and technologies with other countries in good faith. Then for whatever reasons, the people of great influence, mostly from the American Democrat Party, sought to weaken our productive capacity and to cede that capacity to the Chinese Communist Party. The Mainstream News, Entertainment and most Democrats have all been part of this transfer of productive capacity and with that productive capacity comes influence in the world.

It is my hope that sometime soon, our President and Congress will wake up and see the importance of energy to power our economy. The U.S. Senate Report, “Europe’s Energy Crisis, A Warning to America” should be read by all elected officials.(15) The other references below are also informative.

Dick Storm, January 30, 2022

References:

  1. How Carbon Dioxide Became a Pollutant, April 18, 2009, WSJ : https://www.wsj.com/articles/SB124001537515830975
  2. COP-26 Climate Conference article, Oct. 30, 2021, WSJ : https://www.wsj.com/articles/cop26-climate-summit-consensus-is-sought-after-decades-of-false-starts-11635598801?cx_testId=3&cx_testVariant=cx_2&cx_artPos=5&mod=WTRN#cxrecs_s
  3. John W. Turk Power Plant wins POWER Magazines highest honor for clean coal: https://www.powermag.com/aeps-john-w-turk-jr-power-plant-earns-powers-highest-honor/
  4. Longview, Rehabilitated Coal Power Plant Most Efficient in U.S. POWER Magazine, August 2016: https://www.powermag.com/longview-power-plant-rehabilitation-results-efficient-u-s-coal-plant/ https://www.powermag.com/longview-power-plant-rehabilitation-results-efficient-u-s-coal-plant/   
  5. China to Build 43 new coal plants, “Time” August 2021: https://time.com/6090732/china-coal-power-plants-emissions/
  6. China could build more coal plants even after Xi promises not to, Bloomberg Oct 2021: https://www.bloomberg.com/news/articles/2021-10-27/climate-cop26-china-could-build-new-coal-plants-overseas-even-after-xi-pledge  
  7. China’s Coal Plant Capacity More than 3 X the Rest of the World’s, Reuters, Feb 2021China’s new coal power plant capacity in 2020 more than three times rest of world’s: study:https://www.reuters.com/article/us-china-coal/chinas-new-coal-power-plant-capacity-in-2020-more-than-three-times-rest-of-worlds-study-idUSKBN2A308U
  8. Hassyan Power Plant in Dubai: https://www.nsenergybusiness.com/projects/hassyan-coal-fired-power-plant-dubai/
  9. Hassyan Power Plant ACWA Power web page: https://acwapower.com/en/projects/hassyan-ipp/
  10. China Warming, Tablet Magazine by Richard Lindzen, October 19, 2021: https://www.tabletmag.com/sections/science/articles/china-warming-richard-lindzen
  11. EPA Progress in Cleaning our Air: https://gispub.epa.gov/air/trendsreport/2019/#growth_w_cleaner_air
  12. Mid America Independent System Operations, MISO Energy: https://www.misoenergy.org
  13. PJM Interconnection, Independent System Dispatch of Electric Power for much of the Northeast and west to Chicago: https://www.pjm.com
  14. Boston University Global Development Policy Center: https://www.bu.edu/cgp/
  15. U.S. Senate Energy and Natural Resources Committee Report; “Europe’s Energy Crisis, A Warning to America”: https://www.energy.senate.gov/services/files/2D862C16-4157-4A39-9CCE-098B5C818C01?mc_cid=d94787db9d&mc_eid=9e46528ac6
  16. Donn Dears Book, “NET-ZERO CARBON, The CLIMATE POLICY DESTROYING” AMERICA:  https://amzn.to/31j7vMh  
  17. Reuters, List of Coal Plants Scheduled to be shut down: https://www.reuters.com/business/energy/us-coal-fired-power-plants-scheduled-shut-2021-10-28/
  18. Steven E. Koonin, “Unsettled, WHAT CLIMATE SCIENCE TELLS US,WHAT IT DOESN’T, ANDWHY IT MATTERS” 2021, BenBella Books, Inc.

History of Energy and Electricity Generation Part 2: The Golden Age of Nuclear, Once Proclaimed to be “Too Cheap to Meter” 1955-2010

The purpose of this post is to show the progress of creating America’s huge Grid, made up of Dispatchable Power from coal, nuclear, gas and oil fuels from 1955 through 2010. Also during this time, the EPA came to be and began regulating true pollutants from power generation facilities. America’s designers, engineers and manufacturers of electric generating equipment rose to meet the challenge and provided energy to expand the American economy while at the same time cleaned our air. Nuclear Power grew to be about 20% of our total electricity generation during this 55 years. These years were special for me, because they include my becoming interested in power generation in 1959 as a Freshman at Williamson and then joining the B&W Nuclear and Special Projects Group in the 1960’s when nuclear was believed to be the future of electricity generation.

The First Pressurized Water Reactor, Nuclear Steam System

It was 1954 and the Nautilus, the first Nuclear submarine ever built was launched. The pressurized water nuclear steam system was a prototype for future Navy as well as commercial applications.

USS Nautilus, First Nuclear Powered Submarine, Launched January 1954
From Babcock & Wilcox, “Steam, It’s Generation and Use” 41st Edition

“President Dwight D. Eisenhower was determined to solve “the fearful atomic dilemma” by finding some way by which “the miraculous inventiveness of man” would not be dedicated to his death, but consecrated to his life. In his “Atoms for Peace” speech before the United Nations General Assembly on December 8, 1953, President Eisenhower sought to solve this terrible problem by suggesting a means to transform the atom from a scourge into a benefit for mankind. Although not as well-known as his warning about the “military industrial complex,” voiced later in his farewell radio and television address to the American people, President Eisenhower’s Atoms for Peace speech embodied his most important nuclear initiative as President”. (2)

The Research and Development into peaceful use of atomic energy continued on “Atoms for Peace”. The partnership of the U.S. Atomic Energy Commission and the brilliant minds of employees from the American companies; Westinghouse Electric, General-Electric, Babcock & Wilcox, Combustion Engineering, Allis-Chalmers and other fine U.S. companies brought enormous advancements. In just a few years there was great progress in atomic physics, nuclear safety, ASME Codes for Pressure Vessel Design, Welding, Non-Destructive testing of welded joints and material science. The future of nuclear power looked extremely bright. 

So did efficient coal power generation. I love this advertisement (below) for B&W, then a Fortune 500 company (#134 in 1960) and builder of many of the U.S. Navy’s Boilers that helped win two world wars. B&W also built the pressure vessels for the reactors and steam generators used in the Nautilus and many of the commercial nuclear steam systems to follow. Including Duke Energy’s highly successful three Unit Oconee Station which the first unit began commercial operation in 1973.

Nuclear Steam Systems were a logical extension for B&W and Combustion Engineering Company to move into after many decades of building Fossil Steam Systems. I have referred to the importance of Heat-Engines often during my career. Perhaps that is from recollections of working for B&W in the 1960’s. Below is a copy of a B&W ad from 1954:

Part 2 of the History of Energy and Electricity Generation from my viewpoint. Taken from my course at USCB-OLLI
Copy of advertisement in Fortune Magazine about 1954

In 1954 and the chairman of the Atomic Energy Commission Lewis Strauss in his extreme enthusiasm for commercial nuclear power generation, coined the phrase….”Too Cheap to Meter”…..That was in 1954 and of course there was a building boom of nuclear power plants from 1960 to 1990. Over 100 nuclear steam systems were put into operation between 1970 and 1990. Here are the 93 that are still operating:

From Nuclear Regulatory Commission (NRC) website January 2022

Yes, Nuclear Power has been a very good invention for America. Although thousands of employees made nuclear steam systems possible, the primary credit for this gift to Humankind should go to one man, Admiral Hyman G. Rickover, Father of the U.S. Navy Nuclear Fleet and Father of Commercial Nuclear Steam Systems.(8)

From Dick Storm Presentation of Energy and Electricity, USCB-OLLI 2021
Turkey Point Unit 3 Nuclear Unit at Florida Power and Light Company went Commercial 1972 https://world-nuclear-news.org/Articles/Turkey-Point-licensed-for-80-years-of-operation

The combination of new nuclear units plus ever more efficient and clean coal plants created electric growth with electricity costs amongst the lowest in the world.

This was good for world manufacturing competitiveness (especially good for energy intensive industries such as aluminum and steel manufacture) also good for reasonable household electric costs to power ever increasing labor saving household appliances.

Speaking of reasonable household electric costs and high quality of living. These ads for “Living Better Electrically” were common in the 1950’s to 70’s.

From Dick Storm, ASME Annual Meeting Presentation 2011, “Why Coal is Important

My state of South Carolina continues to enjoy reassonable cost, abundant and reliable power from Admiral Rickover’s invention. According to the EIA and NEI, over 55% of SC electricity is generated from nuclear power. I might add, these are “old nuclear plants” that have been well maintained, well run, proven and reliable. Several of these were started up in the 1970’s like Turkey Point and may have their licenses extended for 80 years. Amazingly robust and well built.

Top States for nuclear power generation in 2020 by NEI and EIA, Slide used in Dick Storm USCB-OLLI Course, 2021

The chart below is from the NRC website. As mentioned above, many of the very reliable and I might add, Dispatchable power generating nuclear power plants are aging and before they are shut down, it would be wise to plan, design and begin construction on the next generation of nuclear plants. Renewables such as wind and solar are not Dispatchable and electric battery storage is not yet feasible. These issues will be discussed in a future post. Suffice it to say for the time period 1950-1990 America had four very good decades of power generation advancements which resulted in an extremely reliable Grid providing some of the lowest cost electricity in the world.

From NRC Website

Energy, Economic Prosperity and Living with a High Human Development Index

The 1970’s and 1980’s saw clean coal and nuclear power together, provided about 70% of our electricity. America’s GDP pretty much followed the production and consumption of coal fuel. Coal and nuclear at the time were the most reasonable cost fuels to generate electricity.

From Dick Storm Presentation to ASME Annual Meeting 2011,, “Why Coal is Important”, Dallas, TX

The U.S.A. has used about 100 Quadrillion Btu’s annually for many years. Below is a copy of the EIA Total Energy Use by Fuels from 2008. This is getting ahead of 1990 but for reference, the Total Energy Use of America has held very close to 100 Quadrillion Btu’s per year for many years. The chart below shows consumption of 94.58 Quadrillion Btu’s in 2008. This reduction in energy demand was the result of the Financial crisis of 2008.

As we move forward keep this in mind. From 1950-1990 the fuel mix was changing. Thsese changes had to do with cost of fuel, pollution and availability. But for the last two decades America has used a total of about 100 Quadrillion Btu’s +/- 10 per year. This includes electricity, transportation, Industrial production, heating, and cooling. The chart reads from left to right with the fuel sources on the left and energy flows to the right.

From Dick Storm ASME Presentation, 2011, Why Coal is Important

The 1970’s Were Good Years of Progress…. But Not Perfect

The EPA (Environmental Protection Agency) began in 1970 under the Nixon Administration. Amongst the first pollutants to be regulated, was sulphur and particulate emissions. The trend of the six major pollutants has been downward every since 1970.

The six major pollutants that were significantly reduced during this time period are: Particulates, Sulfur, Carbon Monoxide, Lead, Ground level Ozone & Oxides of Nitrogen.

The first steps the EPA took to regulate a path for cleaner air was to regulate particulates and sulfur. Some electric Utilities immediately (1970-71) switched from coal fuel firing in their boilers to oil fuel. This was when the fuel cost/million Btu’s of oil and coal were about the same, in 1972 that was about $0.50/million Btu. By switching to oil the switchover downtime was reduced and huge Capital cost of Electrostatic Precipitators avoided. I was working at Carolina Power and Light at that time and remember these times well.

The Neighboring Utility in Virginia, then (1973) VEPCO had switched much of it’s generation to oil fuel, so did Potomac Electric (PEPCO) and Philadelphia Electric and others to the north. They were dependent on the (at that time) reasonable cost, easier to control emissions oil fuel. Well, that was fine until the first Arab Oil Embargo in October 1973.

Arab Oil Embargo, 1973

I was a senior engineer working at Carolina Power and Light Compay’s Roxboro Generating Station. My job was a startup and test engineer for the coal fueled 720 MW, Unit #3 which began commercial operation during the summer. Many mechanical problems were needing to be sorted out and I had job security for the next several years.

The Arab Oil Embargo lasted about a year, 1973-74 and during this time, many Utilities purchased new coal generation capacity. Especially in the southern states where air-conditioning load in the summer and heat-pump load of the winter was growing rapidly. I remember year over year growth in the range of 10% increase in electric demand. Of course, manufacturing was strong back then too.

As time went on in the 1970’s more coal plants and more nuclear plants were started up. The future of clean, reliable Nuclear power looked great until……

Three Mile Island, 1979

The future of nuclear power had a serious setback in March 1979. Although no one was injured, this was pretty much the end of new nuclear steam system orders for U.S. Utilities. It took more than another decade to complete the 100 + nuclear steam systems that were on order. More strict Regulations by the NRC and more built in safety requirements ensured that nuclear power would not be “Too Cheap to Meter” in the U.S.A.

New Clean Coal Plants are Built

To meet the increasing Electricity Demand, and do so with Domestically sourced fuel, more large coal plants were built in the 1980’s. These however were nearly all equipped with Flue Gas Desulfurization and Particulate controls. Later in 1991 the EPA Clean Air Amendment was made into law and Oxides of Nitrogen were significantly reduced and more FGD equipment began being retrofitted on existing large coal plants that did not have FGD. Thus, the ever cleaner air as shown in the foregoing chart. Yes, the EPA was needed in 1970 and the Clean Air Ammendment of 1991 also has turned out to be beneficial.

EIA DATA, 2009 The Projection did not expect the Shale Gas Revolution

How The Public Perception of Coal Becomes Tarnished

During the Arab Oil Embargo not only did we have gasoline shortages and gas lines. But the electric Utilities also suffered financially due to the rapid increase in oil costs and with the ramp up in oil costs, so did the price of competitive fuels such as gas and coal. During this time of financial stress, the Utilities drastically reduced Operation and Maintenance Budgets. What was cut first? Tree trimming around high voltage transmission line, painting and maintenance costs such as these. These are expected during volatile times in business and can be recovered from.

The Worst Budget Cut

The worst budget cut, in my view, was the cutting of public education of “Living Better Electrically” and “Better Things for Better Living”. Back in the 1970’s there were Utility representatives that invested time in Public Schools to teach the girls about electric appliances and how to use them. The boy students learned how electricity was generated from coal, oil, gas and hydro-electric sources. There was advertizing on the radio and TV. Remember “Reddy Kilowatt”? Reddy Kilowatt was the lightening bolt stick figure mascot for the investor owned Electric Utilities. Between Reddy Kilowatt and a small army of Home Economics teachers from the Electric Utilities, American Citizens learned the importance of electricity and how it was generated. I personally remember learning that as a teenager in the 1950’s, and I was just an average student.

Reddy Kilowatt, The Mascot of The Investor Owned Electric Utilities Circa 1970

I gave a presentation to the American Coal Council membership in 2008 on how, in my view, the public perception of coal changed. Here below is the illustration that I used to show the change from pro-active Utility education of the Public to the taking over of this effort by the Environmental Movement. Believe me, I support clean air and clean water as much as anyone. In fact, I worked much of my career exerting my best efforts to reduce particulates, reduce NOx and improve efficiency of power plants. However, the Environmental Extremists took over shaping the Public’s Perception of coal following the Arab Oil Embargo and filling the void of public education left by the exit (regarding public education) of the Electric Utilities. Not all, but most Utilities management were enthusiastic about exiting the Public Schools and Public Education just as many that ran bus services were quick to exit that business as soon as the Regulators would allow them to quit. The chart below illustrates the enormous funding of the leftist Green organizations after 1970. The green groups funding helped to indoctrinate or shape public views against coal and carbon. Now the Green Extremist organizations literally have far more money to spend on public indoctrination than the private sector manufacturers. But, that is a topic for another day.

All Fuels are Important

The Total Energy Flows of the year 2007 are shown on the Sankey Diagram below. This is TOTAL Energy which includes Electricity, Industrial, Transportation, Commercial and Residential uses of energy. The changes of the percentages of each fuel change with the economics of producing the fuels. Such as discussed above when the Arab Oil Embargo of 1973-74 caused oil prices to rise sharply in 1974 and many power generation plants were switched back to coal from oil. We should keep this in mind as the government pushes us toward Electric Vehicles in the future. In my view, we will need over 100 Quadrillion Btu’s annually to support our high quality of life. So, as electricity is substituted for gasoline or Diesel fuel, more electricity generation will be required which more than likely will come from conventional sources of gas, nuclear, coal & hydro-electric. The chart below is 2007. In part 3 I will include more recent Sankey Diagrams of Total Energy Flows.

This will conclude Part 2 of this series on the History of Energy and Electricity Generation in the U.S.A. The next section will cover 2005-2022.

Conclusions:

  1. Projections into the future are simply, projections. We can learn from our recent energy history of nuclear being thought to be, “Too Cheap to Meter” and the end of coal just a few years away. In the 1960’s the future of coal was proclaimed Dead….. However during this current cold weather in the U.S. Coal Power is depended on for a large percentage of electricity generation. Just check pjm.com
  2. Likewise, the EIA projection published in 2009 showing an increase in coal going forward did not take into account the Shale Gas Revolution made possible by Directional Drilling and Hydraulic Fracturing. The coal consumption dropped off primarily due to the reduction in cost of the newly abundant Domestic natural gas that became available about 2012. Low natural gas prices were helpful for those opponents of coal fuel.
  3. Reasonable cost energy is required to fuel a thriving Economy. Note the drop in energy use after the 2008 Financial Crisis.
  4. Industrial output is particularly linked to reasonable cost, abundant and reliable energy. Especially primary metals like steel and aluminum.
  5. Net Zero Carbon is a disasterous Policy for the U.S. to follow unless a large number of new generation nuclear plants are deployed in the U.S. generation fleet.
  6. Nuclear, Coal, Gas, Oil, Thermal Biomass and Hydro-Electric are the only Dispatchable sources of electricity generation by today’s technology
  7. Reliable, Abundant, Reasonable cost and Dispatchable electric generation is required for a country to remain or to become competitive in the world with a manufacturing based economy. China has proved this over the last 20 years since joining the WTO
  8. America has burned coal and natural gas more responsibly and cleaner than any other country that uses Fossil Fuels for Bulk Power production in Gigawatt quantities
  9. The Net Zero Carbon Policy is a Disasterous path for our country to follow. We should learn from historical events of the past.
  10. My friend a Tinkerer reminded me of the old phrase, “When Tinkering, it is important to save all of the pieces” This old saying should be remembered by the politicians that are “Tinkering with America’s Energy Policy” and allowing reliable and needed coal plants to be shut down and demolished. This has even occurred with reliable nuclear plants. We should be preserving the power generation infra-structure that powers America’s economy and our life styles.

Dick Storm, January 19, 2022

Author’s note on the background and why I write on this Blog:

I said at the beginning this was a special time for me. Well, it was because my life-time career in power generation began in 1962 after graduation from Williamson. I joined Babcock & Wilcox’s Nuclear and Special Products Division in 1965 and worked as an assistant to the Project Manager for Navy PWR’s and on the Oconee Nuclear Steam System. I did not like the rigorous administrative paperwork required by the AEC at the time and many engineers were transferring into the Nuclear Division from the Fossil Power Generation Division, leaving many vacancies in PGD. So, I arranged a transfer to Results Engineering to work for one of the best Mentors ever, Silas Morse. The “Too Cheap to Meter” phrase regarding nuclear power was well known within the walls of B&W and as a 22 year old newby, I was strongly advised that coal plants will be shut down in a decade because nuclear is so clean, has such an extreme energy density and it is highly productive. I went anyway, vowing to study and learn all I could about coal power so that I could remain employed for my future career. It worked.

My stint at B&W provided travel to large Paper Mills from New England to Missoula, Montana, to run acceptance tests on the largest (then the largest steam plants were about 500 MW) coal and gas plants at Baltimore Gas & Electric, Houston Light & Power, Illinois Power, Ohio Edison and more.

Always wanting to be a startup engineer, in 1969 I left B&W to join Riley Stoker as a senior startup engineer at Tampa Electric’s Unit #6 at Gannon Station. Then off to participate in the startup of Riley’s first and only coal-fueled supercritical units at Wateree Station for SCE&G near Columbia, SC. In between, helped with acceptance testing at Santee-Cooper’s Jeferies coal plant in Monck’s Corner. Then back to Florida to startup new oil fueled units at the City of Lakeland and Jacksonville.

My big opportunity to get involved with a major Utility came in 1972 and I was assigned to be the lead Startup Engineer for the 420 MW dual fueled Sutton Unit #3. Then in January 1973 I joined Carolina Power and Light Company as a Senior Engineer in charge of the startup of the 720 MW Roxboro Unit #3. Great learning experiences including the Arab Oil Embargo and the “Wheeling” of Coal Generated Power from CP&L to Utilities in the north that had switched fuels from coal to oil and then were short on fuel with the oil embargo.

In 1977 I left my position, then as Operations Superintendent at CP&L’s Roxboro Plant, to join a newly formed small contractor, Flame Refractories, in Oakboro, NC. Flame was small, only a dozen or so total employees when I joined. The company grew and I started Flame Technical Servives. Flame grew to be a major Utility Specialty contractor with hundreds of employees. My Technical Services Department eventually grew to an average size of about 20 engineers and technicians and became well known all across the U.S.A. and Internationally. Some of the most interesting International trips began in 1978 when ALCOA hired us to correct some boiler problems at the Suriname Aluminum Company in Suriname, South America. Then later to Guinee in Africa, Jamaica, Spain and Australia.

In 1992 after 15 very interesting and growing years at Flame, I started Storm Engineering later to be folded into Storm Technologies, Inc. We continued solving large electric Utility Boiler problems for the next twenty years that I was President of Storm Technologies. Storm Technologies earned a good reputation for solving difficult coal plant problems and we traveled all around the world to work at plants in South America, Asia, Oceana, Africa, India, the Philippines, Indonesia and of course, all across the U.S.A. and Canada. During these travels is when the relationship of Energy and Economic Prosperity became apparent to me. Where we traveled to help sort out problems in coal plants around the world, there was and remains, a higher quality of life. The UN calls it “Human Development Index”. I saw the affects of reasonable cost, reliable energy on the improving quality of life in Developing countries.

I retired from active involvement at Storm Technologies in 2012 when my son Danny became President.

Since then, I have done my best to give back by teaching the importance of power generation and wise use of resources for power generation. I was on the Williamson College of the Trades Board until 2019 where I championed the modernization and upgrades to the Energy Island used for power generation and instructional purposes at the College. Also, have volunteered to teach courses on Energy and Electricity Generation at schools and Colleges. The genisis of this post and others on my Blog are from slides used at the USCB-OLLI courses I have presented here on Hilton Head Island.

One of the biggest problems our country has is a misunderstanding of energy and electricity generation. The current path to Net Zero Carbon is a very hamful path for America because Renewables are not capable of replacing the large, reliable and proven coal, gas and nuclear plants that power our country. Therefore, I continue to do my best to Educate the public on the true facts regarding energy and electricity generation.

Thank you for taking time to read this. Your comments are welcomed.

Yours truly,

Dick Storm, January 20, 2022

References:

  1. Nuclear Regulatory Commission, “Too Cheap to Meter” Phrase history: https://www.nrc.gov/reading-rm/basic-ref/students/history-101/too-cheap-to-meter.html
  2. Eisenhower Atoms for Peace Speech to UN, Dec. 8th, 1953: https://www.eisenhowerlibrary.gov/research/online-documents/atoms-peace
  3. The History of Nuclear Energy in the U.S. by the Department of Energy: https://www.energy.gov/sites/prod/files/The%20History%20of%20Nuclear%20Energy_0.pdf
  4.  World Nuclear.org  Article on Nuclear Power Plants in U.S.A: https://www.world-nuclear.org/information-library/country-profiles/countries-t-z/usa-nuclear-power.aspx
  5. List of U.S. Operating Nuclear Plants: https://www.world-nuclear.org/information-library/country-profiles/countries-t-z/appendices/nuclear-power-in-the-usa-appendix-1-us-operating-n.aspx
  6. Nuclear Energy Institute: https://nei.org/home
  7. NEI Nuclear Plants by the numbers: https://nei.org/resources/fact-sheets/nuclear-by-the-numbers
  8. “The Rickover Effect, How One Man Made a Difference” by Theodore Rockwell, 1992, 2002, Originally published by the Naval Institute Press
  9. Turkey Point Nuclear Plant Licensed for 80 years: https://world-nuclear-news.org/Articles/Turkey-Point-licensed-for-80-years-of-operation
  10. World Nuclear Report on Three Mile Island Accident in 1979 : https://www.world-nuclear.org/information-library/safety-and-security/safety-of-plants/three-mile-island-accident.aspx

A Short History of Energy & Electricity and How Our High Quality of Living Came to Be (High Human Development Index) Part 1, 1850-1955

Energy and electricity have fascinated me ever since I was a teenager. The purpose of this post is to share the progress of energy and electricity from the Industrial Revolution to today. I had the honor of presenting a course at USCB-OLLI (Osher Lifelong Learning Institute) and much of the information presented in that course is presented here.

After presenting the course on energy and electricity generation in February (2021), it occurred to me that it may be interesting for some OLLI members to review of how energy and electricity came to be so important in the lives of all of us. Especially the aspects of Industrial growth, manufacturing and economic prosperity. As I was preparing for the course, the relationship of energy and economic growth became very clear to me. I always thought the relationship of Energy and economic growth was important. Nearly all of the College Professors of Engineering and History simply cover the History of Electricity production or the History of Energy. Few that I have known connect the inter-relationship of Energy and the growth of the “Human Development Index”. If we couple progress in energy production with economic progress, I think it is worth sharing because the application of energy to food production, transportation and industrial output grew geometrically from 1900 to today. Many factors contributed to the sharp rise of America’s HDI (Human Development Index) and manufacturing capacity after the year 1900, but in my view, the importance of abundant and reasonable cost energy has not been taught in Public Education or appreciated by the News Media. So, here is my shot at connecting the dots of the advances in energy and economic prosperity. 

I have always loved thermal power plants and spent five decades working in the electric power generation business. Mostly as a “Boiler Engineer”. Over my career I have accumulated a library of old books and technical literature on power generation and most of the illustrations used are from my library. 

Let’s start with the importance of “Steam”. We do not hear many references to steam today, but Steam remains important in power generation today and is likely to remain important in the future as well. 

So, let’s start with the first steam engines and take a quick trip through the ages of energy and power generation to see how humans have harnessed energy to do our hard tasks and improve our lives.

James Watt is usually given credit for the first commercially applied steam engine of the Industrial Revolution. But, to be fair, there were at least three before him. Hero’s turbine in the first Century and Thomas Savory in 1698 applied steam as a motive force. Then, Newcomen in 1712.

The Industrial Revolution began with the invention of the steam engine. The first version was invented by Newcomen about 1712. This engine uses water to condense the steam vapor beneath the piston which then provides differential pressure between atmospheric pressure and the partial vacuum created upon the collapse of the vapor. A pound of water will expand about 1500-1700 times when changed to vapor. In Newcomen’s engine, it was the collapse of the steam space that created atmospheric pressure to force the piston down and thus operate the pump.

About 64 years later, James Watt invented his version of the steam engine that could generate more force than atmospheric pressure by using high pressure steam.

James Watt’s engine created the potential for greater engine output and became the basis for the Industrial Revolution.

The first electric generation in the U.S.A. was about 1880 by Thomas Edison using a reciprocating steam engine drive. Before getting into electricity generation, it is timely to remember that illumination before the light bulb was provided by whale oil and then kerosene. Thus, it can truly be stated that the oil industry saved the whales.

As we cover the history of energy, I think it is notable to consider the environmental aspects of energy produced in 1850 for illumination. Before Edwin Drake struck oil and started the American oil industry, whale oil  or candles were used for night-time illumination. It could be said that Drake, Rockefeller and others involved in the production of oil & kerosene helped to save the whales. Next, the advancements of energy were used to provide transportation. Steam boats and Railroads first used wood and then coal fuel to produce steam power for motive force.

Transportation propulsion systems have been the leader for commercial electric power generation since Edison’s day. First, reciprocating steam engines used as prime movers for steamboats and then locomotives were adapted to stationary generators. Then, steam turbine drives for ships were adapted to stationary power generation. Later, aircraft jet engines were adapted for use as stationary generators and finally, nuclear propulsion systems developed by the US Navy were applied to commercial power generation.

Wood was the primary fuel of the 19th Century and it was used for heating, cooking and transportation via railroad locomotives and steam boat propulsion. The steam engines used for railroads, boat and ship propulsion were later adapted for stationary use in power plants to generate electricity. Interestingly, marine propulsion systems were the basis of technology later adapted to use for power generation. Steam engines, steam turbines, the latest advances in coal boiler developments and even nuclear power generation designs all had their roots in marine propulsion.

Memories and photos of Coal Fueled Steam locomotives of the 19th Century do not help the case for use of coal in today’s power generation plants. The enormous potential power of steam was harnessed for transportation as well as to power the Industrial Revolution. Environmental controls of exhaust gases and particulates came much later. 

This is a short course, so there is clearly a compression of a lot of history. It is my hope to take a quick review of the significant inventions of the last 150 years and to show the relationship of energy to the growth of America and our very high quality of living. Until there is a disruption of our energy supply, such as a pipeline shutdown or a hurricane, we tend to take for granted, our place at the top of the “Human Development Index Pyramid”.  Energy is at the heart of our high quality of living.

It is true that through the use of our God given energy resources, our lives have progressed to a higher Human Development Index. More on that later when the HDI of other countries is compared to ours.

American civilization grew from an agriculturally based society to an Industrial production-based country in just a few decades. About 1915 and continuing to today, much of the work that our ancestors were subjected to is now accomplished with energy. Heat-Engines lay at the heart of the rapid progress of the last 100 years for food production, transportation, industrial production and Economic progress. 

Until the Internal Combustion Engine was Applied to Improving Agriculture and Transportation, Horsepower was the Norm

Benz gets credit for the first automobile produced with an Internal Combustion Engine

Looking back to the days of my grandfather (born 1895), about 40% of the American population lived in rural areas on farms and it took 40% of the population to produce food for the other 60%.

1900 was a year to keep in mind for both the astounding progress of energy and electricity generation. Also, in that year, the Father of Nuclear Power Generation was born. Hyman Rickover was born in Makow, Poland. It was during his lifetime that he personally developed nuclear power for ship propulsion systems. First for submarines and later for aircraft carriers and then commercial nuclear power generation plants. Rickover’s life was productive and amazing. Truly, this one individual changed the world of power generation over his life-time.

A classic speech given by Rickover in 1957 starts with how man has used energy to improve quality of life. Rickover gave historical milestones in energy going back to the Egyptians. This was part of President Eisenhower’s “Atoms for Peace” initiative. The genesis of peaceful uses for nuclear power.

Muscle power was being replaced by steam, gasoline and Diesel engines. James Watt created a definition of “Horsepower” by performing various tests. The numbers he settled on to describe a “Horsepower” (still used today) are 550-foot pounds of work in a second or 33,000-foot pounds per minute. This is the definition of one horsepower.

The illustration shows a cartoon of a horse pulling a large bucket of coal vertically upward, representing 1 HP.

The Railroads traversed America in the later part of the 19th Century and provided a platform to further advance the development of boilers and steam engines. It was not long to reach the point that coal fueled locomotives could greatly outrun a team of horses and do so for long duration.

Economic Prosperity parallels the advancements in use of machines powered by steam or internal combustion engines are used to replace muscle power.

Karl Benz is credited with building the first gasoline powered automobile about 1886. Later, Henry Ford invents and develops the assembly line to mass produce automobiles and the demand for petroleum soars. Rockefeller had been producing kerosene for illumination up to about 1900.  Rockefeller was concerned that Edison’s electric light bulb invention would reduce the demand for kerosene and it did. However, with the steady increase of mass-produced gasoline powered automobiles, the demand from Rockefeller’s Refinery’s was steadily increasing.

The right panel (below) shows the sharp increase in GDP at about 1900. America’s GDP and individual family earnings led the world. In my opinion, much of this sharp increase in economic prosperity is due to the reasonable cost, abundant and domestically available energy which was replacing muscle power.

As seen above, the American Economy soared after 1900. By 1903, America’s GDP per person was the greatest of all of the Industrialized Countries of the world. The U.S.A. GDP/person $8,941 with the United Kingdom second at $7,482. Nearly double that of France and Austria. This coincides with the introduction of electricity distribution, the start of gasoline powered tractors, trucks, the beginning of U.S. Steel, Aluminum and automobiles. Energy use was multiplying the production of primary metals and manufactured products. Much previously produced with muscle and some hydropower.

Mechanization of Farming Made Food Producton Much More Productive with Far Less Labor The Fordson Tractor was introduced about 1915

At the same time that Westinghouse, Edison, Tesla and Allis-Chalmers were building power plants in the U.S.A., Parsons, Brush, Thompson, Siemens and others were taking similar steps in Europe.

Edison invented the Incandescent Light Bulb in 1880. However, carbon arc, electric lights were used for street lighting about 1870. (Carbon Arc Lighting was invented by Humphry Davy in early 1800’s using hundreds of batteries to produce the voltage needed for an arc)

Werner Von Siemens invented the Dynamo in 1866. Another European, Nikola Tesla became interested in Alternating Current and invented the Poly Phase Motor. Tesla then found work at an Edison Power Plant in Paris. Tesla was able to work out a transfer to Menlo Park to work directly with Edison. 

Siemens Factory in Germany for producing electric motors, Carbon-Arc Lamps on the streets of Berlin. Inset photo of Charles Parsons Steam Turbine

Edison was convinced that A/C power was not as good as D/C power. Tesla correctly favored A/C because of the ability to transform to higher voltages for long distance transmission and also because the Poly Phase A/C system worked well with his Poly Phase Motor.

Tesla leaves Edison’s employment and struggles in business by himself for a while. Then, Tesla and George Westinghouse team up together. By 1890, Westinghouse had invented the Transformer and this plus Tesla’s inventions of Poly Phase Motors and A/C current create a harmonious and productive team effort of Tesla and Westinghouse. One milestone project that Westinghouse topped Edison on was providing the generators for the first hydro-electric plant at Niagara Falls. The advantages of Alternating Current made longer distance power transmission possible. With Direct Current that Edison favored, the wires could only transmit power about a mile. 

There is much written on the “Current Wars” between Edison and Westinghouse. The American Juris Prudence System does not look so great in retrospect and especially the harsh handling of the engineering excellence that was applied by Tesla and Westinghouse. J.P. Morgan gets involved as a major investor in Edison General Electric which then becomes, “General Electric” and Tesla’s Patents on the Poly Phase Motor and Alternating Current become the basis for the American Electric Grid. From what I have read, it was the deep pockets of J.P. Morgan that held Westinghouse back. 

The disputes between Westinghouse and Edison were not very harmonious to put it mildly.

Edison, Tesla and Westinghouse. Three important people regarding theapplication of electricity for practical purposes

Steam Power requires a steam generator or boiler. As is the case today, Thermal Power Generation provides most of teh world’s electricity. Steam boilers are important and Babcock & Wilcox invents the inherently safe, water-tube boiler in 1867.  I will give a few examples of boiler safety later.

Fire-Tube Boiler (Left) B&W Water-Tube Boiler (Right)

The difference between a “Water-Tube” and a “Fire-Tube” Boiler is the manner in which the heat is transferred from the products of combustion to the water to create high pressure steam. A Fire-Tube Boiler has a large diameter shell (like a Locomotive Boiler) with the hot gases passing through tubes that pass through the large diameter shell. Steam engines are the prime movers for generators of either A/C or D/C and to have steam, so a reliable high-pressure boiler. Is needed to provide the steam supply. There are two types of boilers, Fire-Tube and Water-Tube. The fire tube boiler is a typical design which is similar to steam locomotives of the 19thand 20th Centuries. The  products of combustion leave the fire box and the hot gases of about 2,000-2,500 degrees F. enter tubes which pass through a large pressure vessel. Heat flows from the hot gases through the fire tubes and into the water contained in the large cylindrical pressure vessel. The larger the steaming capacity the larger the boiler cylinder needs to be.

This evolution of boilers is taking place in 1850 to 1900 and steam engines for ships, locomotives and stationary power generation systems are getting larger and larger. Thus, the boiler pressure vessels had to grow in diameter as well. 

The science of Welding and Metallurgy was in its infancy and steel plates were rolled into cylinders to form boiler shells but instead of welding the seams as is done today, they were caulked and riveted. The many riveted joints were an inherent weakness of large pressure vessels.

Fire-Tube Boiler Construction, before welding was developed and applied to pressure vessel fabrication

The inherent safety risk of Fire-Tube Boilers was that the shell diameter for a large capacity boiler must be very large. In the 19th Century and in fact, until about 1930, boilers were constructed using rivets to attach the shell plates together. Welding was not applied to boiler pressure parts till about 1930. Thus, the rivets combined with relatively primitive advances in steel manufacturing and metallurgy, created a high risk for failure of the pressure parts. Between 1895 and about 1910 there was about one major boiler explosion per day. Often each individual boiler explosion would kill dozens of people. Here are a few examples of terrible boiler explosions.

The American Society of Mechanical Engineers (ASME) is Founded in about 1880 and one of the main reasons is to work as an organization to improve the safety of the public. The first edition of the ASME Boiler and Pressure Vessel Code is published about 1915. 

Niagara Falls became the first major Hydro-Electric Plant in the USA and I believe, the largest in the world at the turn of the Century. A beautiful and environmentally friendly way to harness the energy of falling water. 

Niagara Falls was an important milestone for power generation. But the enormous demand that began with the 20th Century was satisfied by heat-engines. Reciprocating Steam engines and steam turbines.

Reciprocating Steam Engine Drive for a D/C Generator about 1890 at the Williamson Free School of Mechanical Trades

Meanwhile, in England, Charles Parsons is experimenting with steam turbine designs. As with steam engines, the first major applications of steam turbines are for ships. One of the notable steam turbine applications was to the Royal Navy Ship the Turbinia.

The British turbine powered “Turbinia” was built about 1894. This ship was demonstrated by Parsons to the Royal Navy as being twice as fast as reciprocating steam engine powered ships of the time. Marine applications tend to lead stationary power plants into the nuclear age with the first of a kind used for ships and the Navy, both in Europe and the U.S.A.

In America, about 1900 the transition from steam engines to steam turbines began. In this figure below there is one huge steam engine with a large flywheel in the foreground. In the back can be seen three smaller, but larger capacity steam turbines. From 1900-1915 numerous manufacturers of steam turbine drives came to be. Among them: Westinghouse, General-Electric, Allis-Chalmers, Charles Parsons, Brown-Boveri and Siemens.

In London and other large cities, Central Stations were built to generate electricity for the surrounding area. With DC current, it was only practical to extend wires for about a mile square. Later, AC was used which can be transformed to higher voltage and transmitted over longer distances. The slide of the London Power Station shows the typical arrangement of equipment in this time. Note the belt drives to the Dynamos located on a level above the steam engines and the water-tube boilers.

Energy use is not just for electricity. Even today, about 63% of our primary energy is used for transportation, industrial production and heating. About 37% of America’s energy is used to generate electricity. Automobiles become common and at the turn of the Century, the Internal Combustion Engine was welcomed as a great improvement for the environment. Cars and trucks powered by gasoline engines were a lot cleaner than horses. Petroleum became the largest portion of our energy use following WWII and continues to this day to be the major source of primary energy. Increased Industrial production, improved comforts and conveniences, improved quality of life and the resulting economic activity after 1900.  All of these increased demand for most forms of primary energy and electricity.

Both marine uses and stationary power generation prime movers make progress from reciprocating steam engines to turbines and to advanced boiler designs for safety, improved efficiency and reliability.

The illustration below shows a diagram of how using coal as a source of heat energy is converted to steam which is then converted by a steam turbine to shaft “Horsepower”. Keeping in mind the definition of a horsepower is 33,000-foot pounds of work in one minute. In this example, using coal that has 11,500 Btu’s per pound, the potential work equivalent is 11,500 multiplied times 778-foot pounds per Btu. At 100% efficiency, this one pound of coal would produce about 9-million-foot pounds of potential work. The enormity of this heat energy provides insight into the tremendous energy provided by steam and also, the stored energy within the pressure containment of a steam boiler. This brings us to the advancements in safe design and construction of steam boilers over the next few decades.

From Storm Technologies, Inc. Library of Educational Slides on Power Generation

The demand for electricity grew sharply after the inventions of motors, air conditioning and home appliances. Refrigerators became commonly used in homes beginning about 1927. 

Coal fuel was the predominate fuel during this period for electricity generation. Steam turbine drives as prime movers had grown in size and reliability. The steam boilers larger and larger. Welding of boiler pressure parts was advanced after about 1930 and steam boilers became larger and more safe. Overall, the coal plants became quite large. Here is an article that appeared in “Combustion Magazine” during the 1930’s.

At about this same time, pre WWII, Frank Whittle invented the Jet Engine. This basic design was later used after WWII as the besis for stationary Gas Turbine Drives for generators.

Frank Whittle of the UK is generally given credit for design of the jet engine. It is thought that Von Ohain in Germany had access to Whittle’s Patent before his work. 

Only twenty-two years old when he first conceived the idea of a continuous cycle combustion engine in 1933, von Ohain patented a jet propulsion engine design in 1934 that was similar in concept to that of Sir Whittle but different in internal arrangement.

Von Ohain joined Ernst Heinkel in 1936 and continued with the development of his jet propulsion concepts.

He successfully bench tested of one of his engines in September 1937 and a small aircraft was designed and constructed by Ernst Heinkel to serve as a test bed for a new type of propulsion system known as the Heinkel He178. The Heinkel He178 flew for the first time on August 27, 1939. 

G-E progressed using Whittle’s design to develop both aircraft and stationary gas turbines for power generation.

American Bombers being assembled at Ford Motor Company Plant during WWII, Packard Automobile Plant becomes a Manufacturing Plant for Aircraft Engines

Following WWII, America’s Industrial might continued with the rebuilding of Europe and Japan with the Marshall Plan. Energy use increaded as did manufacturing capacity. Along with the energy and manufacturing capacity increases came increased Economic growth.

U.S. Dept. of Energy, Energy Information Administration Chart of Total Energy Use of U.S. 1775-2009

The growth of energy consumption is shown above. This growth in energy can be compared to the GDP of Economic growth in the chart below which is copied from “Our World in Data” website.

The chart below was prepared by ExxonMobil for their Energy Outlook publication. The data is from the World Bank and the United Nations. The point is, the Human Development Index is related to energy avalaibility and use. More energy use can be parlayed into a better quality of life. The foregoing text and illustrations show how the U.S.A. progressed from an Agrairian Economy in the 19th Century to become the most productive Industrial Economy of the world by the mid 20th Century. Of course, Economic Freedom had much to do with America’s rise, but so did the availability of abundant and reasonable cost energy. This will conclude Part 1 of this post. Part 2 will show the relationship of energy and economic prosperity from 1950 to the present day.

Conclusions and Summary:

  1. America progressed from wood and whale oil fuels to the more abundant and increased energy density of coal and oil in about 50 years, 1850-1900.
  2. Our economy progressed and quality of life improved as more muscle labor (human and animal muscle) saving machines were invented, produced and utilized.
  3. Steam engines and steam turbines were the prime mover of choice for ships, railroads and agriculture until the various versions of internal combustion engines were invented and manufactured. The gasoline Otto Cycle and the Diesel Cycle engines were invented and began production in the late 19th Century.
  4. The first major oil discovery in Texas is Spindletop, 1901. This begins the long and productive history of oil production in the state of Texas.
  5. Willis Carrier invents modern air conditioning and humidity control 1902.
  6. Henry Ford revolutionized automoble transportation starting about 1903.
  7. Agricultural production is vastly more productive by the replacement of horse muscle power with mechanized tractors powered by gasoline or Diesel internal combustion
  8. Carnegie and United States Steel become the largest steel manufacturers in the world after 1901
  9. Charles Martin Hall invents and perfects the Aluminum Smelting process in 1888. The Pittsburgh Reduction Company produces aluminum used in the Wright Brothers “Flyer” 1903. Later the name is changed to the Aluminum Company of America and the acronym, ALCOA
  10. Production of both Steel and Aluminum are both very energy intensive. Thus, abundant, reasonable cost energy is required for the steel and aluminum industries to grow as they did.
  11. About 1928 General-Electric produces home refrigerators for preservation of food.
  12. Texas begins development of the Permian Basin oil fields, 1928
  13. During WWII America becomes the “Arsenal of Democracy” and along with our Allies save Western Civilization. The Allies “Arsenal” was fueled mostly by American produced energy, mostly coal and oil.
  14. Captain Hyman G. Rickover has a vision for nuclear propulsion system for submarines and nearly singlehandedly, designs and then leads a team to build the first nuclear powered submarine, the Nautilus which puts to sea 1955.
  15. President Eisenhower launches “Atoms for Peace” Initiative for Peaceful uses of atomic energy. Begins at Atoms for Peace Conference in Geneva, 1955

This is Part 1. Part 2 to follow in the near future. The purpose of this post is to show the importance of reliable, reasonable cost and abundant energy. Energy to power our high quality of living. Our energy has been reliable, low cost and abundant for decades. My observation is that people have become accustomed to reasonable cost and reliable energy for so long that we take it for granted. The environmental extremists on the other hand, have attacked all conventional forms of energy including Fossil Fuels and nuclear which together comprise about 90% of the energy that we depend on.

The foregoing list of 15 accomplishments is intended to show the relationship of energy to high quality of life and economic prosperity. If energy availability is reduced, then our quality of life and economic prosperity are harmed. Up to this point in history, we have always increased energy production to meet the demand of our growing population.

Dick Storm, January 13, 2022

ENERGY AND ECONOMIC PROSPERITY

A few weeks ago, I commented on a post on LinkedIn by Donna Castro. My question was, “I wonder what the correlation is between Economic Prosperity and Energy Use”. So, to answer my own question I did a little research and here is the result of that search.

The “Visual Capitalist”(1) published the graphic above Dec. 21, 2021. I have been interested in the relationship of energy use to fuel Economic Prosperity for many years and liked this graphic.

The total world GDP is projected to be 94 Trillion Dollars. Only 18 countries have greater than a 1% share of the total world economy. The U.S.A. and China comprise about 42%. The ten largest economies are:

So, back to my curiosity of relating energy use to economic output, I thought it would be useful to show the top ten countries ranked by total energy use. Statista and other organizations list these. I used the chart from Statista. Not surprisingly, the data from all sources show the largest economies use the greatest quantity of primary energy. China is the world’s largest manufacturer and they produce over 50% of the world’s steel and aluminum. Primary metals production is very energy intensive, thus, it is expected that China will use the greatest amount of primary energy and they do.

Chart by Statista.com

The Net-Zero Carbon Emissions Policies of America brings to mind the threat to our economic prosperity and our comfortable life styles. I have written my thoughts on Net-Zero Carbon, the War on Coal, War on Carbon and my opinion of Net-Zero Carbon, in other posts on my Blog.

A new book by Donn Dears is available which has lots of background and details with fresh information of why the Net-Zero Carbon policies of the Biden Administration are harmful to the U.S.A. I recommend his book for anyone who is interested in the relationship of Economic Prosperity and Reasonable and well thought out Energy Policy. Net-Zero Carbon and the current “Green” initiatives in Congress are not reasonable and not well thought out by people who understand energy and electricity generation.

The Net-Zero Carbon Emissions Policies of America brings to mind the threat to our economic prosperity and our comfortable life styles. How can we reshore more manufacturing and become energy independent again by following anti-American energy policies as laid out in the path to Net-Zero Carbon? I have written my thoughts on Net-Zero Carbon, the War on Carbon and my opinion of this policy on this Blog and other publications. However, Mr. Dears has done a very nice job of condensing many issues of Net-Zero Carbon into about 100 pages.

Donn Dears.org

Note the Sub-Title: Which correctly states, “The Climate Policy Destroying America”

The theme and title of this post is “Energy and Economic Prosperity” the current U.S. Climate Policy is weakening America and Mr. Dears is correct with his choice of sub-title.

I recommend his book and the information available on his web page for reference on Energy Policies that affect our Economy and our life styles:  https://ddears.com

I have been concerned about the war on coal and now the war on carbon for many years. Not only is Net-Zero carbon harmful to the U.S.A. but it is also slowing down Human Development of countries in the Developing World. Going back to the first illustration above, note that the U.S.A. and China comprise 42% of the World’s GDP and that only 18 countries exceed 1% of the total 94 Trillion Dollars of World GDP. 

Energy and Human Development Index

The Illustration below is available on the ExxonMobil(3) website and is based on U.N. data.  Note that 50% of the world’s countries and 20% of the world population do not have fuel for cooking. I personally have experienced walking down the streets of cities in numerous Developing countries. I have witnessed heavy pollution which stings the eyes. Such pollution is not found in the U.S. Many Asian countries still use cow dung for indoor cooking.

My point: The Net-Zero Carbon Path that the U.N. has adopted does not serve the Developing countries very well either.

Let me show another of my favorite illustrations of Energy Poverty in the world. This is the NASA Composite Photo, “The Earth at Night”. These night time photos show the differences of energy and electricity abundance or shortages by the illumination that is visible from space. First let’s look at Africa and Europe: 

NASA, Earth at Night Composite Photo

NASA, Satellight Photo at night showing Europe and the continent of Africa. Also apparent in the Human Development Chart above showing Yemen and Nigeria as two Developing countries that have a low HMI (Human Development Index) with a corresponding low energy consumption.

Compare this to the United States at night below:

Conclusions:

  1. The U.S. President & Congress’ quest to enact Net-Zero Carbon into law will weaken America’s capability to sustain our economy and our life styles.
  2. Energy and Economic Prosperity are inextricably linked and restricting energy production and development weakens our country. Don’t forget the Fossil fuels needed for our Nations Defense. F-22’s and F-35’s require high quality Jet fuel.
  3. The United Nations Framework Convention on Climate Change (UNFCCC) and the Intergovernmental Panel on Climate Change (IPCC) both of which are worldwide, are harmful to Developing Countries as well as OECD countries.
  4. The only winners in the UNFCC and IPCC agreements (if they are fully implemented) is China and Russia.

For more details, I suggest reading Mr. Dears books on the subject. He has written several excellent texts.

Dick Storm, January 3, 2022

References:

  1. Visual Capitalist:  https://www.visualcapitalist.com/visualizing-the-94-trillion-world-economy-in-one-chart/
  2. Statista.com for ranking of energy use by country: https://www.statista.com/statistics/263455/primary-energy-consumption-of-selected-countries/
  3. ExxonMobil Outlook for Energy 2021: https://corporate.exxonmobil.com/-/media/Global/Files/outlook-for-energy/2021/2021-Outlook-for-Energy-fundamentals-infographic.pdf
  4. NASA, “The Earth at Night” composite photo: https://earthobservatory.nasa.gov/ContentFeature/NightLights/images/media/BlackMarble_2016_EuroAfrica_composite.png
  5. https://eoimages.gsfc.nasa.gov/images/imagerecords/79000/79800/dnb_united_states_lrg.jpg
  6. NASA Earth Explorer: https://earthobservatory.nasa.gov/map#6/40.000/-100.000