
Congress and our President are in the process of forcing Net Zero Carbon, Green Energy on all of us. In my view what this will do is increase prices of energy, make our energy less reliable, make America less competitive and in general, harm our quality of life. In thinking about this and attempting to explain why I feel this way, it occurred to me that if all of the citizens knew where our energy comes from and how much we depend on it each day, perhaps more of us would pressure our Congressmen/Congreswomen to resist this foolishness. So, here is my stab at explaining where our energy comes from and why the “Green New Deal” is so harmful.
I have been involved in the energy business for many years and the one chart that explains energy flows best, is the DOE Sankey diagram above. This shows the sources of all of our energy and how it is used throughout the economy. I have been watching this for about 20 years and interestingly, the total U.S. energy use has held steady at about 100 Quadrillion Btu’s per year. In fact, I will show a graph below of the U.S. Energy use by year from 1950-2019.

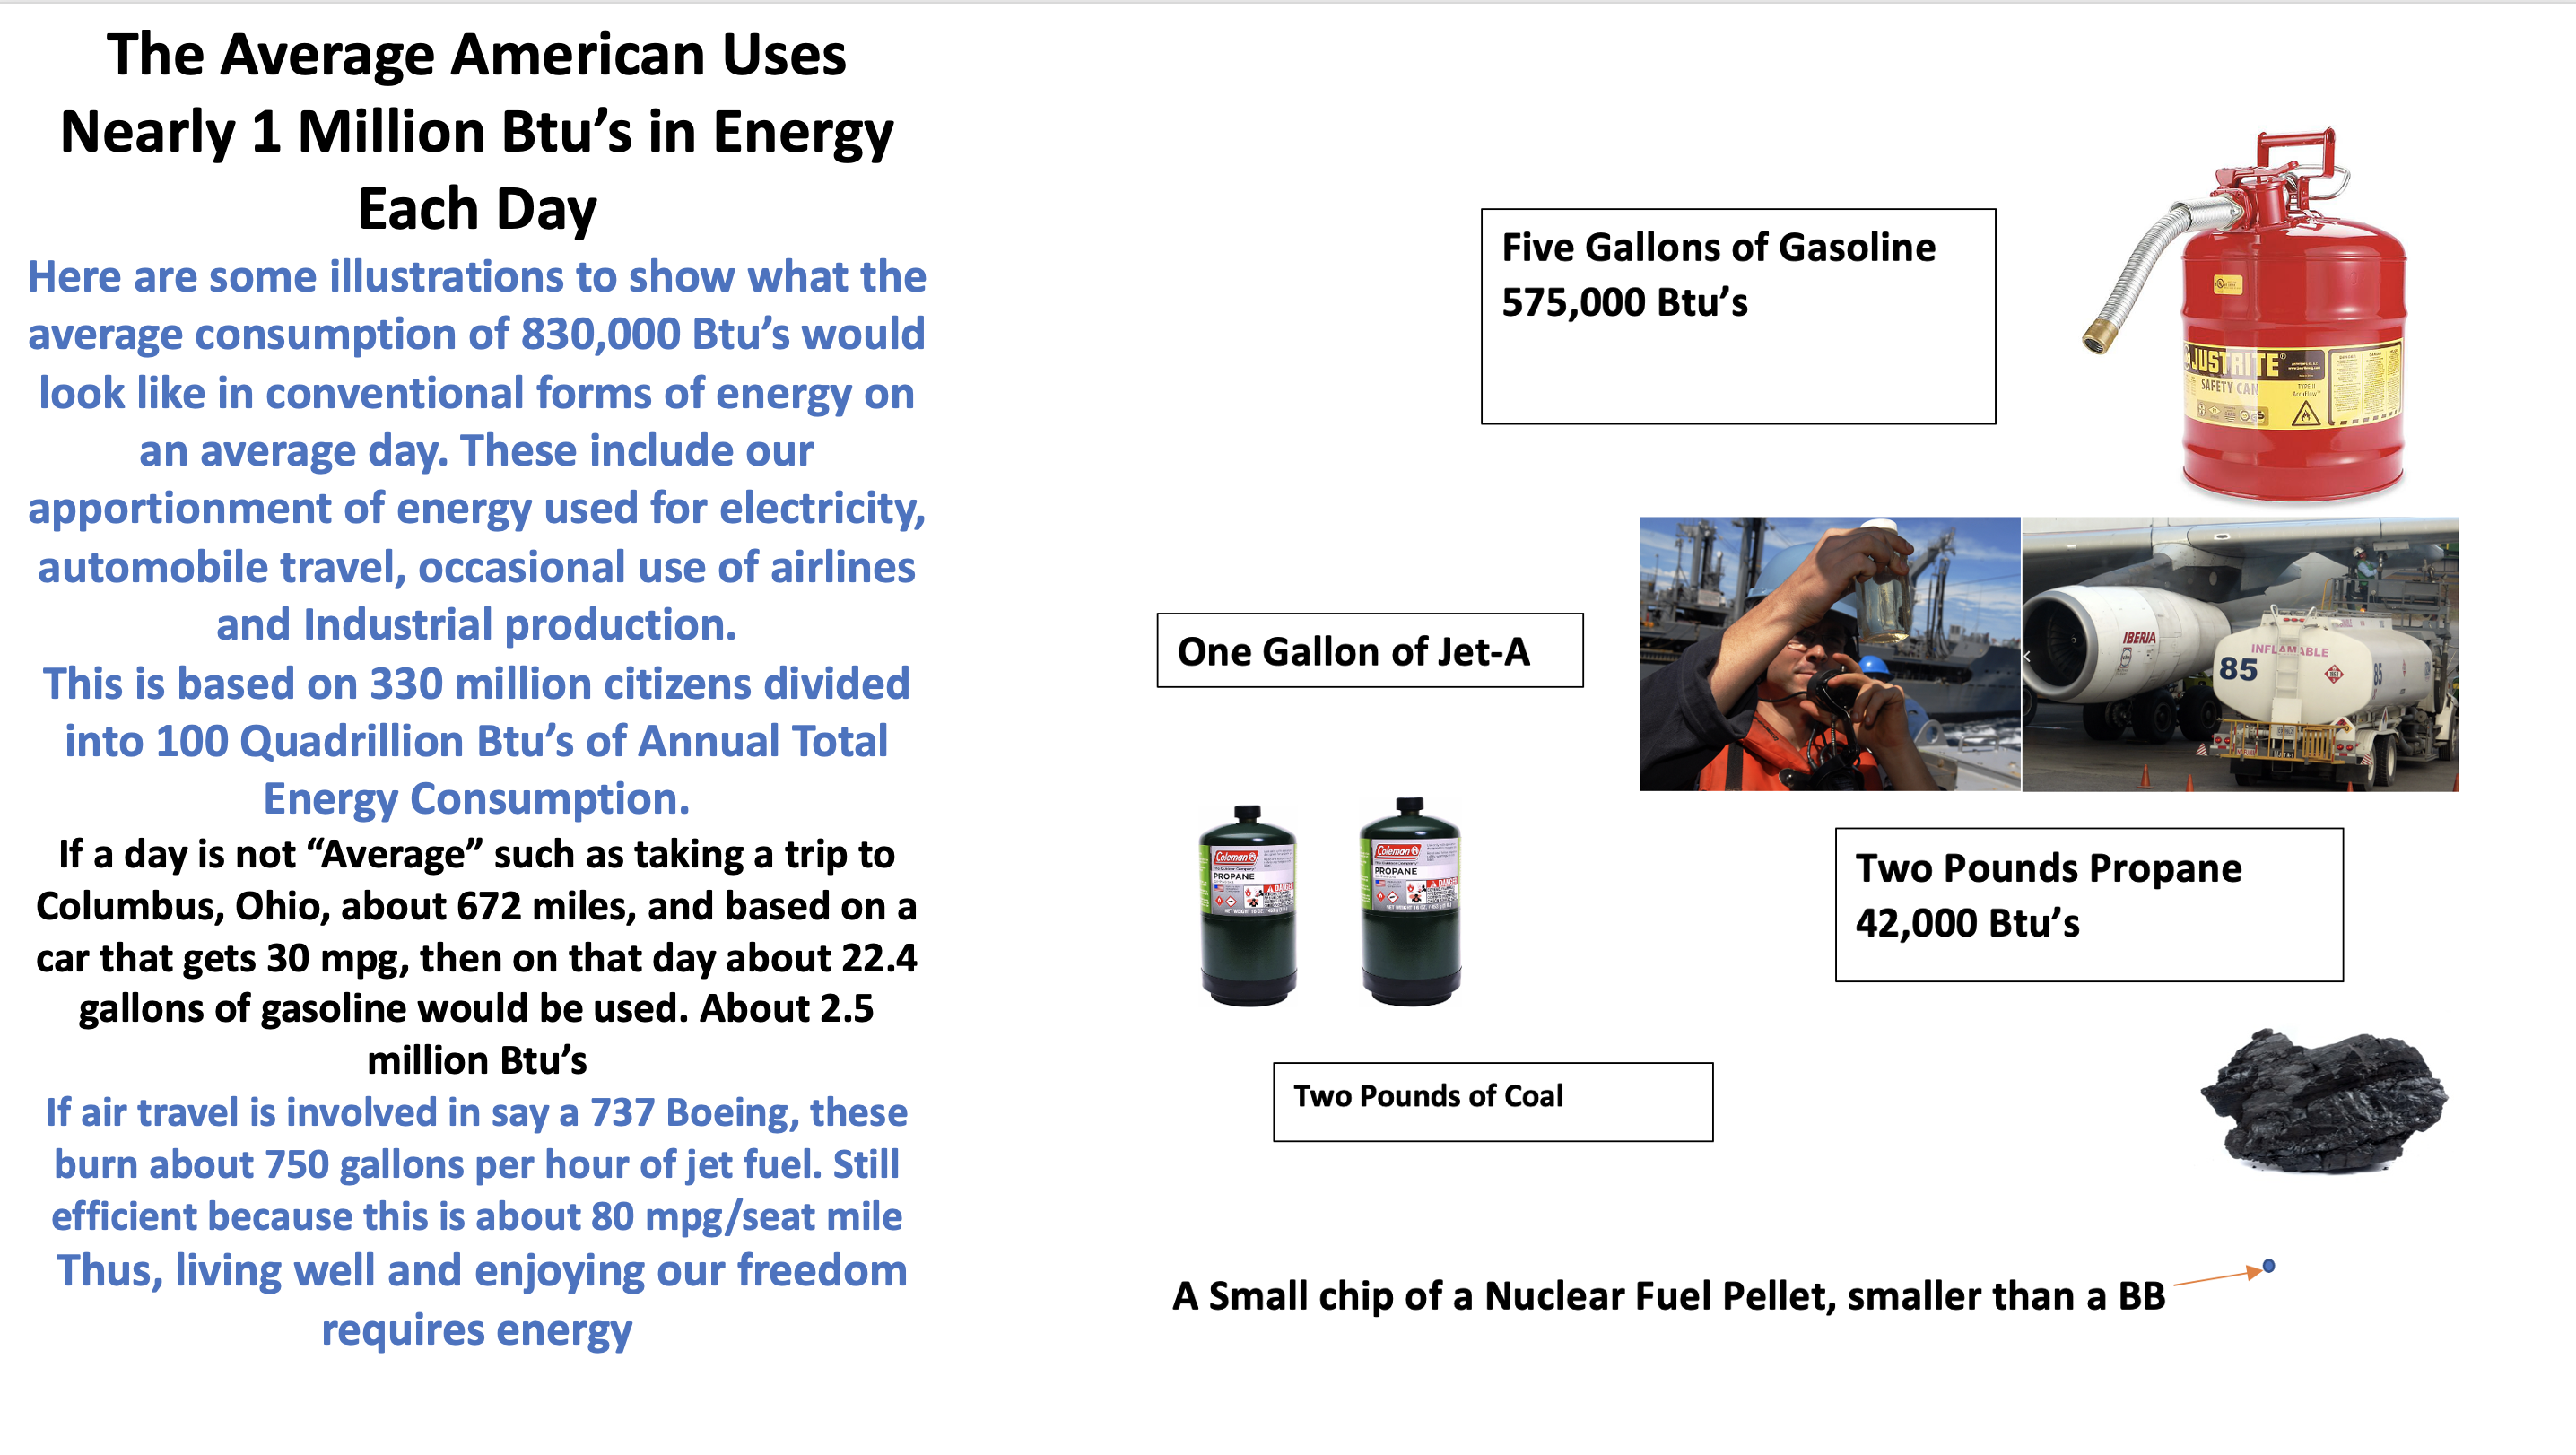
Where does the 830,000 to a million Btu’s per day come from? If we divide 100 Quadrillion Btu’s by the population of 330 million, then the per capita energy use is about 303 million Btu’s/person/year. Divide the 303 million Btu’s per person/year by 365 days and it comes out to about 830,000 Btu’s/day/person.
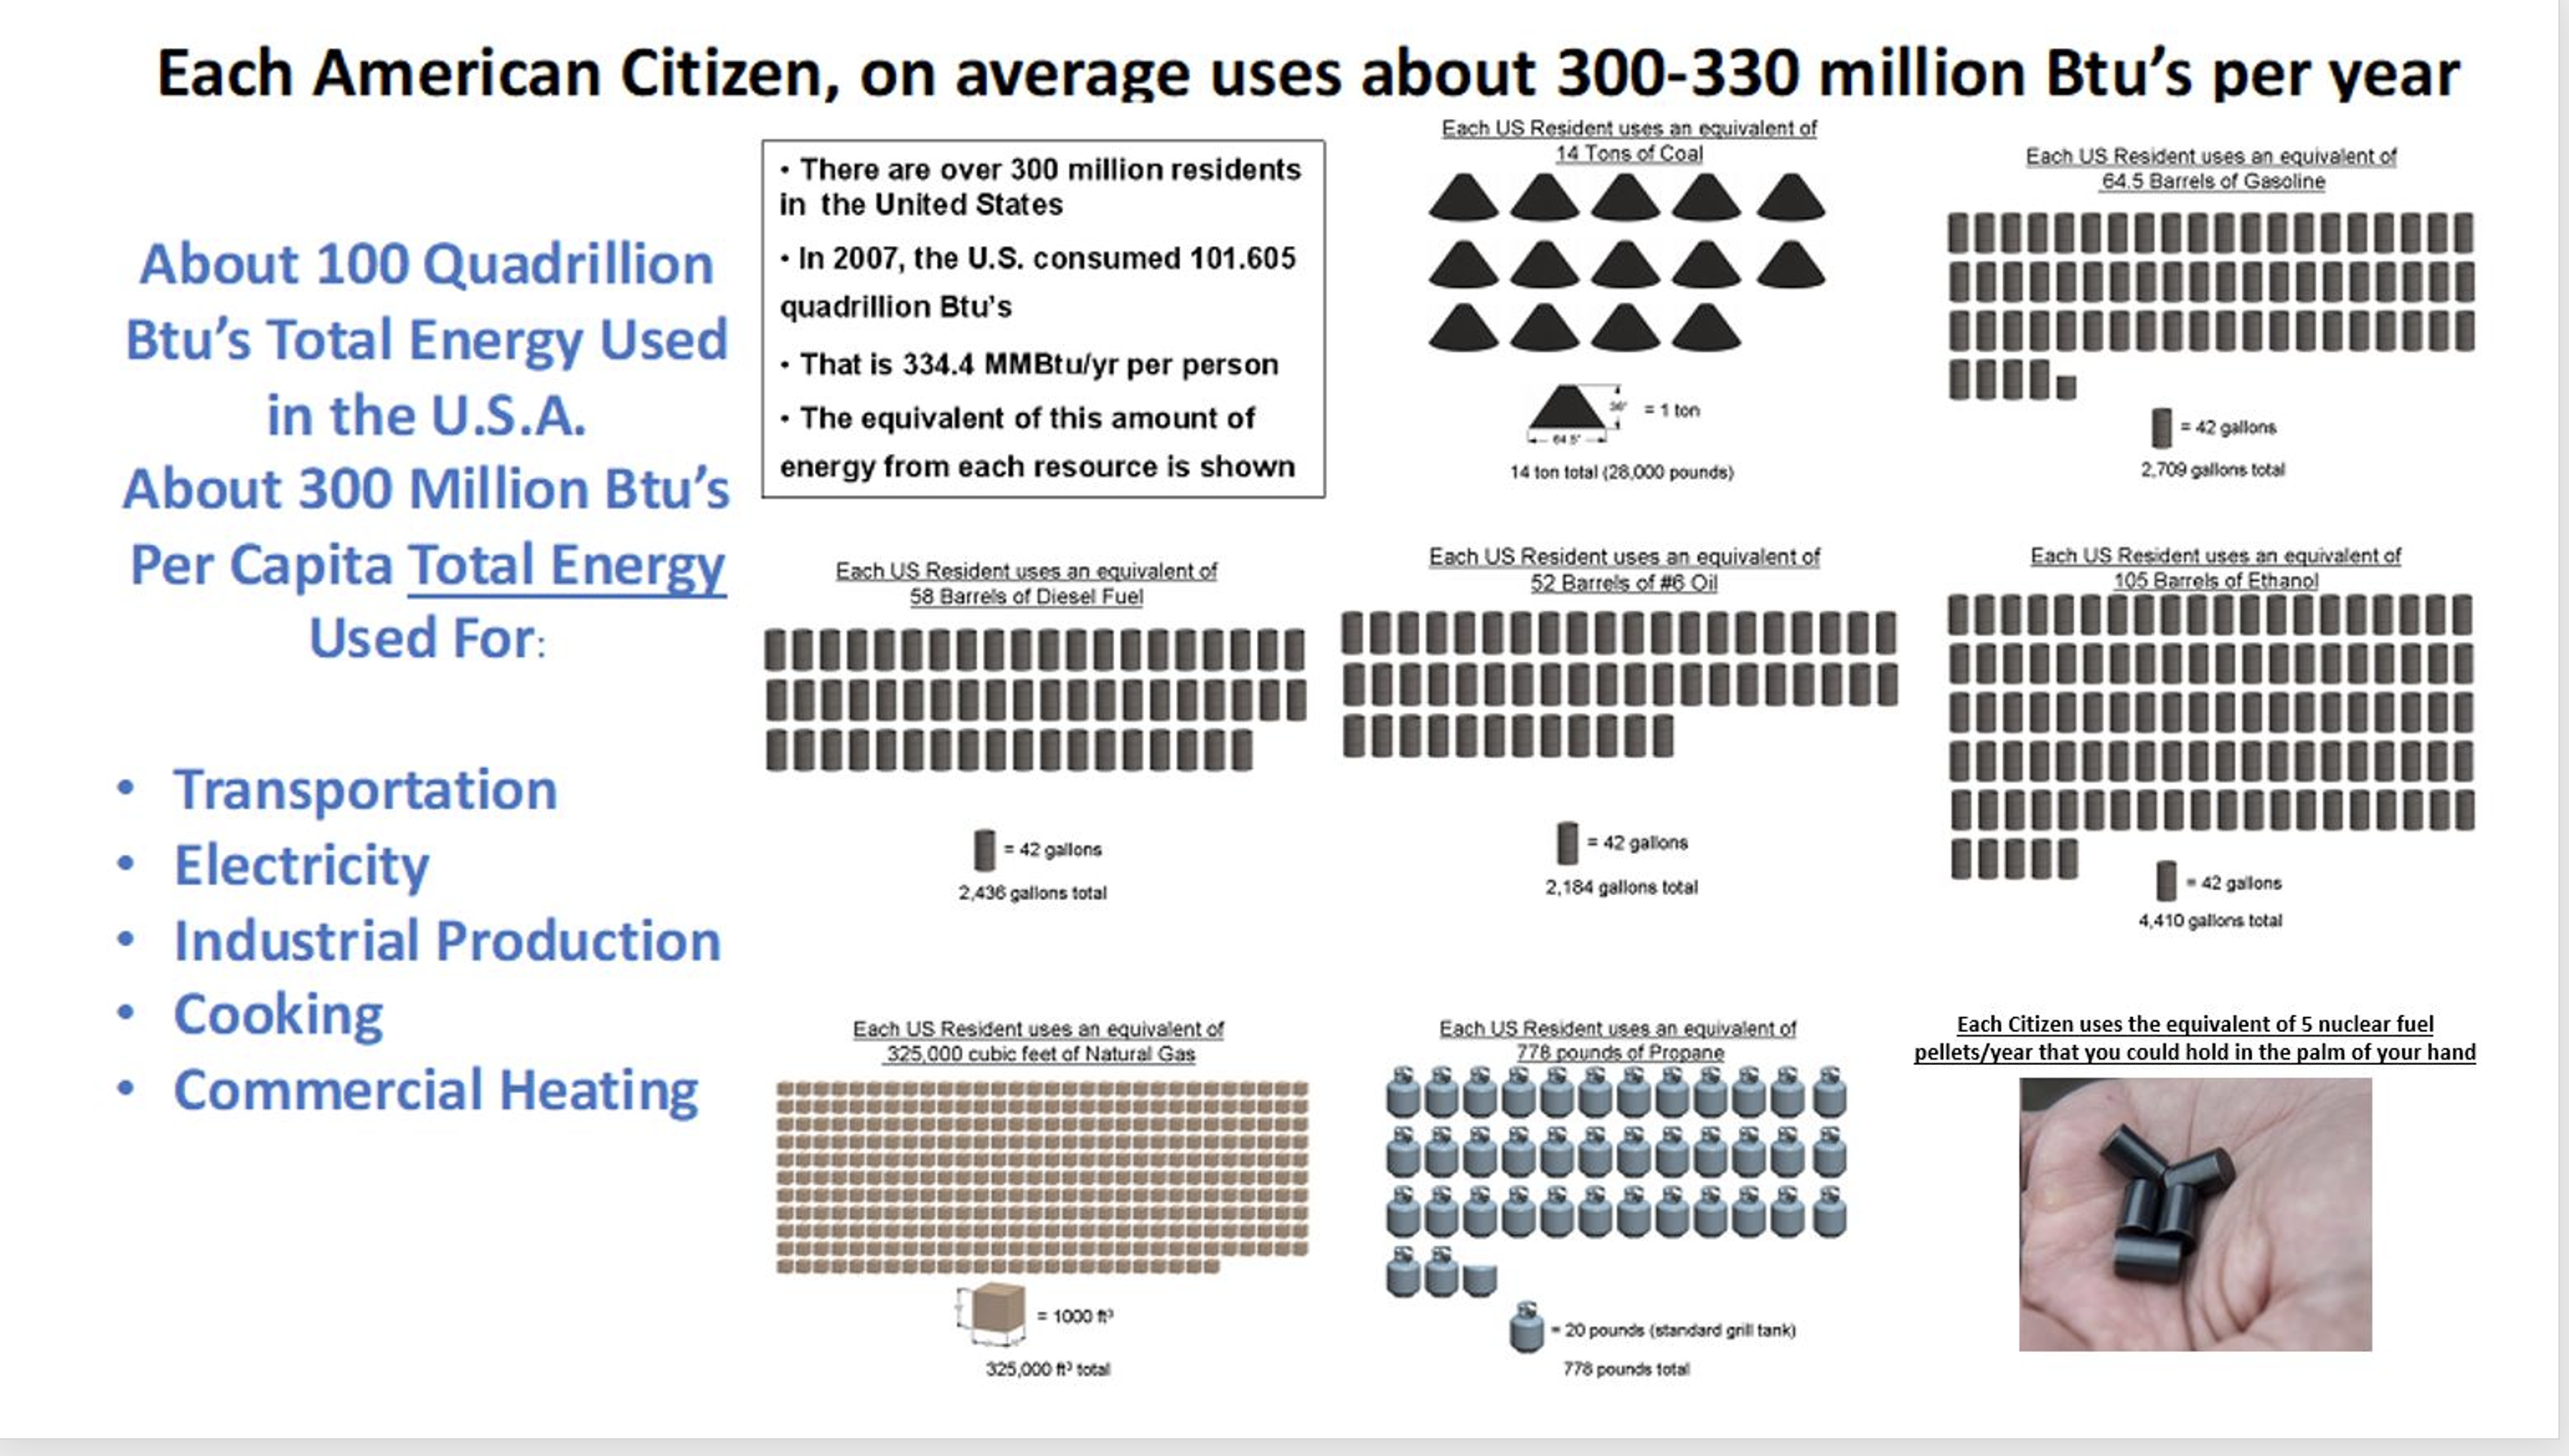
This is average and of course, a person living in a small condo that does little travel, will use less energy than a person who lives in a 2500 square foot home, owns a small fishing boat and travels the world. Lets say the latter example would use more than a million Btu’s per day. This energy could be in gasoline, natural gas, propane for the grill, electricity for HVAC of the home and for cooking. Included in the allottmant of per capita energy use is our share of industrial production, commercial buildings, shipments of goods and government use for the military. Below is an illustration of the forms of energy we might use each day.
So what does this have to do with the “Green New Deal” and the Clean Energy Plan Congress is about to pass? Well, if we are accustomed to living productive lives using conventional energy sources such as outlined above, then how can we sustain our high quality of lives by substituting wind turbines and solar panels for the 96.2 Quadrillion Btu’s provided by conventional forms of energy? Note that on the first figure above, the Sankey diagram I have inserted the total wind and solar in 2019 provided 3.8% of our energy. Petroleum, natural gas, nuclear, coal, biomass, geothermal and old hydropower dams provided the other 96.2%
Let’s get to electricity. The total energy used in 2019 was 100 Quadrillion Btu’s and 37% of this was used to generate electricity. So if we look into the future of EV’s and eliminating the internal combustion engine, then the energy used for transportation will need to come from electricity. Lots more electricity. How does the “Net Zero 2050” proponents think they will get to zero carbon emissions? By windmills and solar. Lots of windmills and solar. Here is an illustration from the Princeton University Net Zero Path.

My opinion is that if this path is taken, it is totally impractical and harmful to America, our way of life and our national security.
After many years of tax subsidies, wind and solar produced 3.8% of our energy in 2019. Texas, Hawaii and California have their own applications of too much renewable power which resulted in Blackouts in CA and TX and the highest electricity costs in the nation for Hawaii. How can we expect zero carbon based fuels by 2050 and still maintain a strong economy and enjoy our way of life. Perhaps more important to our grandchildren, keep English as our primary language, not Mandarin? The next three charts show the relationship of carbon emissions and manufacturing by a few selected countries.
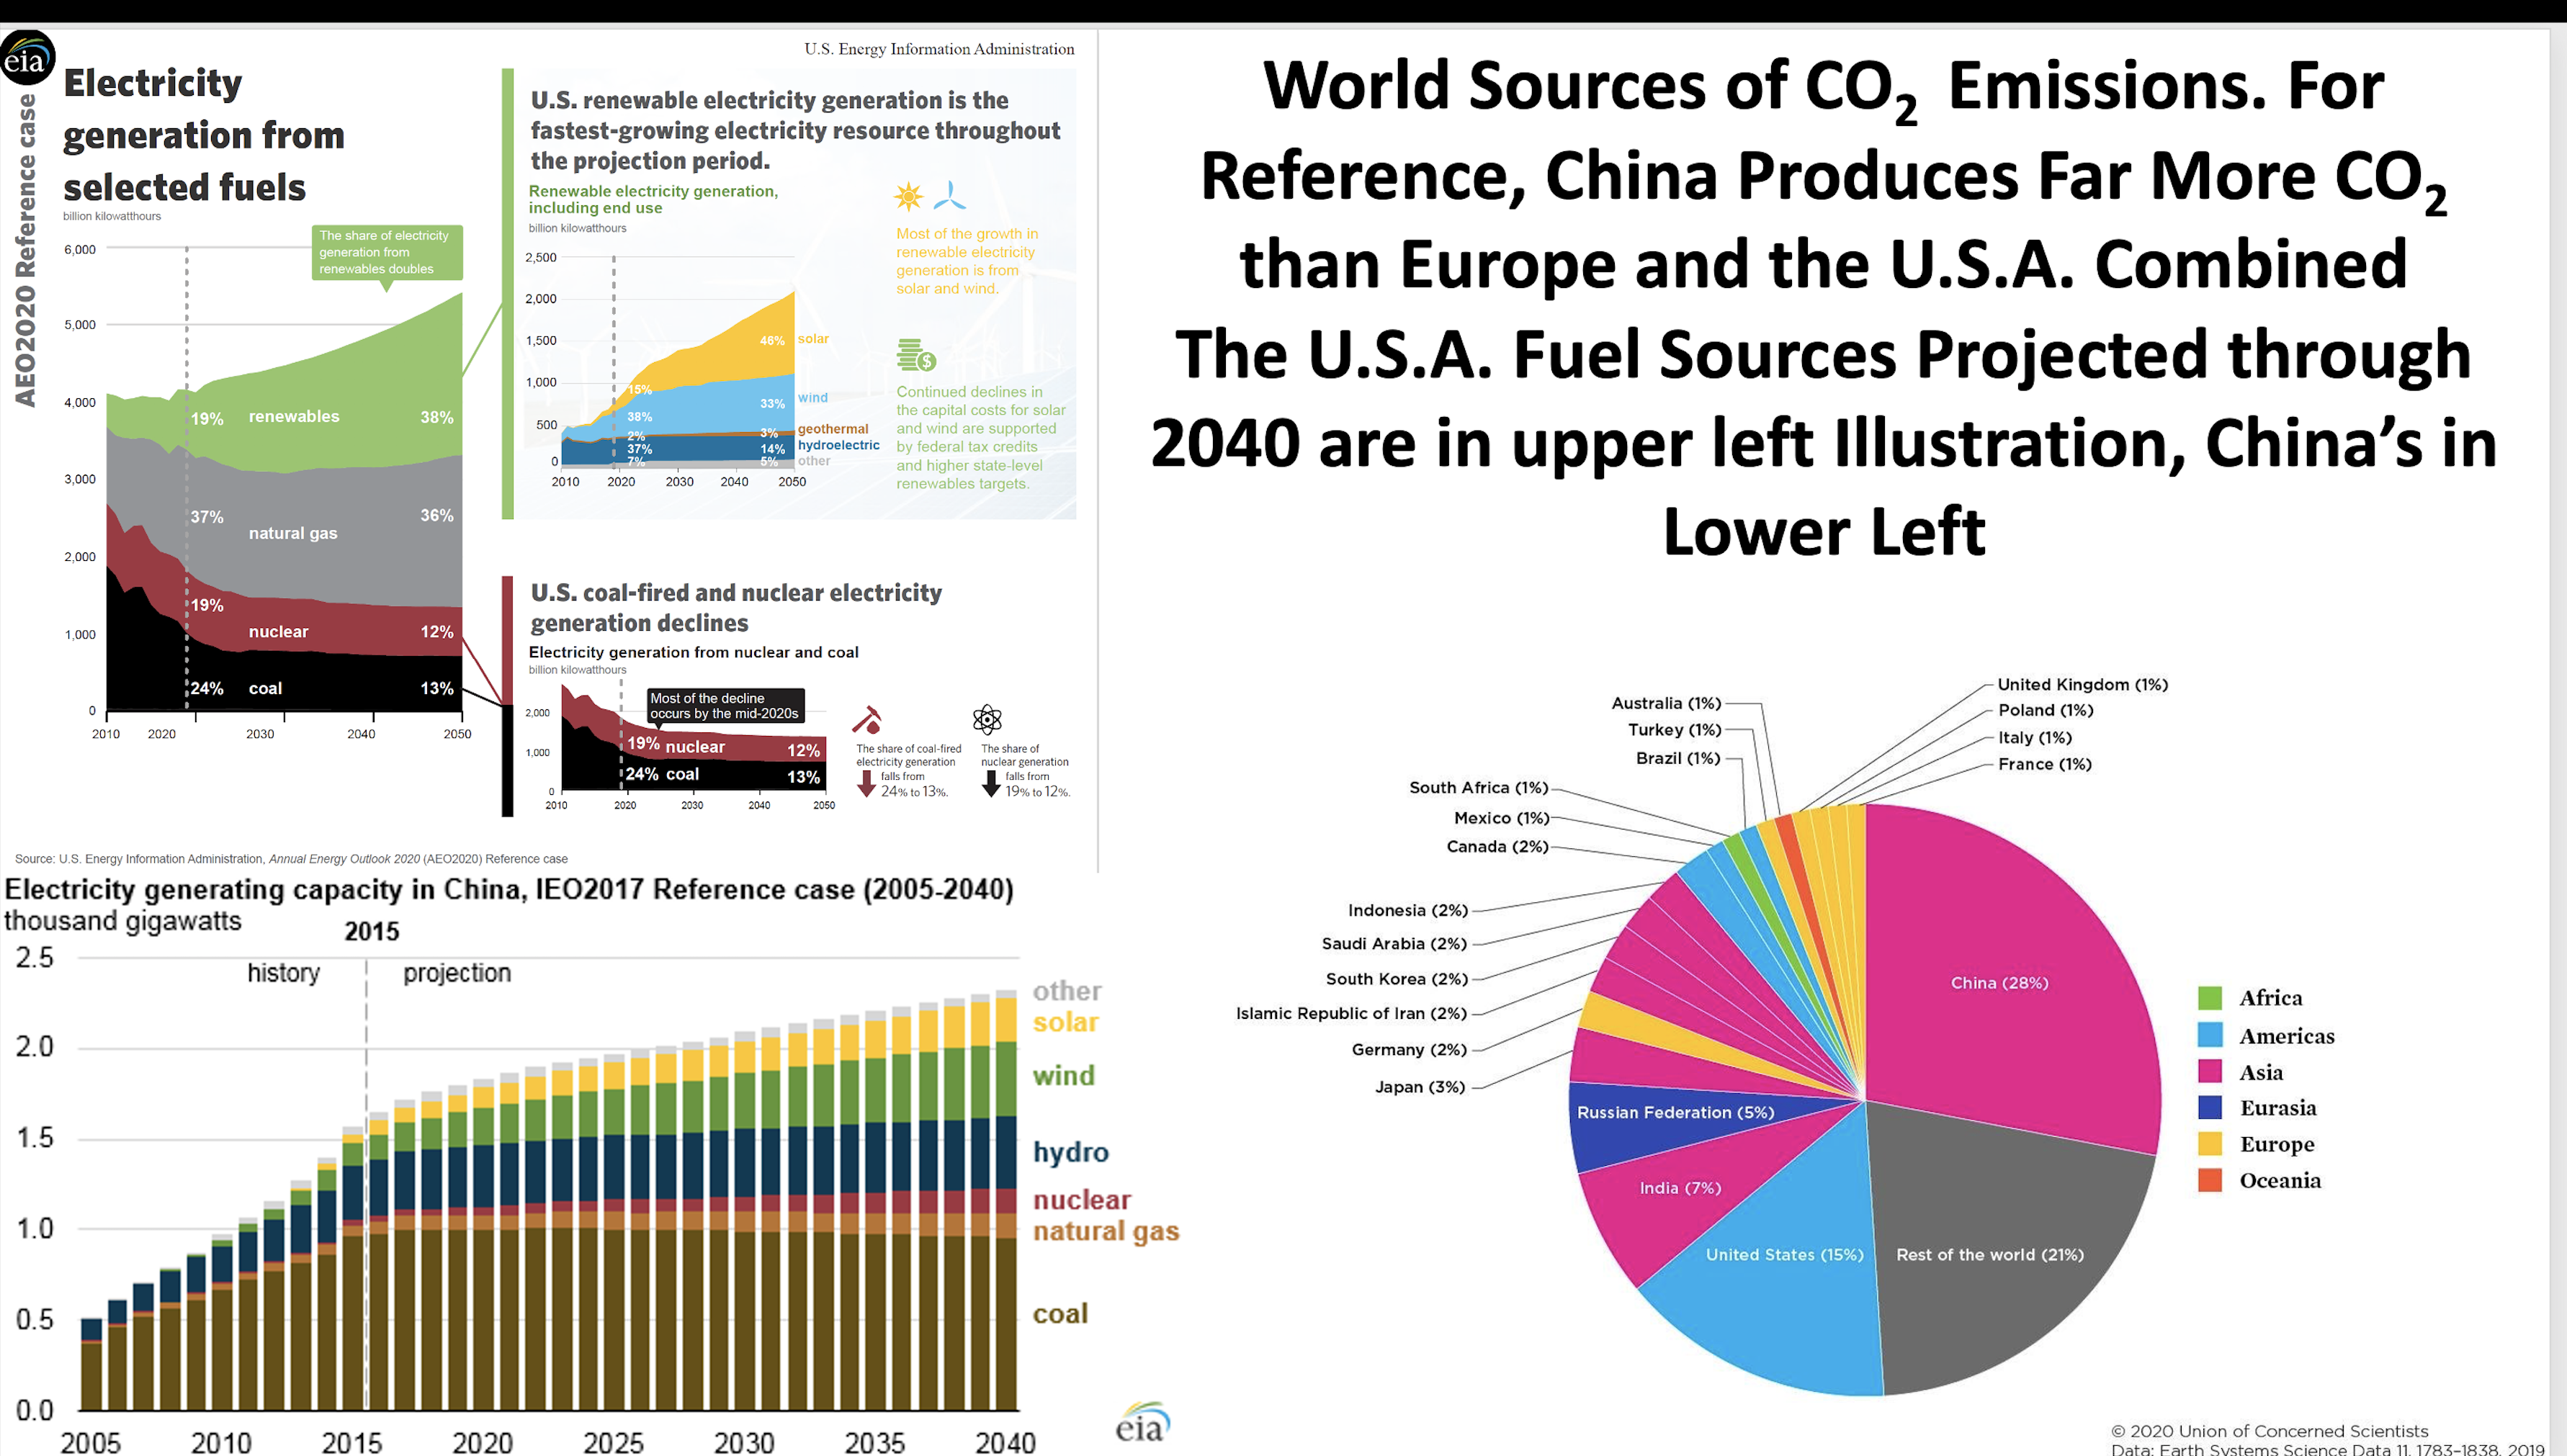
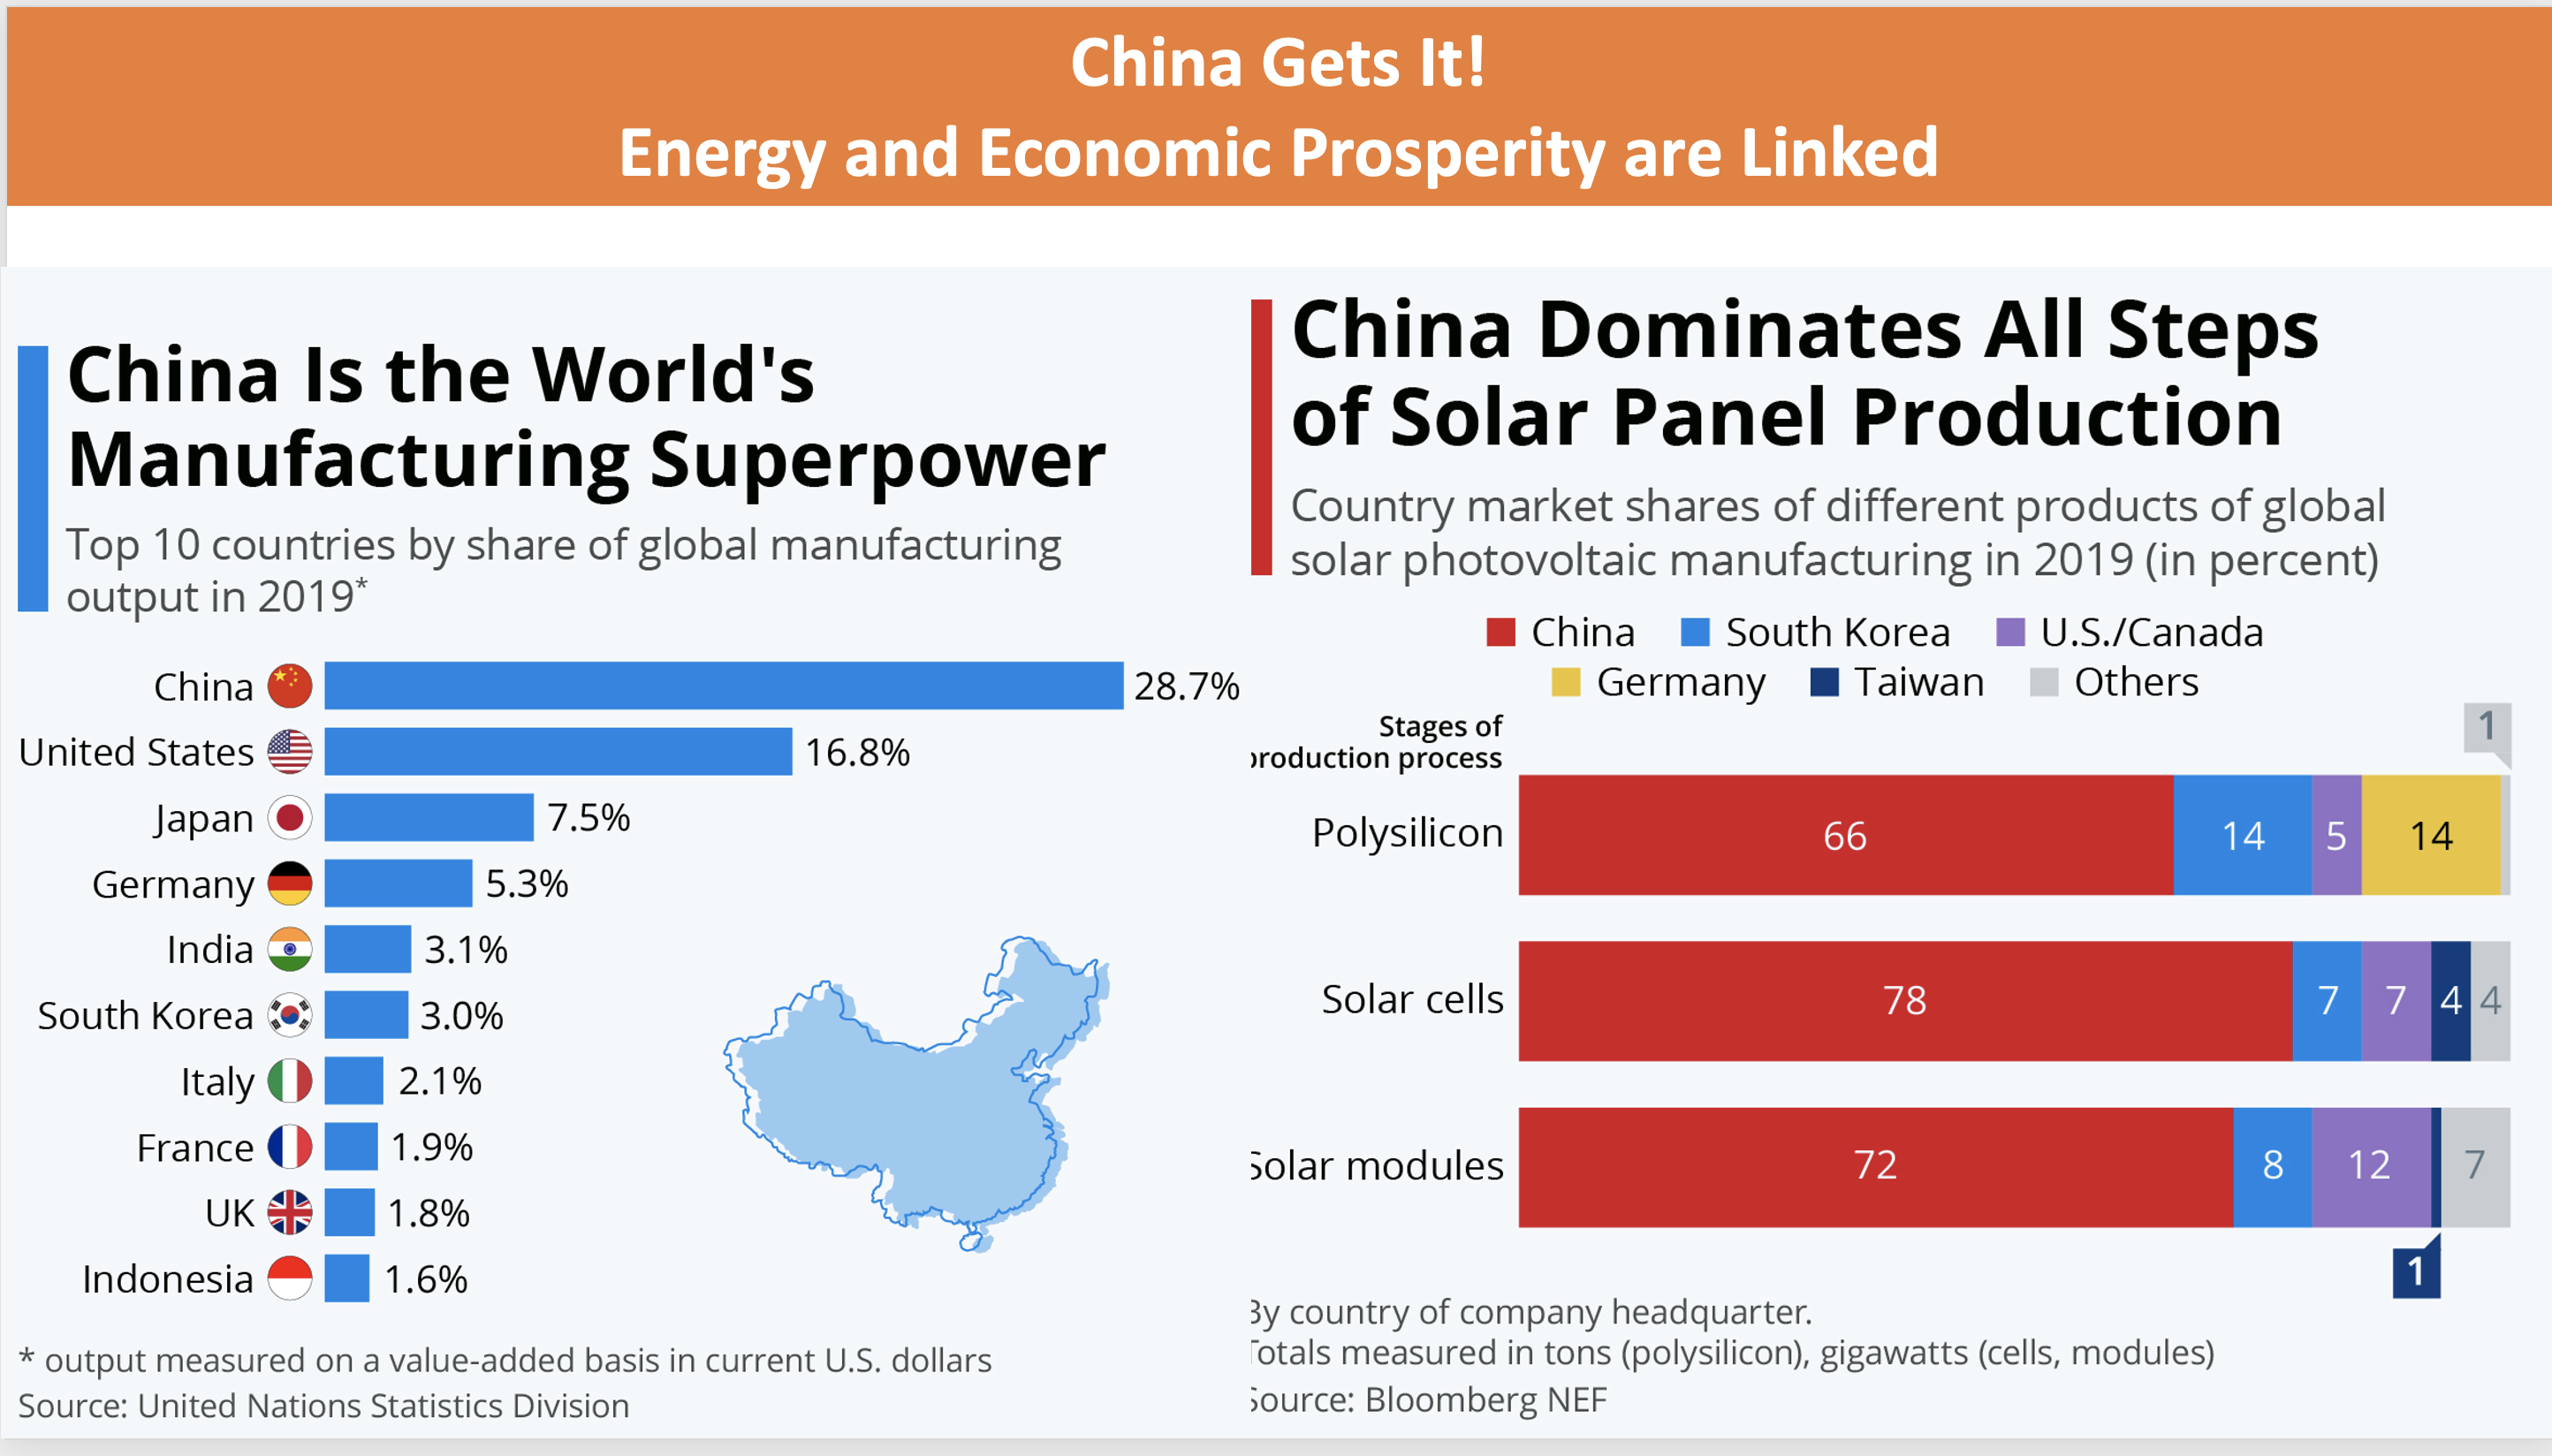
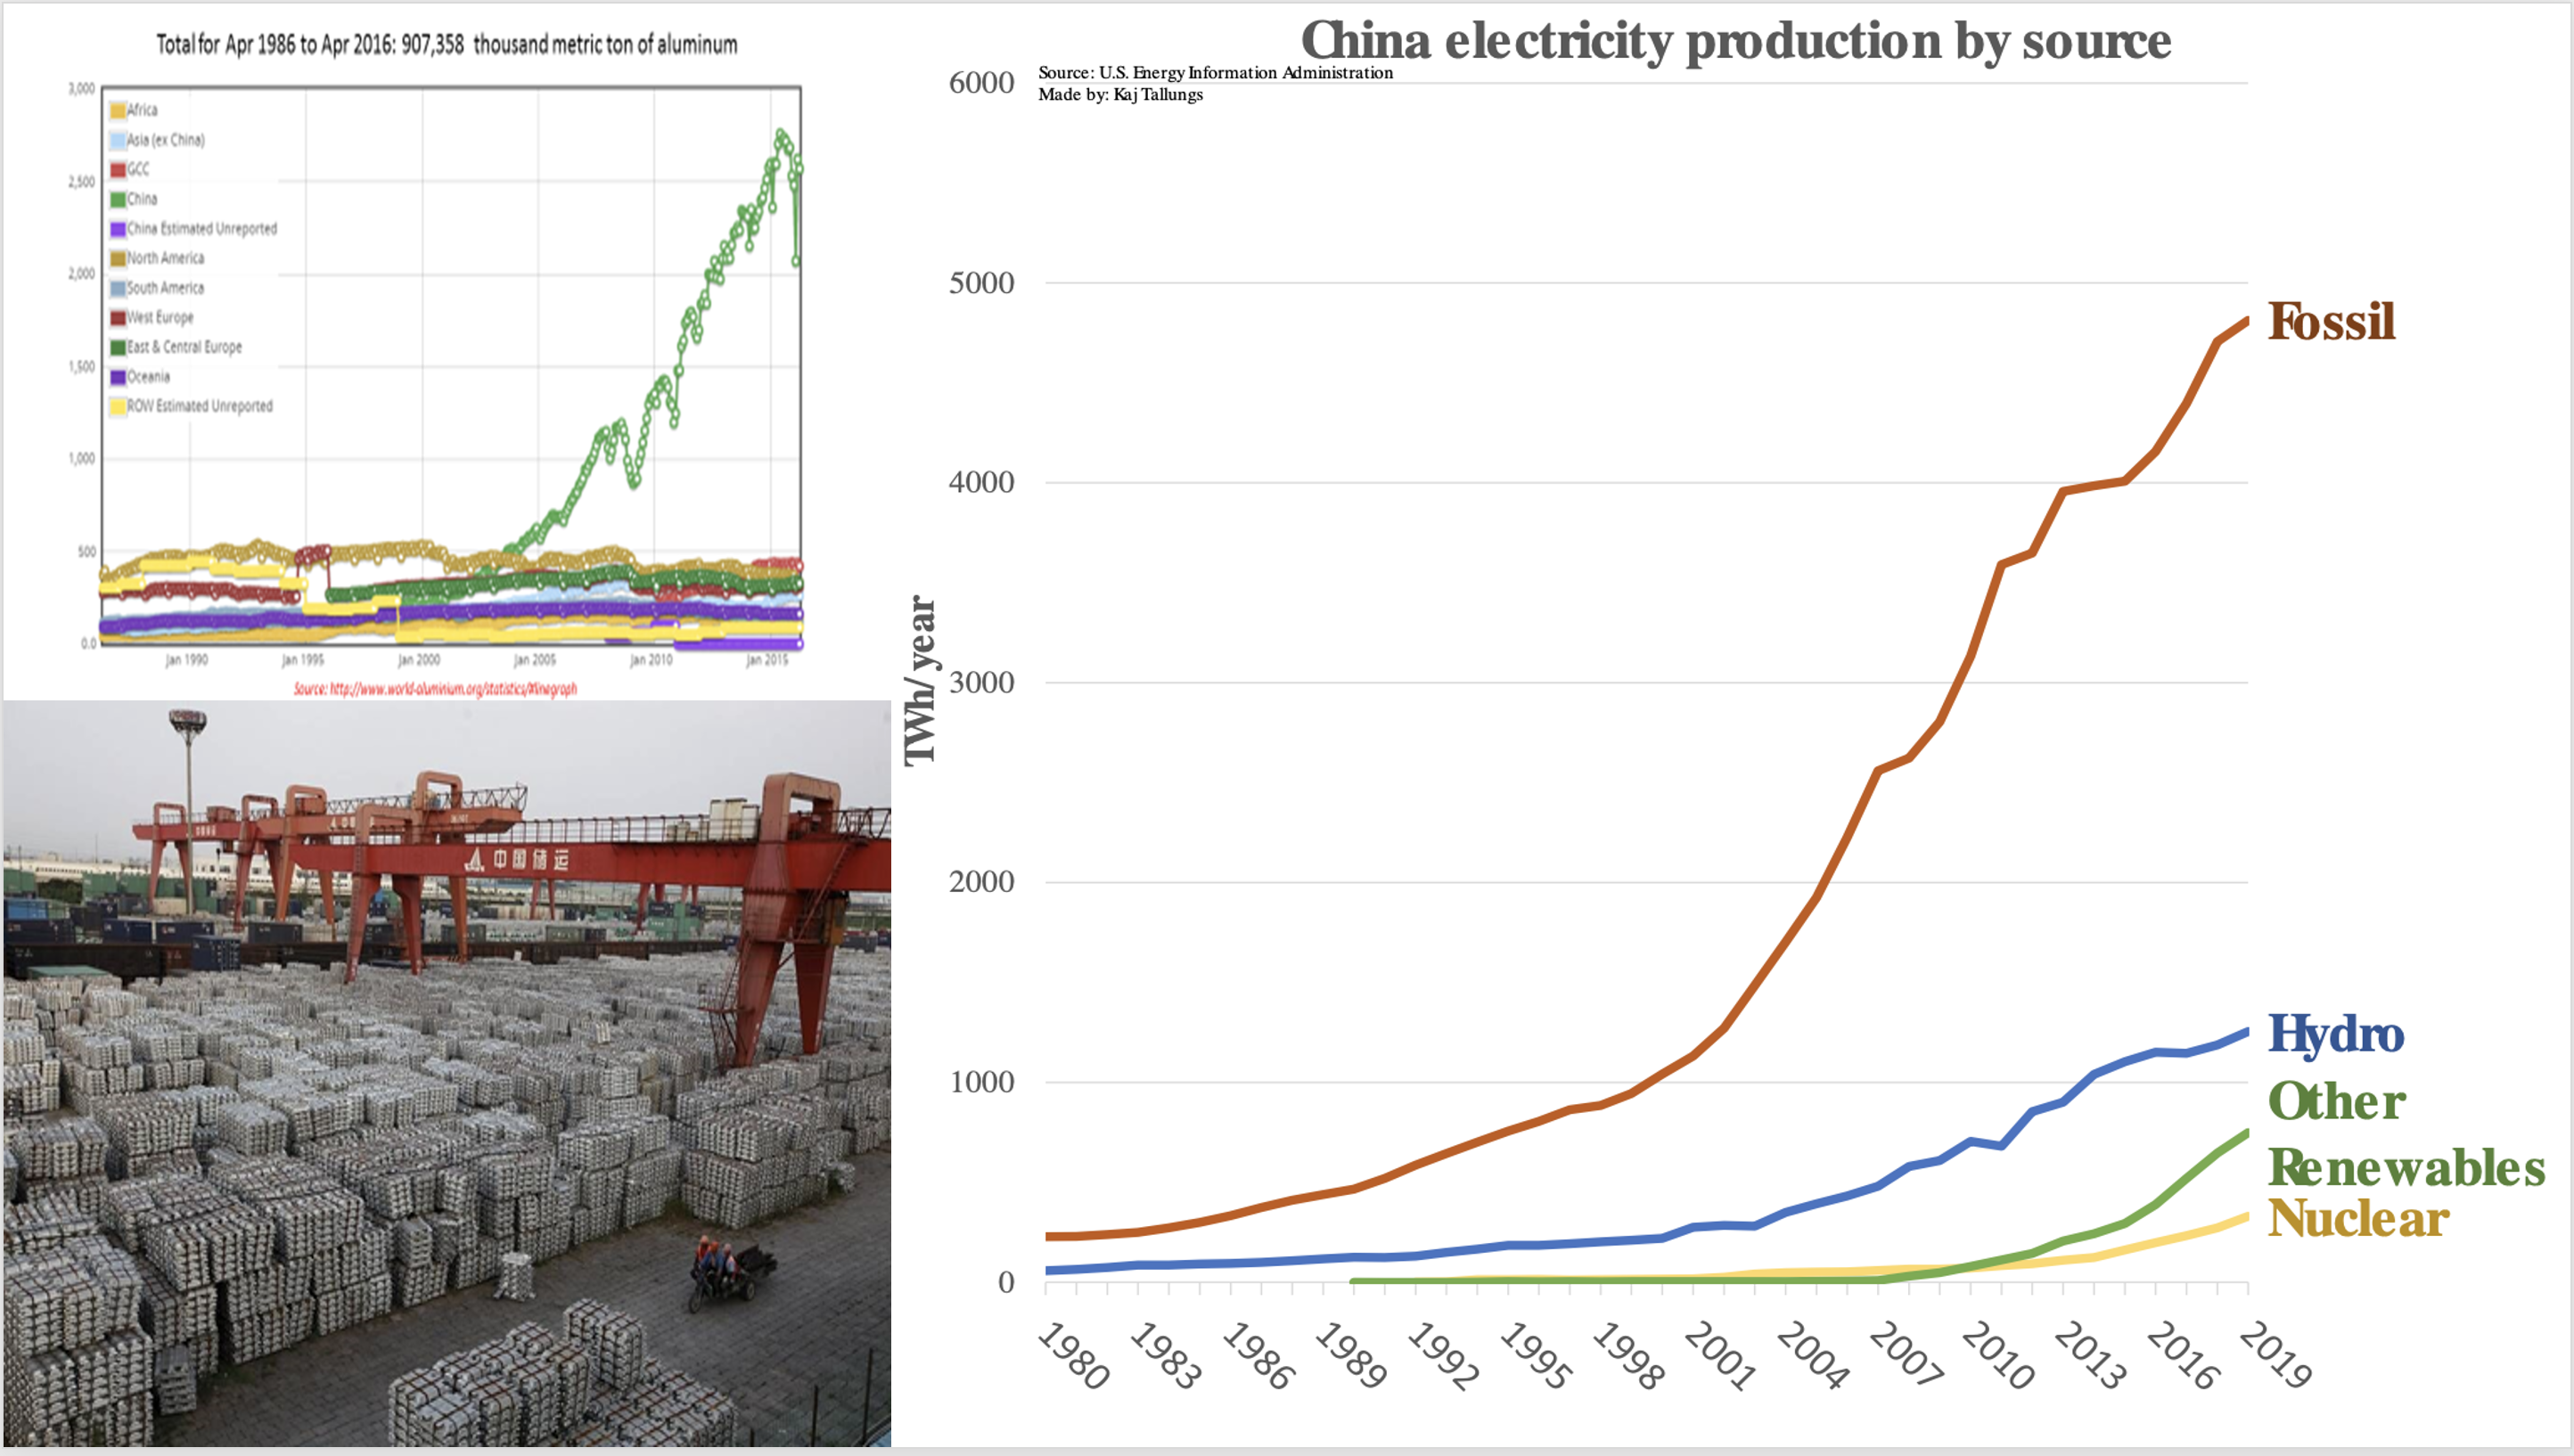
I will close with the fact that according to a report I saw in S&P Global, China has the four largest banks in the world. The relationship of energy use and economic prosperity cannot be denied. China built more power generation in twenty years than America did since Thomas Edison’s first Pearl Street Station was commissioned.
Vaclav Smil’s quote of “Energy is the Universal Currency” comes to mind.
China loves America’s Net Zero 2050 and the “Green New Deal” Maybe they even wrote them?

Dick Storm, September 16, 2021
