New Modern Coal Plants are Needed for Energy Security, Grid Reliability, Affordable Electricity Generation and Without Pollution, so let me explain some of the details of the equipment used to clean the flue gases and the progress made in cleaning the air since 1970
Short History of Air Pollution Control
The EPA was started in 1970, for good reasons of cleaning the air and water. Coal plants built before 1970 had no controls on sulfur emissions and particulate collection was only between 75 and 90%. Today nearly all of the sulfur and particulates are collected. I have been a strong critic of the EPA since the “War on Coal” began during the Clinton administration with the beginning of weaponization of government rules such as “New Source Review”. However, in 1970, the EPA was needed to clean our air and water.
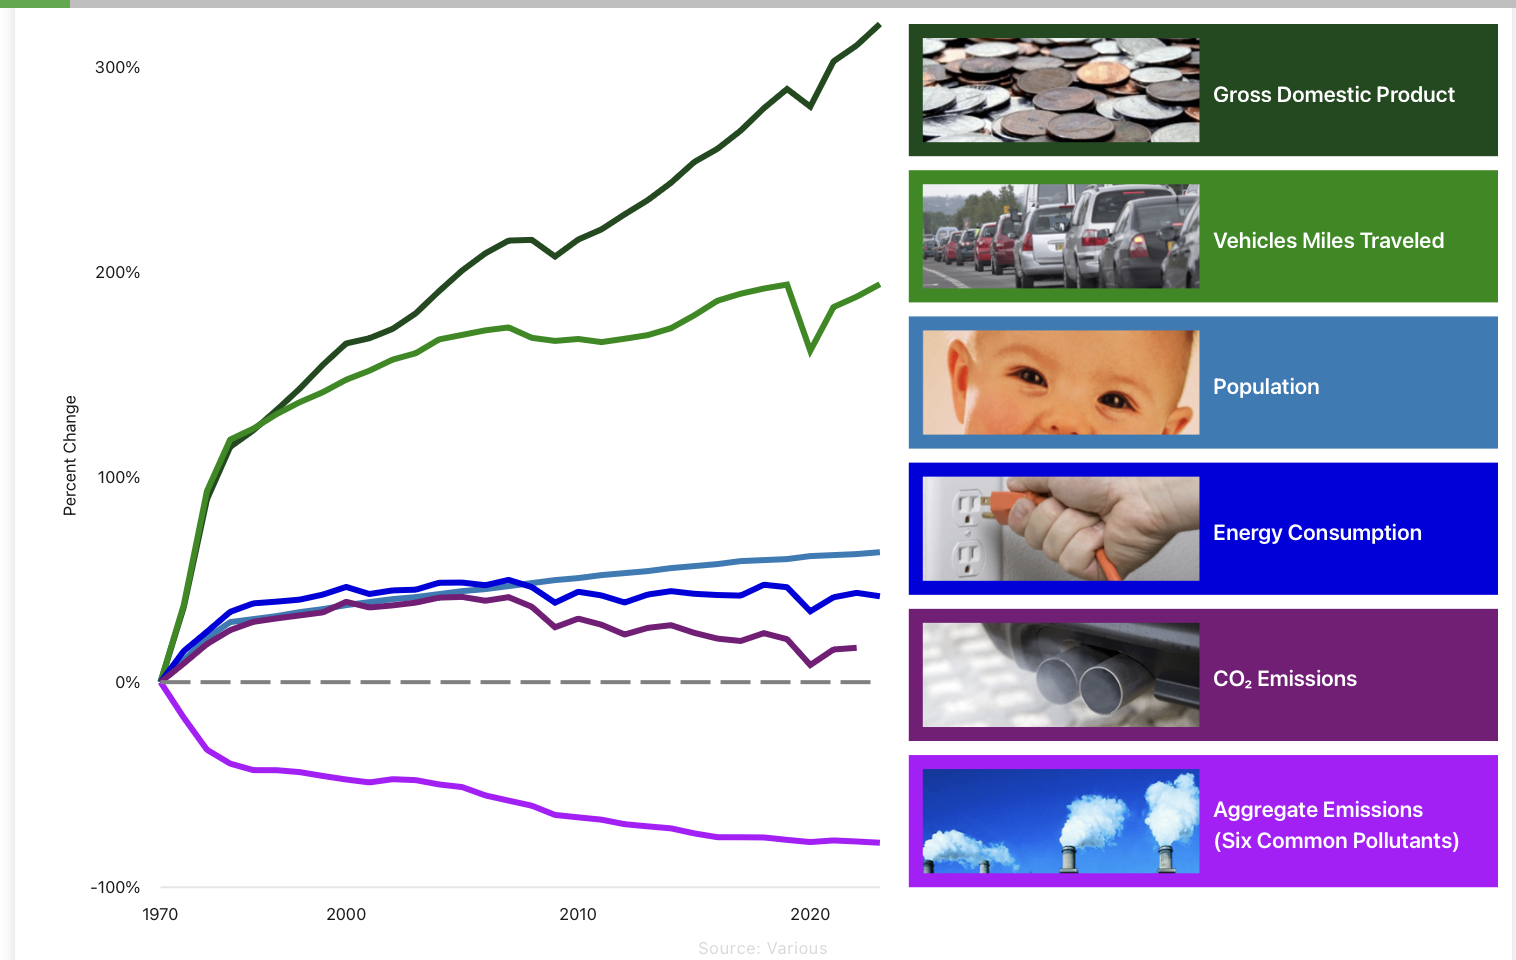
Shortly after promulgation of the EPA the major air pollutants were identified that needed controls. These pollutants are sulfur, particulates, VOCs (volatile organic compounds), carbon monoxide, lead, oxides of nitrogen and ozone. Since 1970 the EPA has measured and reported the progress of cleaning the air and this progress of controlling the true pollutants is shown on the chart below.
Notice the increases since 1970 in population, GDP, energy use and miles driven. These all trended up, whereas the pollutants trended down 78%. This is a story that needs to be told.
We Figured Out How to Make Coal Plants Clean and Then the EPA was Politicized & Weaponized to Kill Them
The perfection of advanced flue gas cleanup occurred about the same time that the EPA became a political weapon. In other words, the air pollution industry succeeded in cleaning all of the harmful pollutants out of the flue gas stream just as the Obama administration declared CO2 a pollutant, which it is not.
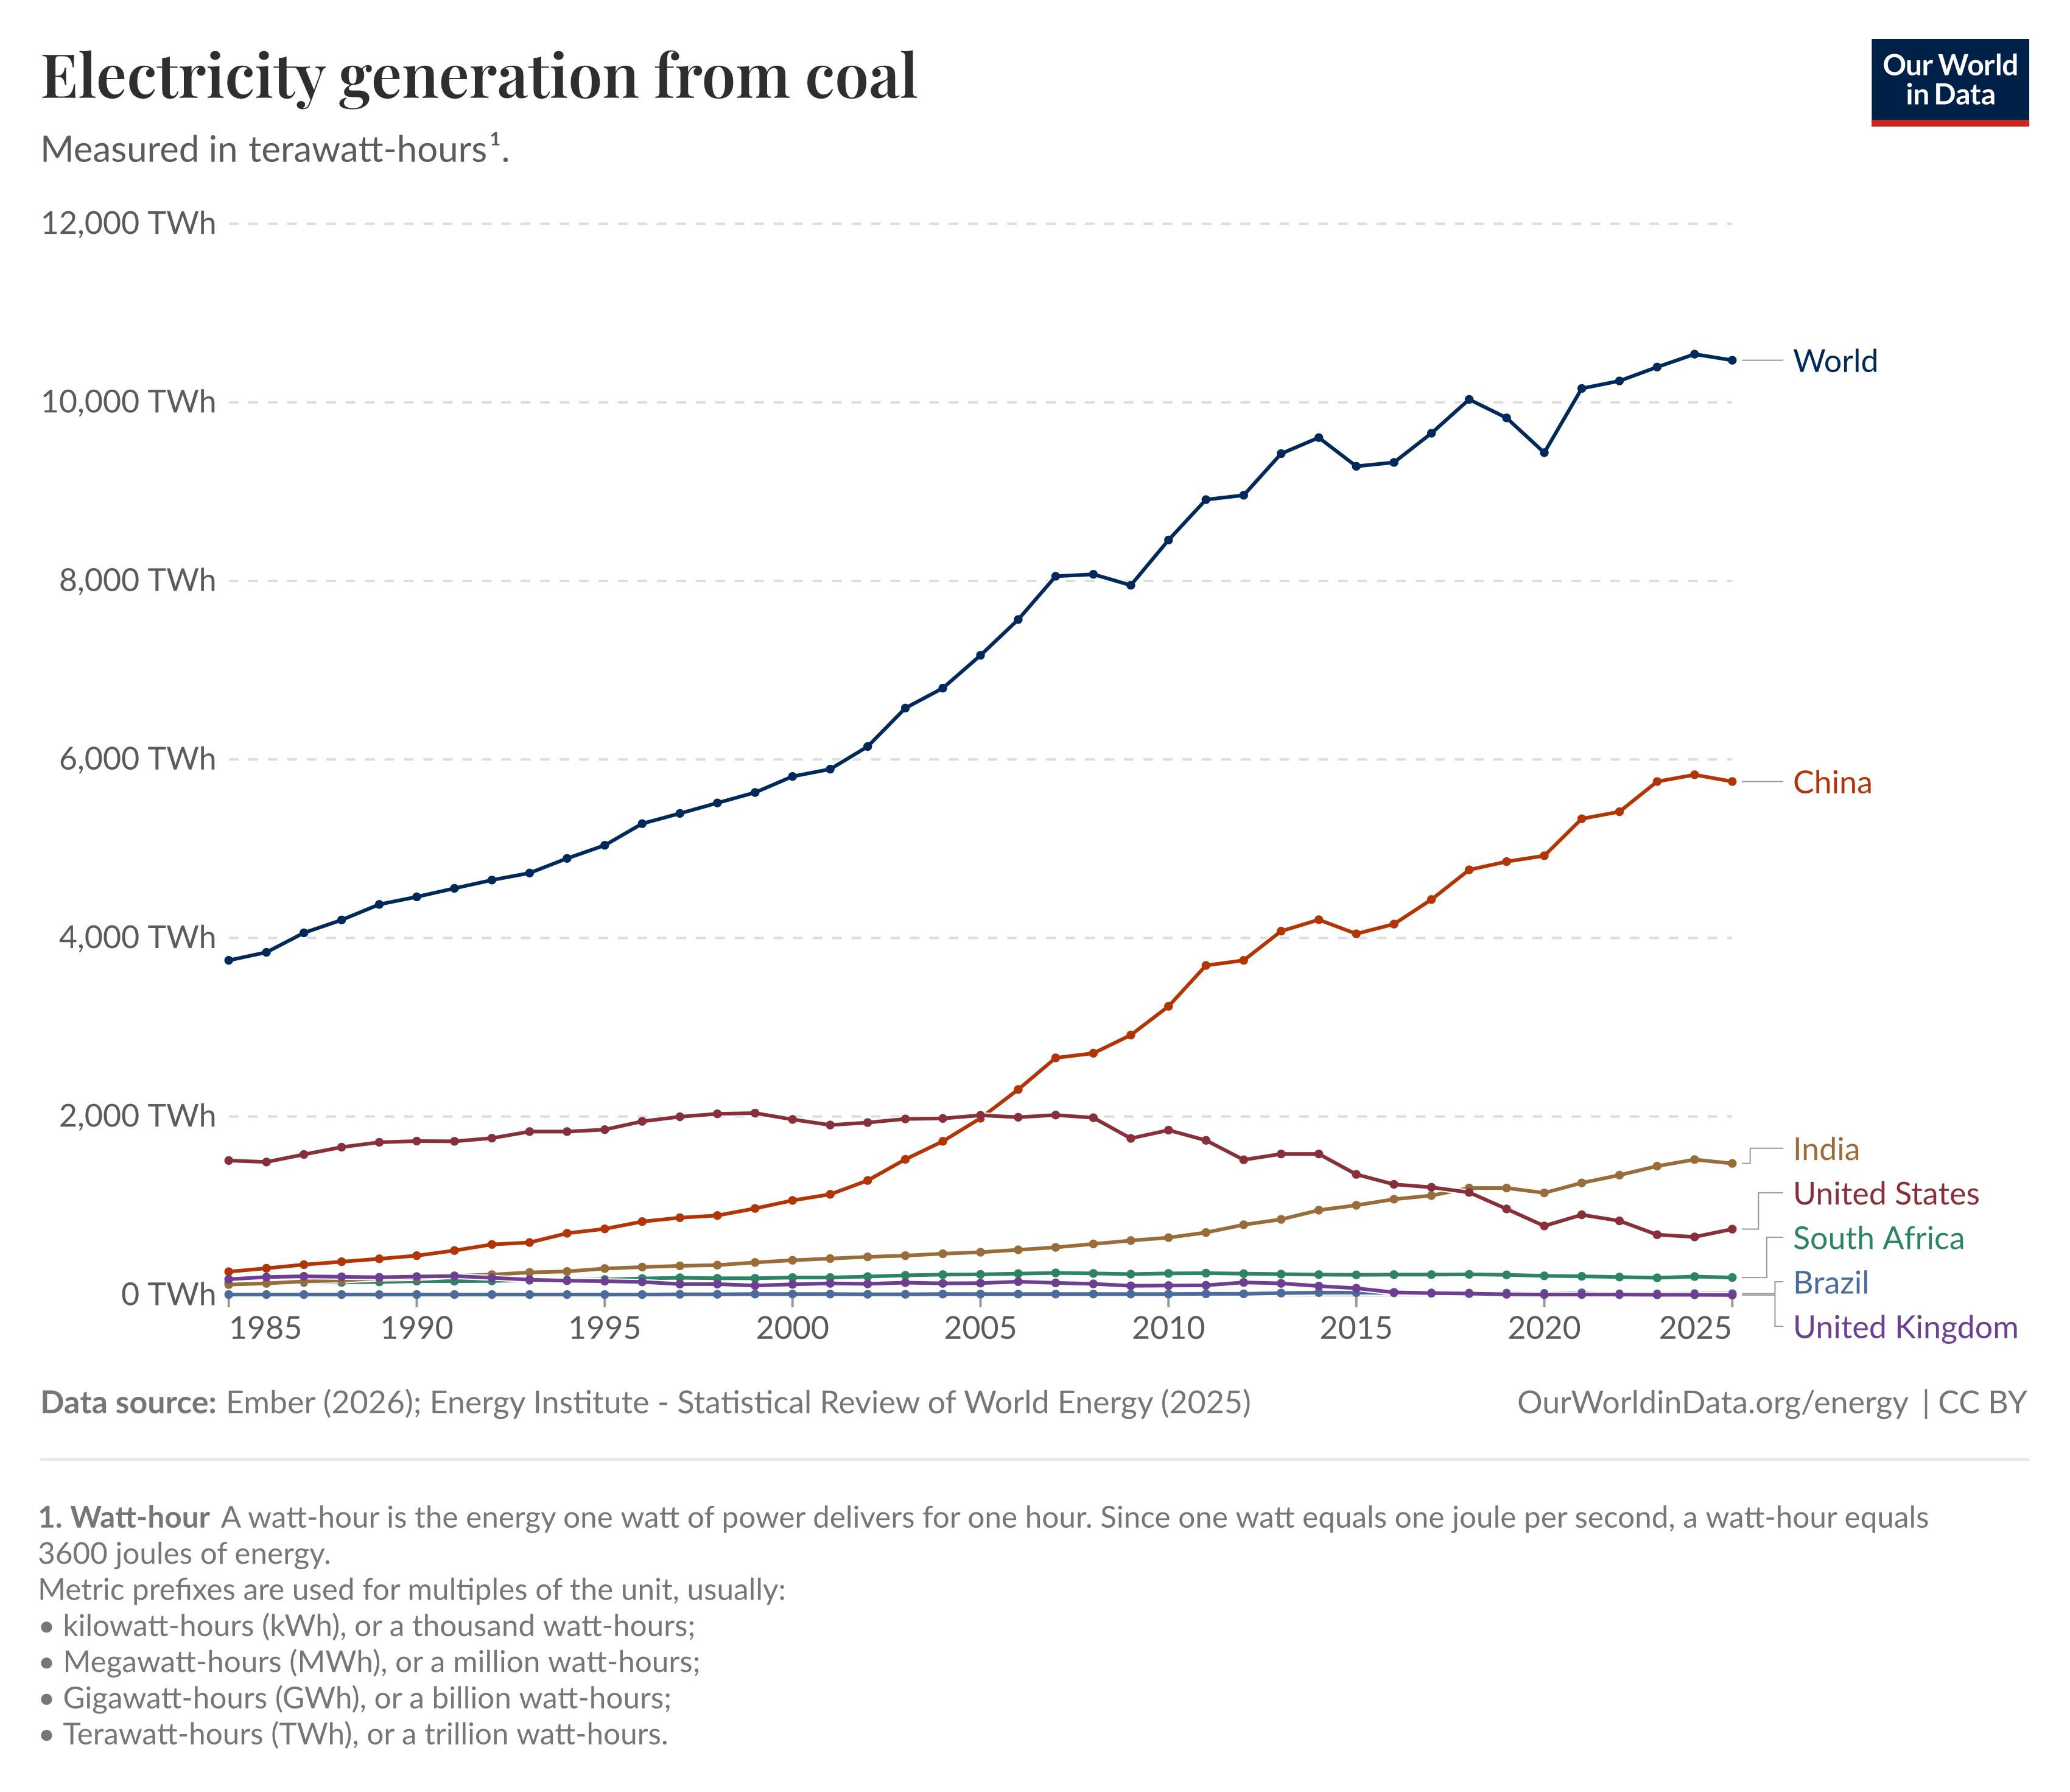
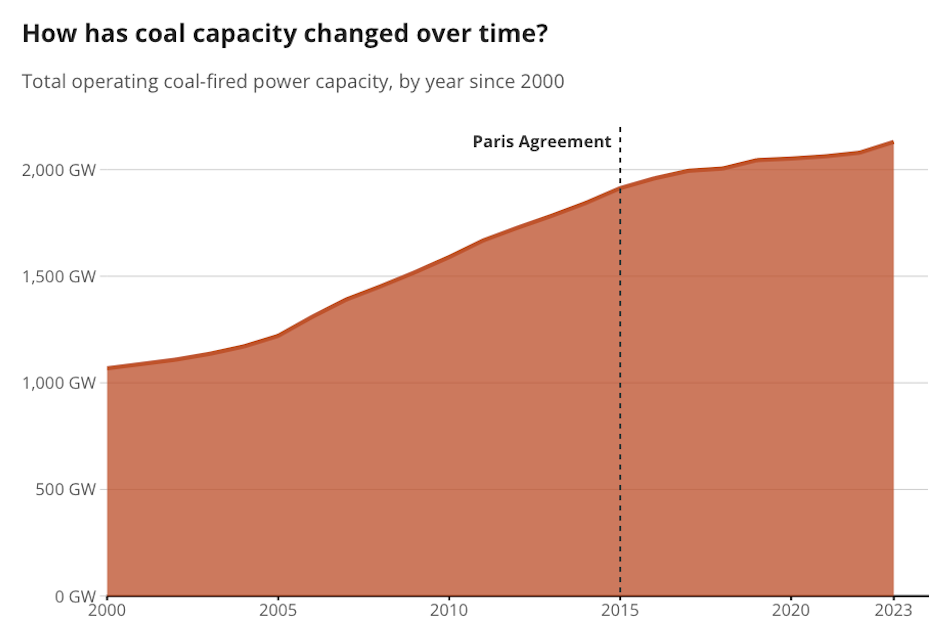
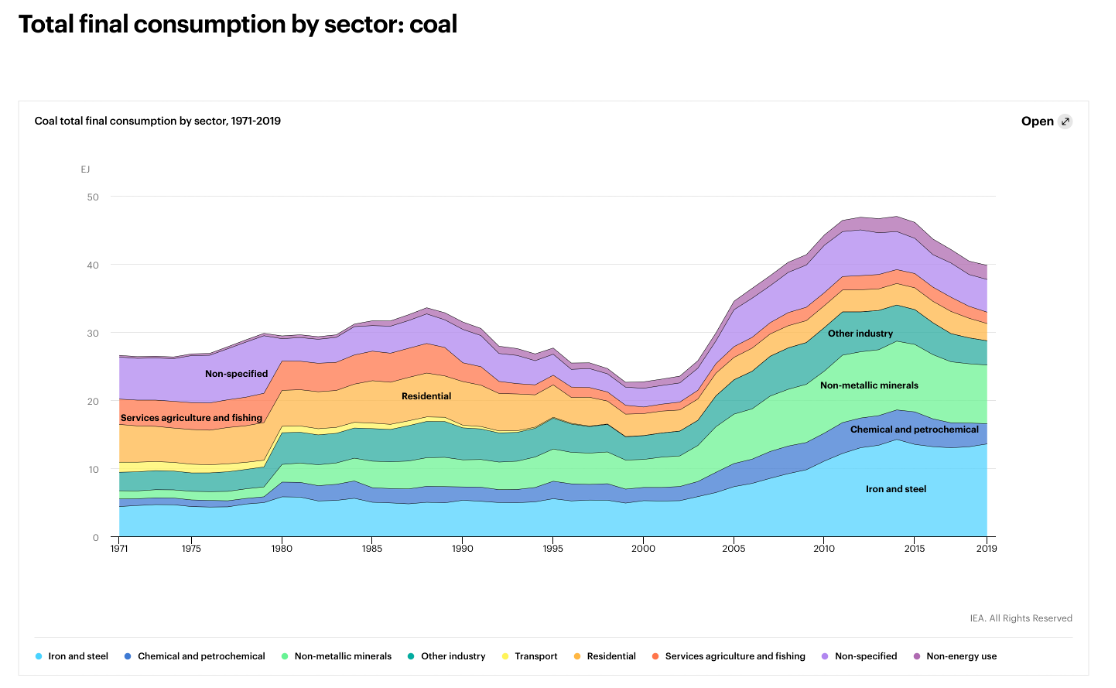
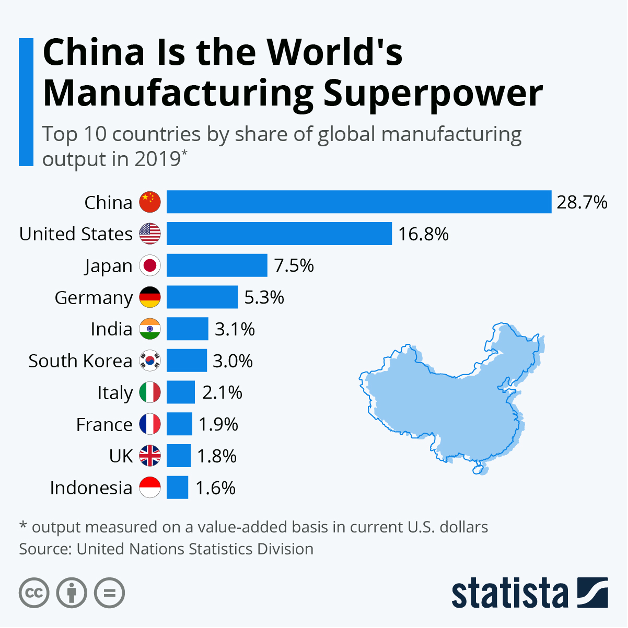
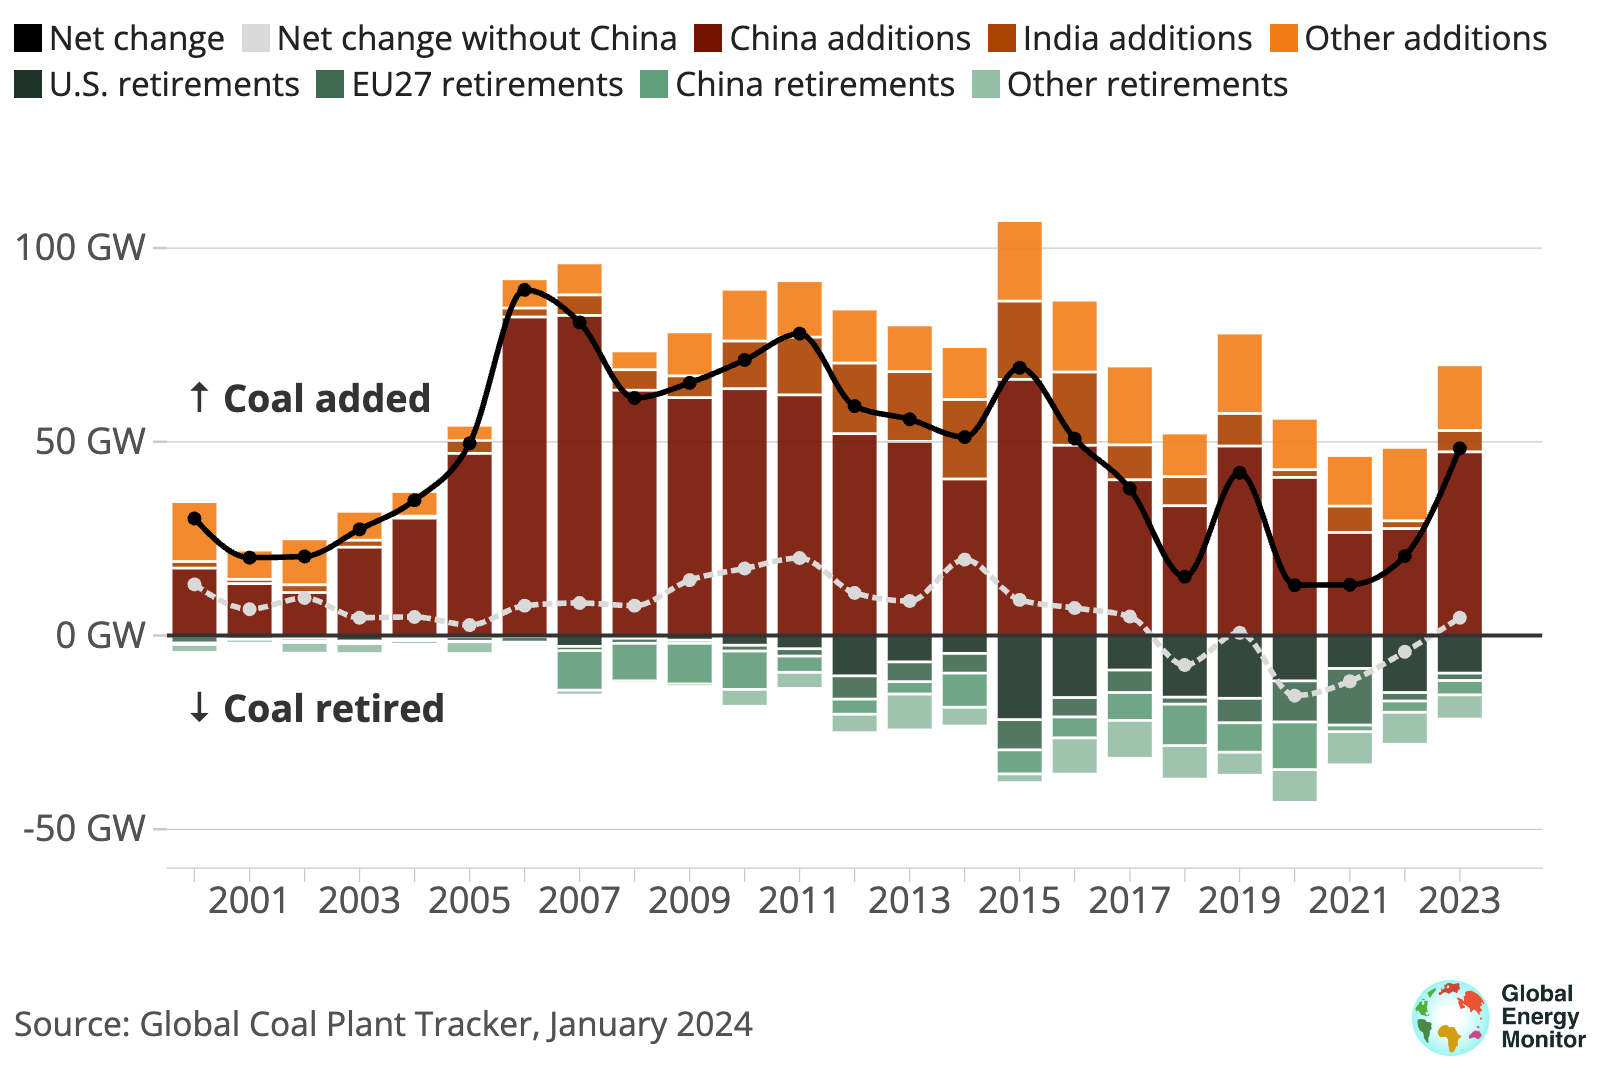
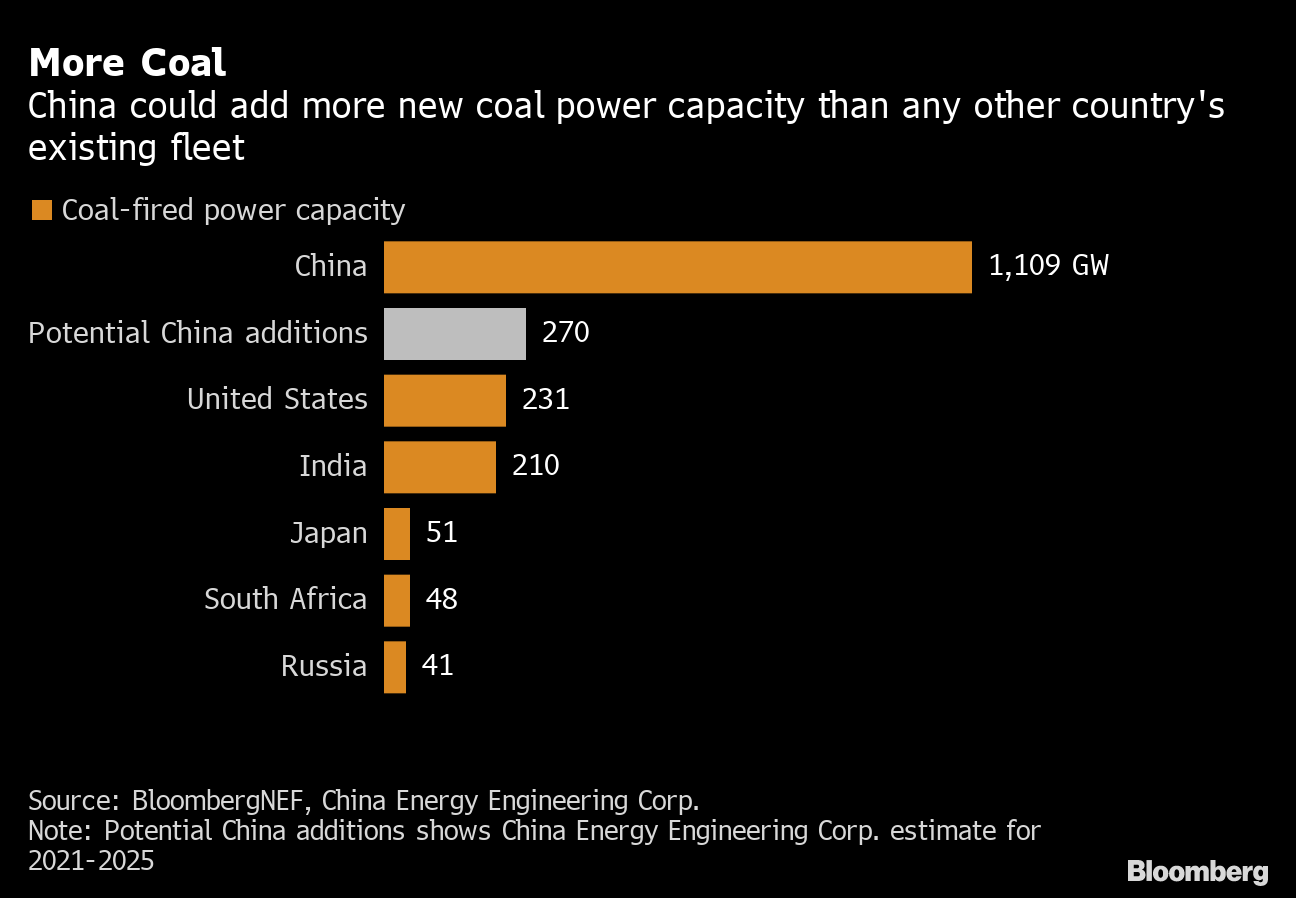
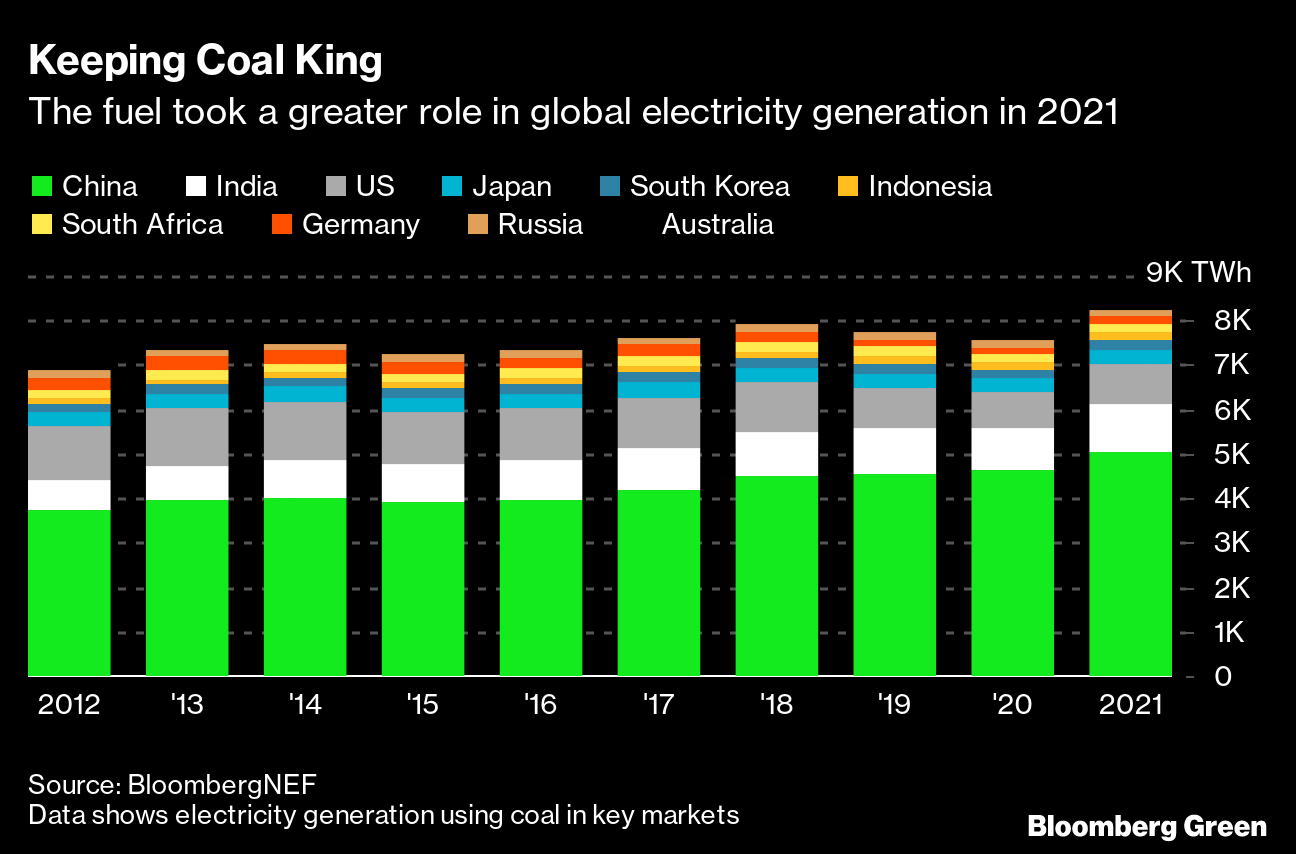
This attempt to kill reliable, affordable, Dispatchable and on-site energy storable coal power has been very effective. Over half of the coal power plants in America have been shut down while the largest fuel source for power generation in the rest of the world is still coal and the coal use continues to rise.
Clean Coal Combustion in a Pulverized Coal Power Plant
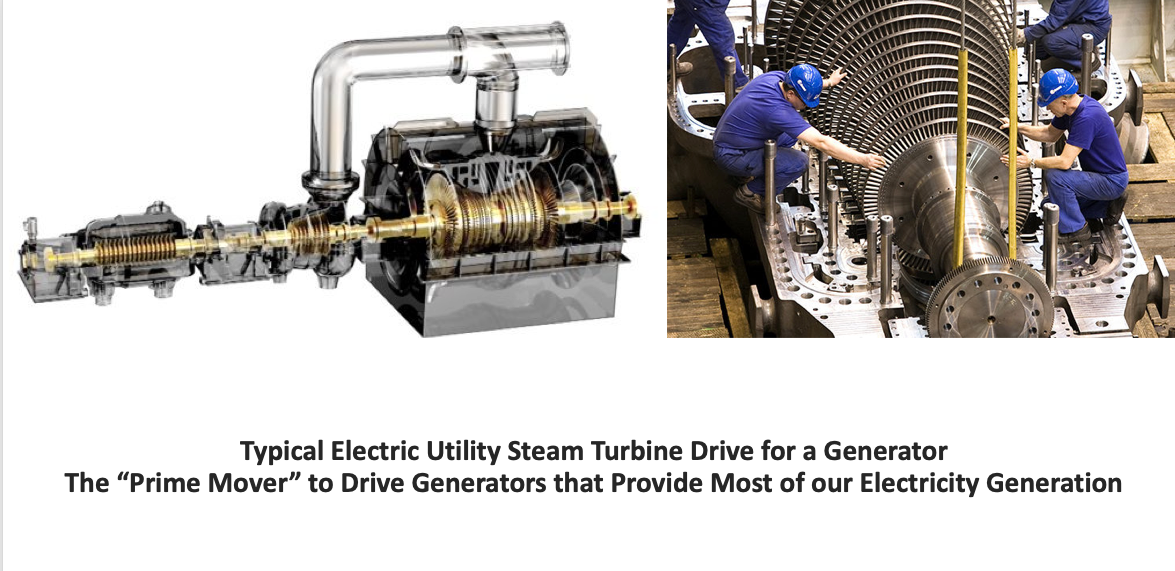
Most of the coal power plants in the world use the pulverized coal firing method. I described the Zimmer coal plant in a previous article. “The Magnificent Heat Engines that Society Depends On”.
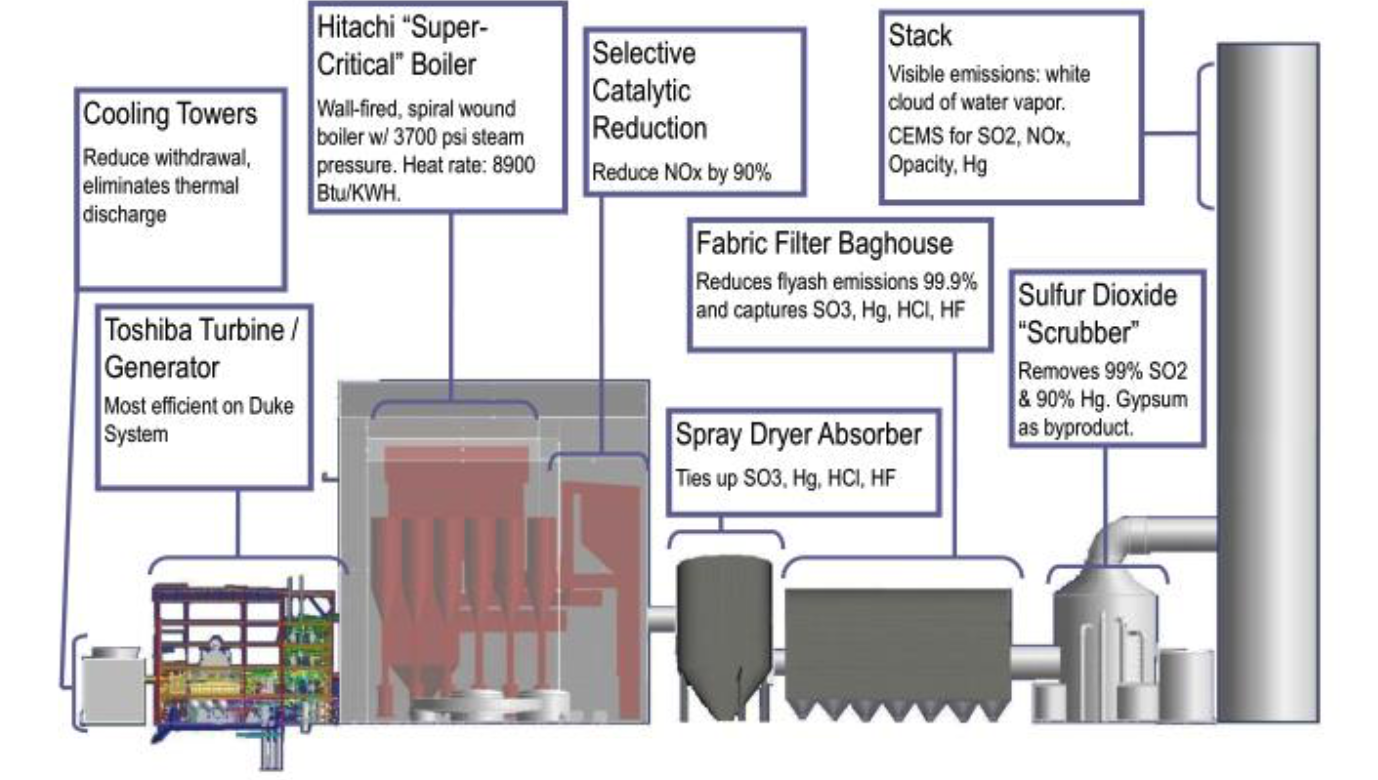
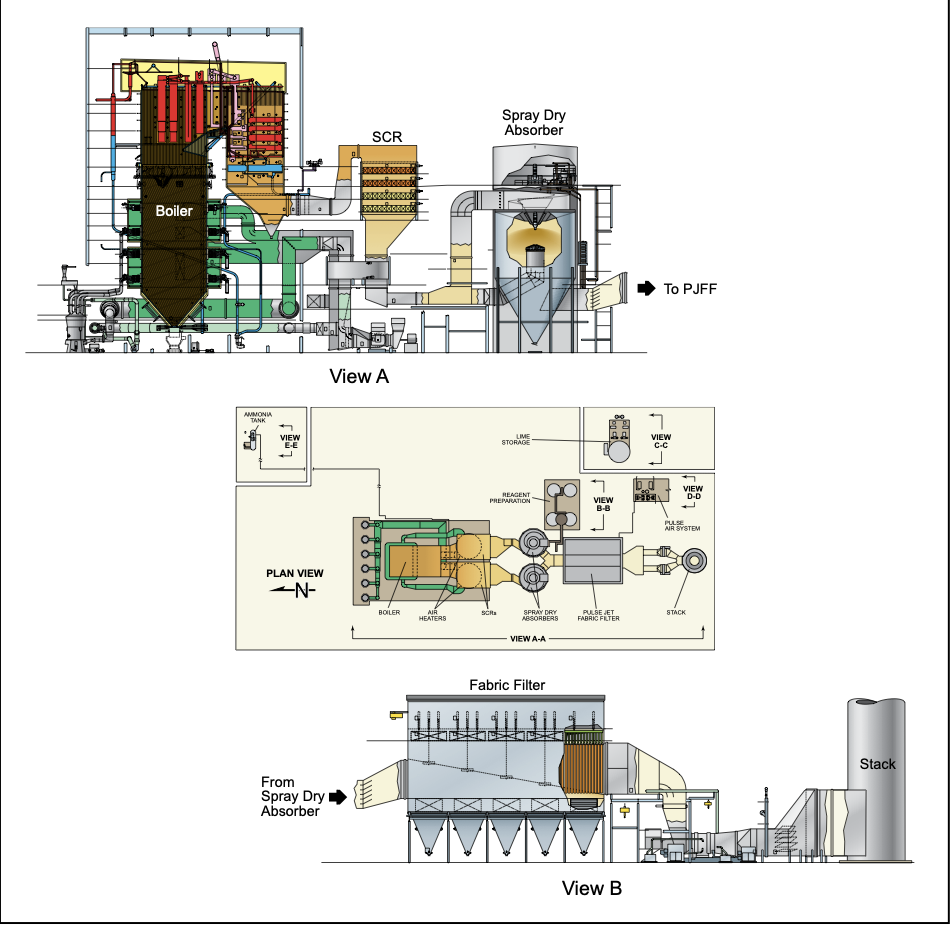
There are other forms of coal power including CFBs (Circulating Fluidized Beds), IGCC (Integrated Gasification, Combined Cycle), stoker firing and cyclone firing. PC Firing (Pulverized Coal) is the most common method used and that is what I will discuss with regard to the exhaust gas (flue gas) cleanup systems. Here is a typical schematic flow diagram of a PC steam generator and the flue gas flow path to the stack.
The flue gas cleanup equipment in the schematic is shown to approximate scale. The power generation equipment is dwarfed by the size of the flue gas cleanup systems. So is the number of employees required to maintain the chemical processes at the backend larger than those needed to operate and maintain the power generation equipment. Yes, the flue gas cleanup systems are expensive, but once built, the electricity production costs are mostly fuel. Thus, as natural gas prices rise, such as with the Middle East crisis, coal mined in America can be used competitively for power generation less expensively than natural gas fuel for power generation. All of the economic and operational advantages of coal power without pollution.
How the Pollutants are Controlled
Lets take a look at the pollutants one at a time and take a look at how they are lessened or removed from the flue gas stream.
Sulfur Removal
Sulfur emissions were the main cause of acid rain and large coal power plants were the single largest source of atmospheric sulfur emissions. Corrections began with the invention and deployment of FGD (Flue Gas Desulfurization) systems about 1978. Since 1978 the efficacy of FGD systems have advanced. Here below is a schematic of a wet scrubber which utilizes a limestone slurry to capture the oxides of sulfur into a calcium oxide slurry to create calcium sulfate, aka gypsum. The waste calcium sulfate is often utilized for fertilizer and for manufacturing wall board as a byproduct.
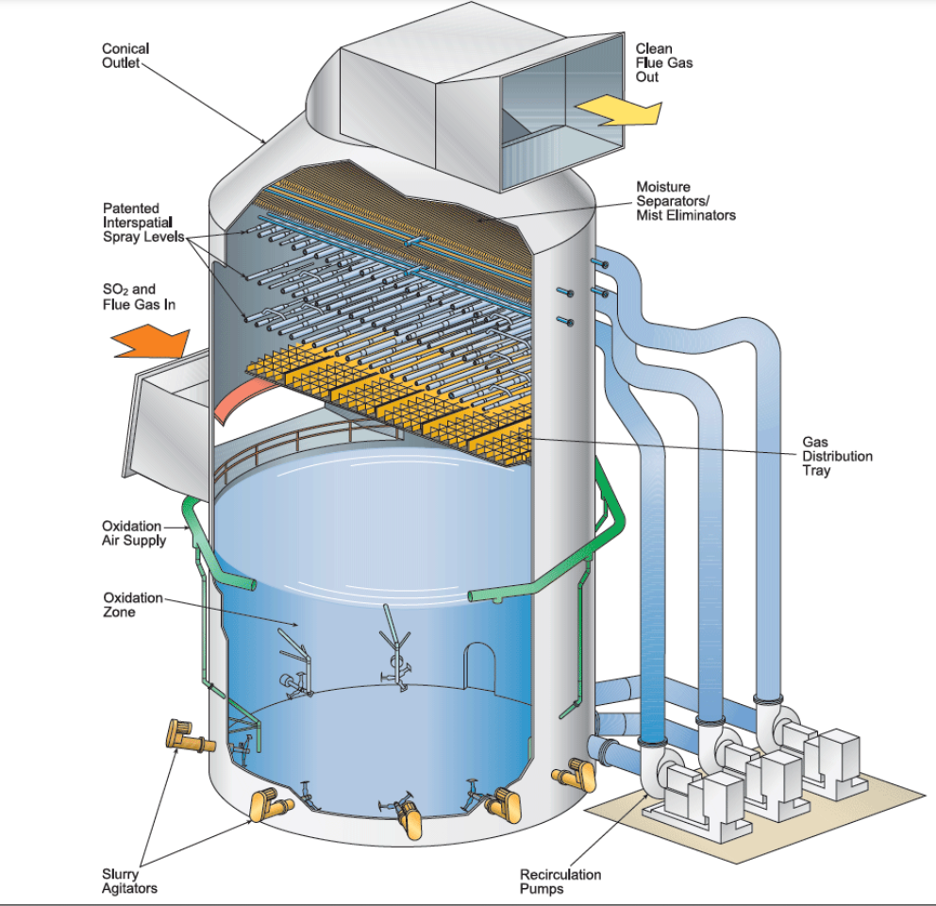
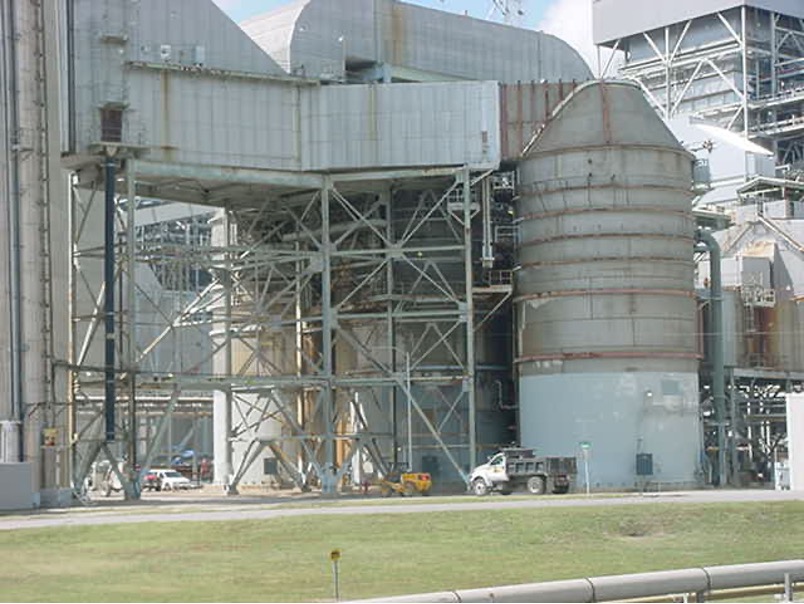
Here is a typical installation of an FGD scrubber
More commonly used in the most modern coal plants for sulfur removal is Spray Dryer Absorbers. These collect the sulfur in small droplets of limestone slurry which is then transported in the gas stream to a Baghouse. The ash + limestone is collected on the surface of fabric filter bags and collected in hoppers beneath.
Particulates Removal
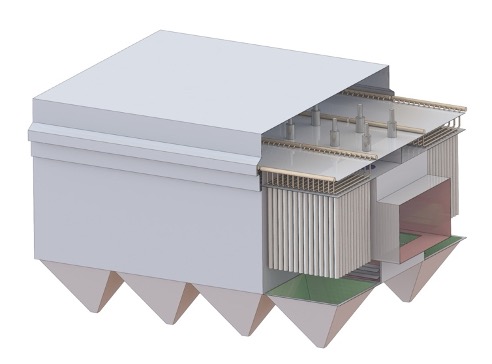
The equipment to collect particulates are Fabric Filter Baghouses. These have certain advantages, especially when used with SDAs (Spray Dryer Absorbers) because of the moist nature of the collected flyash, sulfur and lime slurry can continue to react with oxides of sulfur in the filter cake. Here is an illustration of a Baghouse, followed by a photo of an actual Fabric Filter Baghouse installed on a 650 MW coal plant.
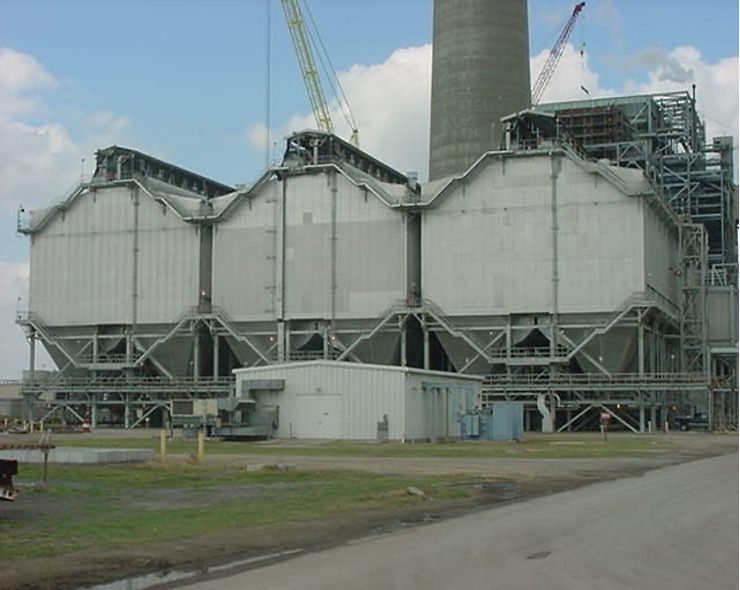
The operating principle of a Fabric Filter Baghouse is basically the same as a home vacuum cleaner, where the dust is collected in a filter cake on the fabric surface. The filter cake then breaks up and falls by gravity to the hoppers below where it is then pneumatically removed and transported to ash storage.
Oxides of Nitrogen
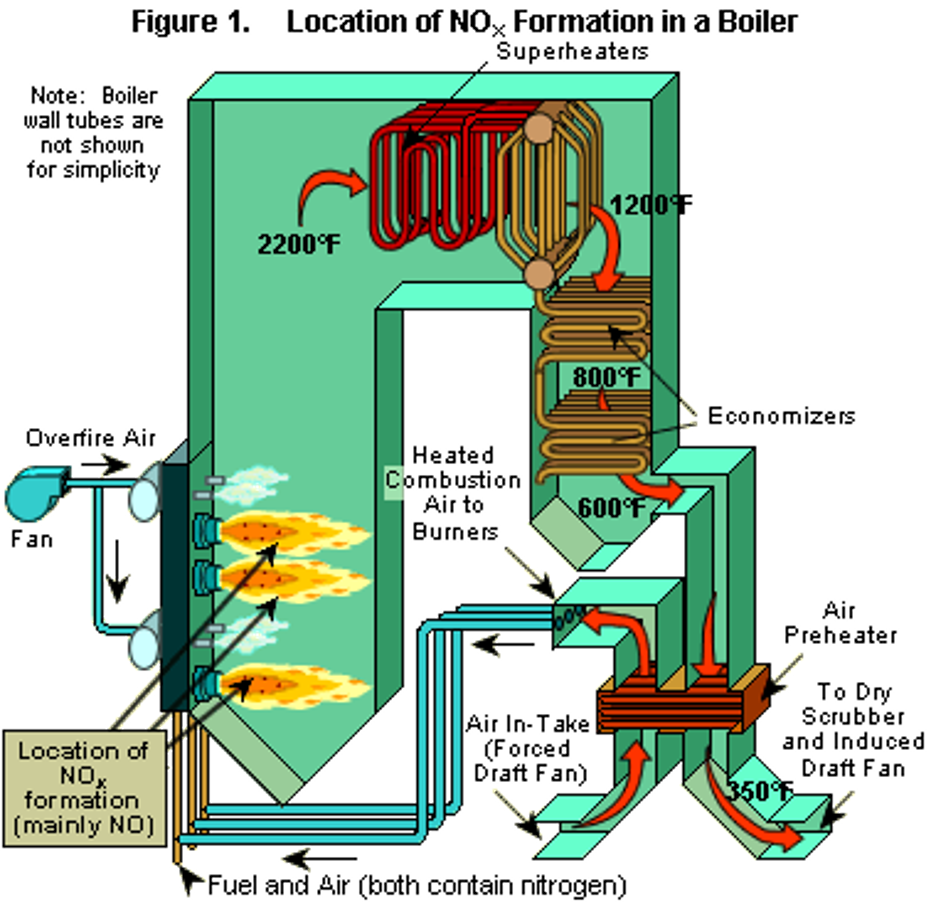
Combustion of coal creates oxides of nitrogen from both the nitrogen in ambient air and from the nitrogen that is trapped in the coal fuel. If uncontrolled the NOx (an expression used to refer to all oxides of nitrogen) can contribute to ground level ozone, smog, acid rain and deterioration of visibility from photochemical smog. Therefore, oxides of nitrogen are drastically controlled to very low levels through a combination of modern low NOx combustion systems applied to the furnace. Then also by use of post-combustion SCRs (Selective Catalytic Reactors). The following two figures illustrate modern approaches to NOx controls.
First, Furnace solutions are low NOx burners combined with over-fire air systems to stage combustion.
Then, post combustion, SCRs (Selective Catalytic Reactors) are used to remove most of the remaining oxides of nitrogen. An illustration of an SCR is shown below.
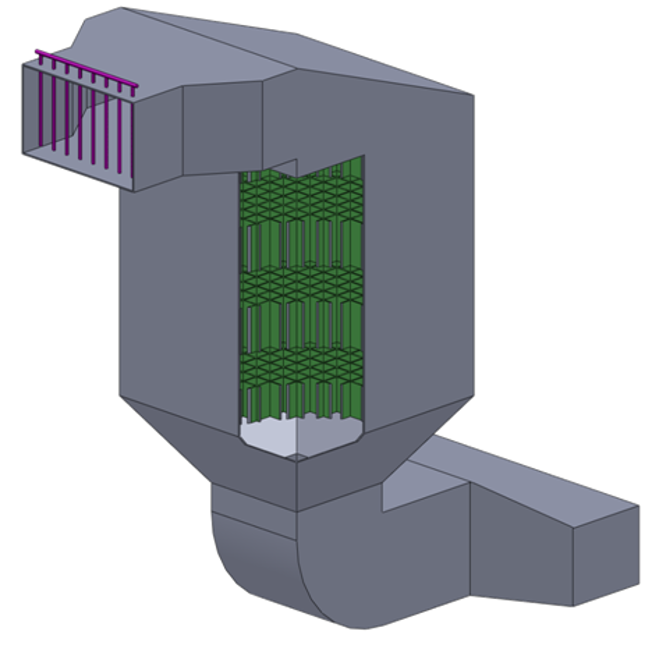
The catalyst inside the SCR is reactive honeycomb ceramic as shown below.

Removal of Heavy Metals including Mercury
There are trace amounts of heavy metals in coal ash such as arsenic and mercury, Most of these are removed with the FGD (Flue Gas Desulfurization) system. Sometimes, if the mercury is above limits activated carbon injection is utilized to absorb and collect the mercury.
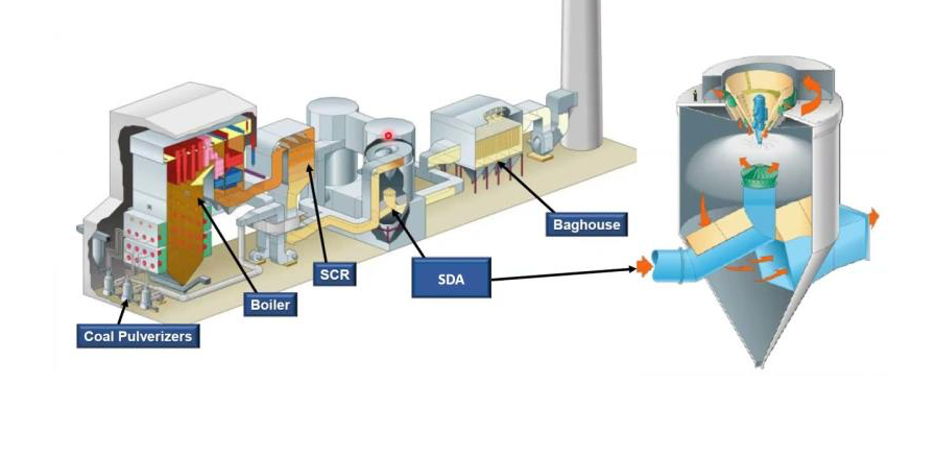
The Integrated Emissions Control System
The systems described above work together to collect or control the ash particulates, sulfur, NOx and mercury. One version of an integrated emissions control systems is shown below.
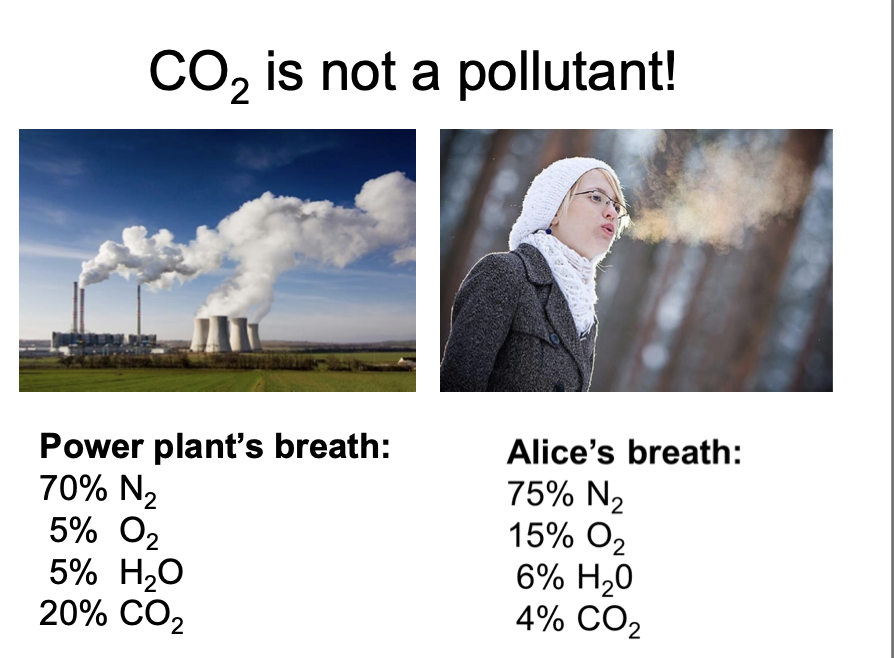
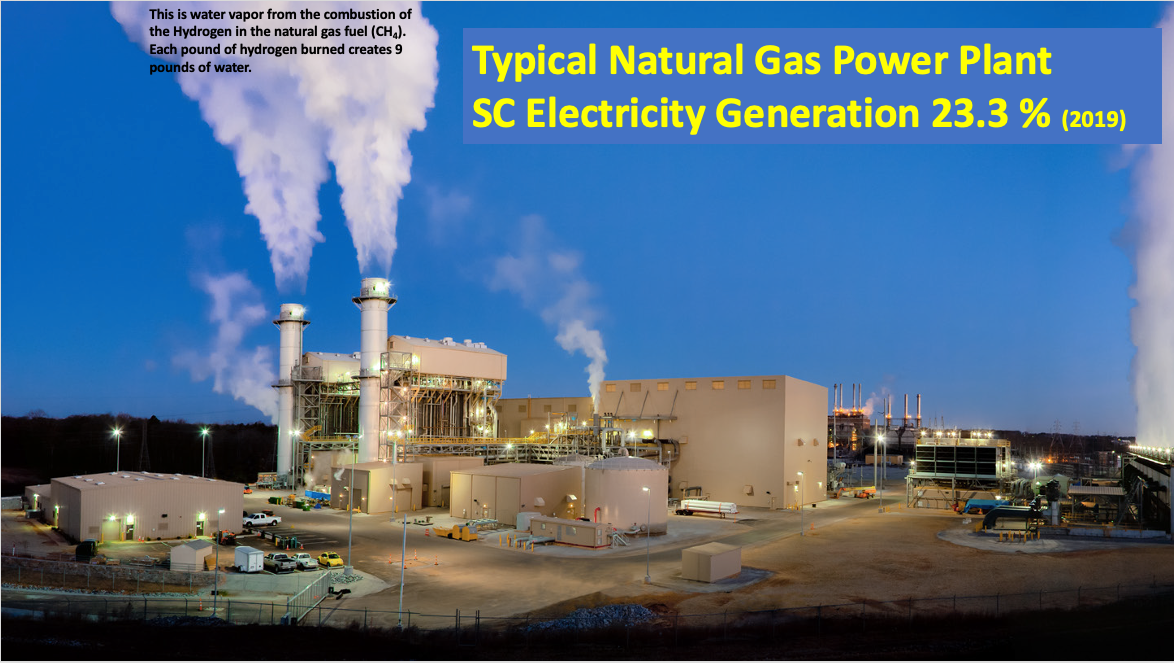
Stack Emissions are Harmless Water Vapor and CO2
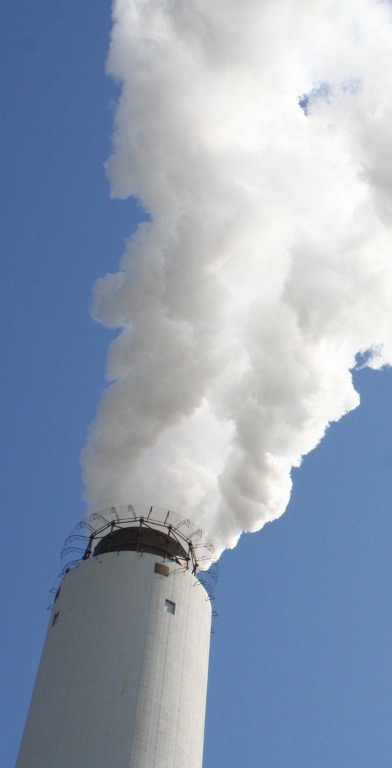
The stack plumes are mentioned by those critical of coal power because they are so visible from far away. The fact is that the stack plumes are harmless water vapor, CO2 , nitrogen and oxygen not that much different than the exhaled breath of a human. Dr. William Happer gave a presentation a few years ago using that very example. Dr. Happer’s presentation is here.
Summary
Back in 1970 the boiler island comprised a steam generator and the fuel burning equipment. Minimum backend flue gas cleanup equipment was installed. There was no treatment of oxides of sulfur. Since 1970 the flue gas cleanup systems have advanced to huge chemical processing plants that require more manpower, maintenance and attention than the “Power Block” including the power generation equipment, steam generator, steam turbine and auxiliaries. The result is shown on the first chart above which shows the progress since 1970 in cleaning our air. The equipment for removal of harmful pollutants has been invented, perfected, installed, proven and continues to be commercially available. Another example is the John Turk Plant in Arkansas. This was POWER Magazines “Plant of the Year” in 2013 and is shown below. This is from the B&W success stories. https://www.babcock.com/home/products/spray-dryer-absorber-sda
Conclusions
- Coal has been wrongly demonized by NGOs, MSM, Entertainment, wealthy individuals and enemies of the U.S.
- Politicians have been duped into believing the “Manmade Global Warming Narrative” and that shutting down coal plants will make a difference. It won’t.
- Regulations and Laws have been wrongly applied to shut down coal plants and the coal industry
- Many of America’s elected officials have implemented policies that are Self-Sabotaging the once most reliable electric Grid in the world
- Utility executives are just as bad as the indoctrinated public and have chose to follow the “Easiest path” to Bulk Power Supply. That path is, install lots of unreliable solar and wind and then back it up with natural gas turbines. Why? Because generating Bulk Power from coal fuel is complicated, expensive and simply harder to do. It takes hard work to overcome public resistance, more capital and more employees. It is simply a lot easier to take the renewables + CCGT path rather than the path of least cost, most reliable generation. Call it hitting the “Easy Button” But it is NOT best for America!
- The De-Regulation of electricity in the 1990’s has absolved most Electric Utilities of Accountability to construct the needed Dispatchable electricity generation capacity. Before De-Regulation each Regional Utility planned for growth to match needed Demand with available and affordable generation capacity.
- It costs much more Capital to “Burn Coal than to Mine it”
- The general public Energy IQ is very low. So is the Energy IQ of most politicians.
- The possibility of unreliable electric service is possible due to decades of public indoctrination
- The largest need today in Energy and Electricity Generation is better energy education of the public
Yours truly,
Dick Storm, May 14, 2026
References and Information for Further Reading
- CO Coalition References/Resources: https://co2coalition.org/media/
- Mathew McKean, Frontieras North America, article on the relationship of coal and Food production, May 2026: https://www.frontieras.com/insights/they-killed-american-coal-china-kept-theirs-now-american-farmers-are-paying-the-price-and-frontieras-is-the-answer?ss_source=sscampaigns&ss_campaign_id=6a0325f4634cd753b5fab061&ss_email_id=6a0326cf8cdc8d55bfb4c844&ss_campaign_name=They+Killed+American+Coal.+China+Kept+Theirs.+Now+Farmers+Are+Paying.&ss_campaign_sent_date=2026-05-12T13%3A19%3A43Z
- American Coal Ash Association used U.S. Geological Survey data to compare the levels of heavy metals in coal ash to the levels present in ordinary rocks and soil. The study showed the levels to be comparable — which shouldn’t surprise anyone because that’s what coal ash is: “the non-combustible mineral portion of coal.” It’s the dirt and rock that were mixed in with the coal. There’s nothing about burning it that causes more to appear. The study can be found here: https://acaa-usa.org/wp-content/uploads/free-publications/ACAA_CoalAshMaterialSafety_June2012.pdf
- Other scientific studies of note: The U.S. Environmental Protection Agency conducted risk analysis of the use of various coal combustion products in concrete, wallboard, and agriculture and found them all to be safe:https://acaa-usa.org/wp-content/uploads/2023/04/ccr_bu_eval.pdf
- Beneficial Uses of Coal Ash: https://acaa-usa.org/wp-content/uploads/2023/04/FGD_Ben_Use_Eval_with_Appendices_March_2023_508.pdf
- For a general overview of all of the ways millions of tons of coal ash are safely recycled in the U.S. each year, look here: https://acaa-usa.org/wp-content/uploads/2022/12/22-ACAA-Brochure_FINAL.pdf
- There are lots more scientific reports, beneficial use case studies, and more on the publications tab of the ACAA: https://acaa-usa.org
- Additional Informative websites:
- Coal Hard Truths: https://thecoalhardtruth.com/myths-about-coal-renewable-energy/
- Count on Coal, ACC Blog: https://www.countoncoal.org/category/blog/
- Dick Storm, Liberty Univ. CEO Summit, panel notes, Sept. 2024: https://www.linkedin.com/feed/update/urn:li:activity:7266497381574098944?utm_source=share&utm_medium=member_desktop
- Coal Hard Truth on the Myths of Coal & Renewable Energy: https://thecoalhardtruth.com/myths-about-coal-renewable-energy/
- American Coal Ash Association: https://acaa-usa.org/wp-content/uploads/2022/12/22-ACAA-Brochure_FINAL.pdf
- Other scientific studies of note: The U.S. Environmental Protection Agency conducted risk analysis of the use of various coal combustion products in concrete, wallboard, and agriculture and found them all to be safe:
https://acaa-usa.org/wp-content/uploads/2023/04/ccr_bu_eval.pdf - Net Air Emission Benefits from the Remediation of Abandoned Coal Refuse Piles, Robert G. Fraser, QEP, and Patrick Fennell, PE, of TRC Environmental Inc.
- Comparison of the Impact on Greenhouse Gas Emissions Between Unabated Coal Refuse Piles and Reclamation-to-Energy Power Plants, Dr. Carlos Romero of the Energy Research Center at Lehigh University in Bethlehem, PA
- The Coal Refuse Reclamation to Energy Industry: Environmental and Economic Impact Analysis Update, Econsult Solutions, Inc.
- America’s Power Report on Fuels for Power Generation 2024: https://www.publicpower.org/resource/americas-electricity-generating-capacity
- PA Pundits Blog on “Coal Plants” 2021: https://wp.me/pJrS-WKK
- Lars Schernikau Blog on Rethinking Coal, May 2026: https://unpopular-truth.com/2026/04/25/rethinking-the-cost-of-electricity/?utm_source=brevo&utm_campaign=2026-04%20Rethinking%20the%20cost%20of%20electricity&utm_medium=email
- Lars Schernikau. On “Coal Keeps the Lights on” April 2026: https://unpopular-truth.com/2026/03/18/the-new-renaissance-of-coal/?utm_source=brevo&utm_campaign=2026-04-04%20newsletter%20Coals%20return&utm_medium=email
- Our World in Data Coal Power in world: https://ourworldindata.org/energy
- Dr. Happer presentation to Univ. of NC-2017 “CO2 is NOT a Pollutant: https://co2coalition.org/media/
- Dr. Richard Lindzen, of MIT “The Absurdity of Conventional Global Warming Narrative” : https://co2coalition.org/wp-content/uploads/2022/10/The-Absurdity-of-the-Conventional-Global-Warming-Narrative.pdf
- WUWT on the High Cost of the Endangerment Finding, April 22, 2026: https://wattsupwiththat.com/2026/04/21/the-end-of-epas-endangerment-finding-is-a-bigger-deal-than-the-iran-war/
- Kathryn Porter Blog post, Green vs. Base Load, April 2026, Outstanding overview of Dispatchable and Not-Dispatchable Power: https://watt-logic.com/2026/04/20/green-vs-baseload-the-most-suitable-energy-for-a-developing-country/
- The UnMade Energy Nation, By Pandreco on the foolish energy policies of Canada: https://open.substack.com/pub/pandreco/p/the-unmade-energy-nation?utm_campaign=post-expanded-share&utm_medium=web
- Global Energy Monitor: https://globalenergymonitor.org
- Clintel organization of Climate Scientists mostly from Europe: https://clintel.org
- Ron Clutz, “What Has Coal Done for You Today?”: https://rclutz.com/2026/04/26/what-coal-did-today/
- EU power prices increasing as a result of foolish EU Energy policy: https://wattsupwiththat.com/2026/04/26/european-energy-policy-full-speed-towards-the-wall/?utm_source=noptin&utm_medium=email&utm_campaign=New%20Post%20Notification%20Claude%20-%20European%20energy%20policy:%20full%20speed%20towards%20the%20wall
- Thomas J. Shepstone,Jr. on Politicians and Energy Policy: https://open.substack.com/pub/energysecurityfreedom/p/if-politicians-mean-what-they-say?utm_campaign=post-expanded-share&utm_medium=web
- Thomas J. Shepstone on De-Regulation: https://open.substack.com/pub/energysecurityfreedom/p/electric-deregulation-has-made-us?utm_campaign=post-expanded-share&utm_medium=web
- Rafe Champion on the need to burn coal, April 29, 2026: https://open.substack.com/pub/rafechampion/p/why-do-nuclear-luddites-refuse-to?utm_campaign=post-expanded-share&utm_medium=web
- “Always On” by Isaac Orr and Mitch Rolling, May 2026: https://energybadboys.substack.com
- Jo Nova on American Energy Dominance: May, 2026: https://joannenova.com.au/2026/05/the-usa-is-the-global-energy-powerhouse/
- Need more U.S. Built Ships to export our oil and gas, especially, LNG: https://open.substack.com/pub/energymusings/p/energy-musings-may-4-2026?r=kv1a9&utm_campaign=post-expanded-share&utm_medium=web
- CO2 Coalition Oped on, Harvard and Texas A&M, Who is Indoctrinating Students?”: https://co2coalition.org/2026/05/06/harvard-and-texas-am-which-one-is-indoctrinating/
- What a Barrell of Oil Provides: https://open.substack.com/pub/nathanhammer/p/what-a-barrel-of-oil-actually-makes?r=kv1a9&utm_campaign=post-expanded-share&utm_medium=web
- Lindzen, Happer and Koonin letter to SCOTUS, April 12, 2026: https://wattsupwiththat.com/2026/04/12/happer-lindzen-koonin-letter-to-the-federal-judicial-center/
- POWER Magazine article on Turk Power Plant 2013:
https://www.powermag.com/aeps-john-w-turk-jr-power-plant-earns-powers-highest-honor/ - WUWT on the Importance of Fossil Fuels, April 14, 2026: https://wattsupwiththat.com/2026/04/14/world-should-be-optimistic-about-our-fossil-fuel-future-bradley-op-ed-in-houston-chronicle/?utm_source=noptin&utm_medium=email&utm_campaign=New%20Post%20Notification%20Claude%20-%20“World%20Should%20be%20Optim%C2%ADistic%20About%20Our%20Fossil%20Fuel%20Future”%20(Bradley%20op-ed%20in%20Houston%20Chronicle)
- NIPSCO Solar Farm Destruction by Tornado, 2026, Real Clear Energy: https://climatechangedispatch.com/indiana-solar-tornado-damage/
- CNN on replacing SHERCO with solar: https://www.cnn.com/2024/09/16/climate/coal-to-solar-minnesota
- Coal Hard Truths: https://thecoalhardtruth.com/coal-sustainability/
- Electricity prices, U.S. Interactive chart 2004-2024: https://energybadboys.substack.com/p/visualizing-2026
- Electricity Rates in Blue States: https://wattsupwiththat.com/2025/12/31/high-electricity-prices-are-a-choice-blue-states-make-every-day/
- German Power Plant Implosion, April 2025: https://www.youtube.com/watch?v=QCqHFfPF2ys
- Wansley Demo: https://www.tiktok.com/@ashleydhb/video/7539239038146841869
- Bridgeport Harbor Coal Demo: https://www.ctpost.com/news/article/bridgeport-ct-power-plant-demolition-implosion-21053824.php
- Homer City Stacks Demo, April 2025: https://www.wtae.com/article/stack-homer-city-generating-station-demolished-build-energy-campus/64467737
- German Moorsburg Plant Demo. Only six years old, Example of a country’s Self Sabotage of their Lifeblood of reliable, Affordable, Dispatchable electricity generation capacity: https://debuglies.com/2025/03/26/germanys-moorburg-demolition-economic-costs-hydrogen-ambitions-and-the-global-implications-of-rapid-coal-phase-out-in-the-energiewende/
- Excellent article on the fundamentals of electricity generation covering VARs, Rotational Inertia, PF and more, Thomas J. Shepstone, Jan. 2026: https://open.substack.com/pub/digimus/p/inertia-and-reactive-power?utm_campaign=post&utm_medium=email
- PJM Energy Transition Report showing Path to Reduced Carbon Generation that has led to Generation Capacity Shortages: https://www.pjm.com/-/media/DotCom/library/reports-notices/special-reports/2024/20240624-energy-transition-in-pjm-flexibility-for-the-future.pdf
- Electro Industry by NEMA, Excellent insight into electrical equipment manufacturing: https://www.makeitelectric.org/industry-impact/#guide-to-electroindustry
- To Lower Electricity Costs in Australia, WUWT, Dec. 1, 2025: https://wattsupwiththat.com/2025/11/30/how-to-cut-the-electricity-price-in-australia/
- Aussie AEMO Hits Panic Button, Dec. 1, 2025: https://wattsupwiththat.com/2025/12/01/aussie-aemo-pushes-the-grid-stability-panic-button/
- Our World in Data, Electricity Use, U.S. and China 1999-2024: https://ourworldindata.org/grapher/electricity-generation?tab=chart&time=1999..2024&country=USA~CHN&mapSelect=USA~CHN~DZA&globe=1&globeRotation=44.78%2C-18.38&globeZoom=1.1&utm_source=substack&utm_medium=email
- Forbes on AI-Data Center Power Demand, Dec. 2025: https://www.forbes.com/sites/christopherhelman/2025/11/27/why-americas-power-grid-will-be-able-to-withstand-the-25-trillion-ai-datacenter-building-boom/
- Cost of Electricity in Red and Blue States by Tom Pyle and Thomas Shepstone, Dec. 11, 2025: https://open.substack.com/pub/energysecurityfreedom/p/blue-state-energy-prices-blues-in?utm_campaign=post-expanded-share&utm_medium=web
- Our World in Data, World Electricity Generation by Fuel: https://ourworldindata.org/electricity-mix
- NERC Winer Reliability Report: https://ow.ly/u0jz50XtJPh
- EXXON Energy Outlook: https://corporate.exxonmobil.com/sustainability-and-reports/global-outlook?tm=tt&ap=bads&aaid=adalCGdNG2F1z&gclid=9c510d91a93614ac0c4a64aa5eb059ef&gclsrc=3p.ds&cn=1ECX_BING_TRAF_XX_Non-Brand_EX%2BBR_Energy_P30Z0SP&agn=Non-Brand_Energy%20General&msclkid=9c510d91a93614ac0c4a64aa5eb059ef&utm_source=bing&utm_medium=cpc&utm_campaign=1ECX_BING_TRAF_XX_Non-Brand_EX%2BBR_Energy_P30Z0SP&utm_term=types%20of%20energy%20sources&utm_content=Non-Brand_Energy%20General#ExploretheGlobalOutlook
- EIA STEO Dec. 2025, Forecast: https://www.eia.gov/outlooks/steo/report/elec_coal_renew.php
- GEMS, Coal Plants: https://globalenergymonitor.org/wp-content/uploads/2024/04/Landing-page-Fig-1_-Coal-fleet-stacked-bar-and-line-chart-BB-2024@2x-1.png
- Americas Power, Coal Facts : https://americaspower.org/coal-facts/
- Congressional Report on Electricity Generation Capacity: https://www.publicpower.org/system/files/documents/Americas-Electricity-Generation-Capacity-2025-Update.pdfort on Coal Power, 2025: https://www.congress.gov/crs_external_products/R/PDF/R48587/R48587.1.pdf


