Bulk Power Supply & Primary Energy:
The term BULK POWER means just that, Bulk Power in hundreds and thousands of Megawatts. America needs huge Bulk Power generation additions of about 30,000 MW per year, not small scale R&D projects of variable generation or unproven new SMRs. Perhaps some time in the future renewables and new nuclear will be viable and competitive. However for now, we need 100-800 GW of new electricity generation to replace the more than 200 GW of reliable coal plants that were either shut down or planned for shut down soon. Satisfying the growing electricity demand of the future requires lots (Lots= 30,000 MW each year) of new generation capable of 24/7 generation.
When I joined CP&L in 1973 I entered a door emblazoned with a sign: Bulk Power Supply. Then I thought the name odd and frankly, I have not seen it since. However behind that door were the men and women that managed the generation assets of CP&L which at the time was only about 5,000 MW. The Bulk Power Supply came from seven fossil plants. Those plants were; Cape Fear, Weatherspooon, H.F. Lee, Sutton, Roxboro, Asheville and Robinson, including (1973) one lone nuclear (H.B. Robinson #2) and some small hydroelectric plants in the western corner of N.C. Bulk Power Supply was measured in Megawatts. Many of those coal units (CP&L has been absorbed into Duke Energy of the Carolinas) have been shut down. Most of them have been demolished as shown on the video of the Sutton plant implosion.
These coal plants should have been replaced with new coal generation plants of higher efficiency and even better flue gas cleaning. America is paying a price which will rise further, for the loss of this vital generation capacity without replacing it in kind.
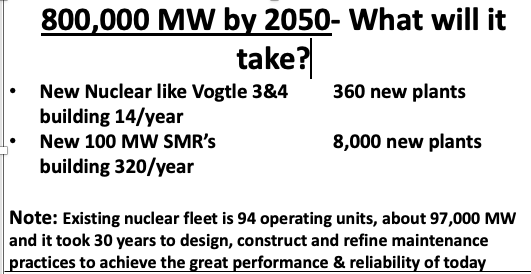
The Bulk Power Supply of America needs to grow by about 800 GW by 2050. Increasing the Bulk Power Supply is a huge challenge which has been vastly underestimated. Do the math. Building new 800,000 MW of capacity in 25 years is 32,000 MW per year of new dispatchable, reliable and affordable new capacity.
Unfortunately, I think many Utilities and government officials have under-estimated the enormity of building 800 GW of new power generation. I tried to lay out my perspective in a presentation to the Coal Institute in July. 800 GW of new generation capacity is equivalent to building over 325 coal plants the size of Duke Energy’s Roxboro Coal Plant (2462 MW) or building 360 new nuclear units such as Southern Company’s Vogtle Units # 3 & 4. (2200 MW)
How About the Primary Energy to Generate 800 GW of New Electricity Generation?
As mentioned above, many experienced authors of energy and electricity generation do not dwell on the importance of primary energy, so I will. Primary energy is not magic and it is not free as the proponents for wind and solar suggest.
The results are now in for “the Global Science Project” of experimentation with wind and solar aka “The Green New Deal”. One simply has to observe the actual electricity prices in Germany, Hawaii, Spain, California, the UK and Scandinavia to know that wind and solar cost more, are not reliable and of course they are not dispatchable.
Primary Energy
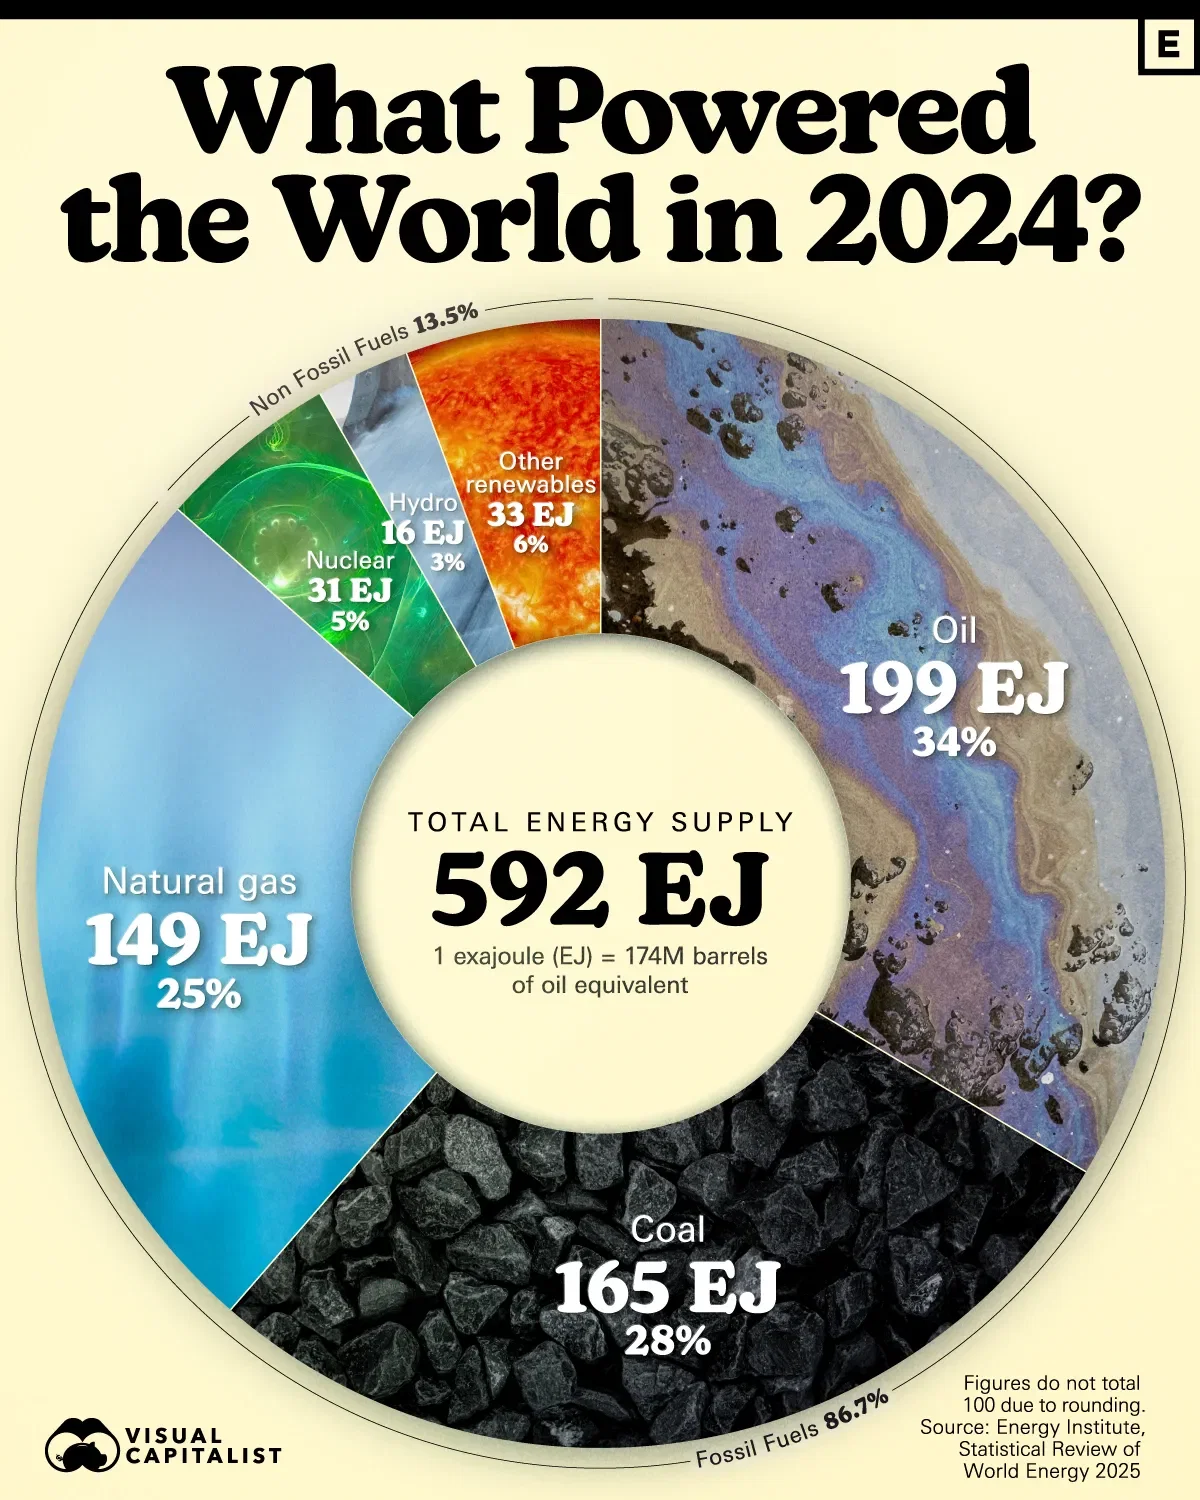
Electricity is secondary energy, it must be produced from Primary energy. In the vernacular of physics one Kilowatt hour of electricity is equivalent to 3,412.6 BTUs of thermal energy. Thermal energy has proven to be the most reliable, dispatchable and affordable. The reporting of Total Energy use by countries and the world is usually done in BTUs for U.S. customary units or in Exajoules in International units. The total world, according to the IEA has used right at 600 Exajoules (rounded from 592) and is shown below in a graphic from the Visual Capitalist. The conversion of EJ to Quadrillion BTU is EJ x 0.9478=QBTU. Example 592 EJ x 0.9478= 562 Quadrillion BTU.
The U.S. uses almost one fifth of the world’s primary energy. A reminder that economic prosperity is driven by energy. America is still the world’s #1 economy and therefore it should not be a surprise that we use almost a fifth of the world’s total primary energy consumption. This is Primary energy used not only for electricity generation but also for transportation, Industrial production, heating, cooking and commercial uses. Remember the phrase “Electrify Everything?”
The First Prerequisite to a thriving economy is that there must be available, reliable and affordable Primary energy to generate that electricity.

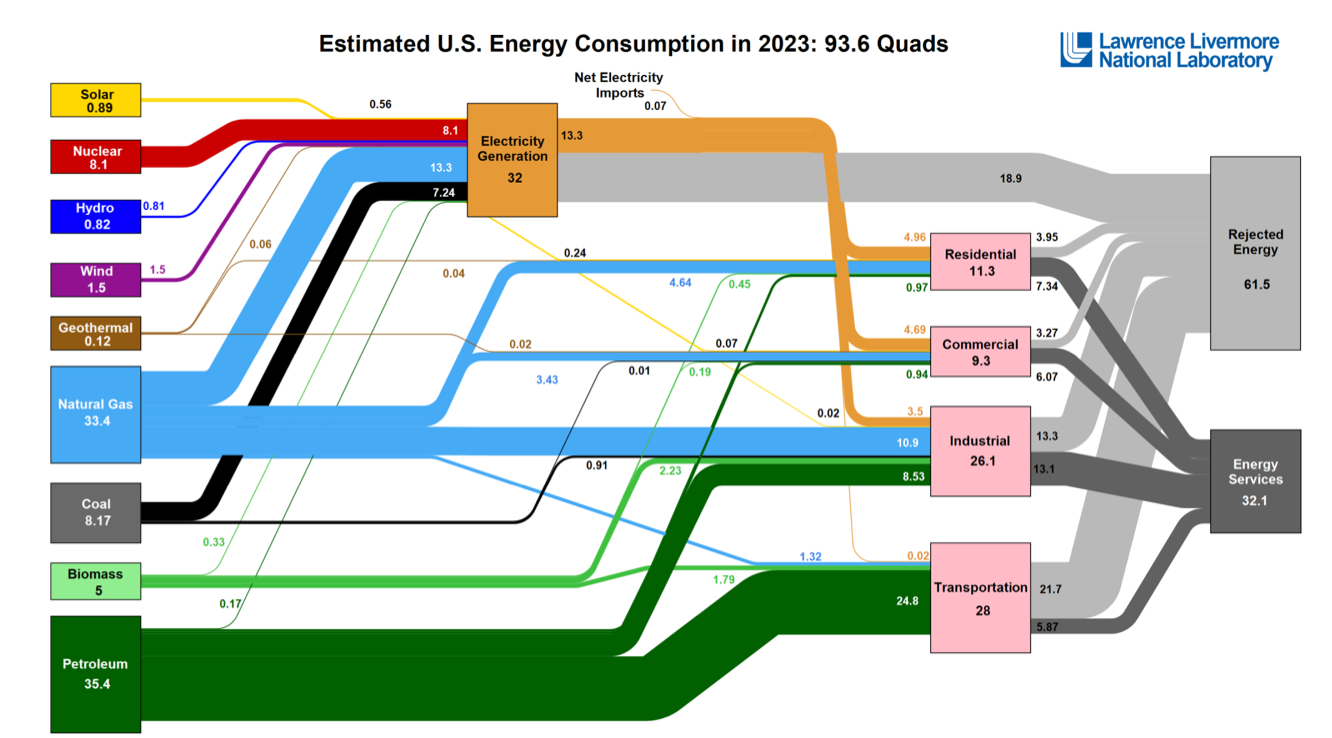
America Uses about 100 Quadrillion BTUs Annually of Primary Energy
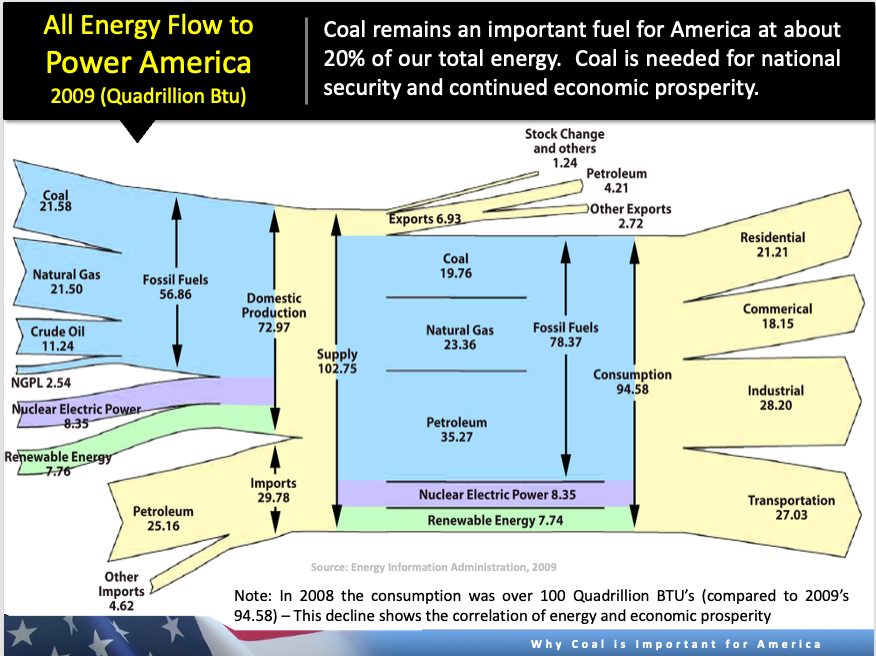
The LLNL Sankey Diagram shown below details the Primary Energy flows from sources to consumption. The U.S. has used right at 100 Quadrillion BTUs for the last 20 years. A little more than a third of total primary energy is used for electricity generation. (37.7%)

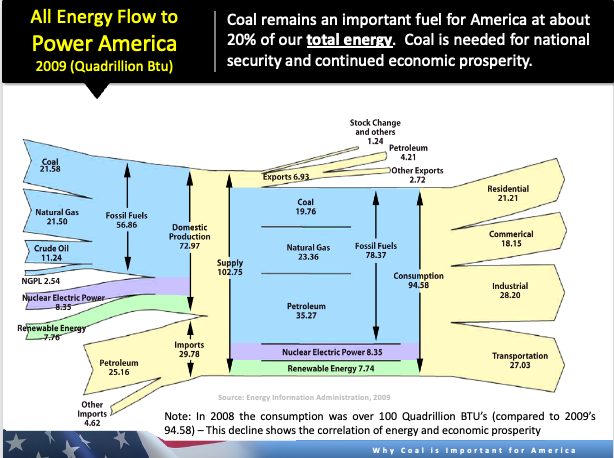
The chart above is from 2022. The one below from 2009. I used this chart in a presentation to the ASME in 2011 to attempt to impress the members with the importance of coal. At the time, America was using coal for about 45% of our electricity generation and the primary energy used to generate that power was about 20 Quadrillion BTUs of coal fuel. As can be seen from the two charts, natural gas increased about 10 Quads and coal decreased a similar amount. Basically, substituting natural gas for coal power production.
Self Sabotaging of the U.S. Bulk Power Supply
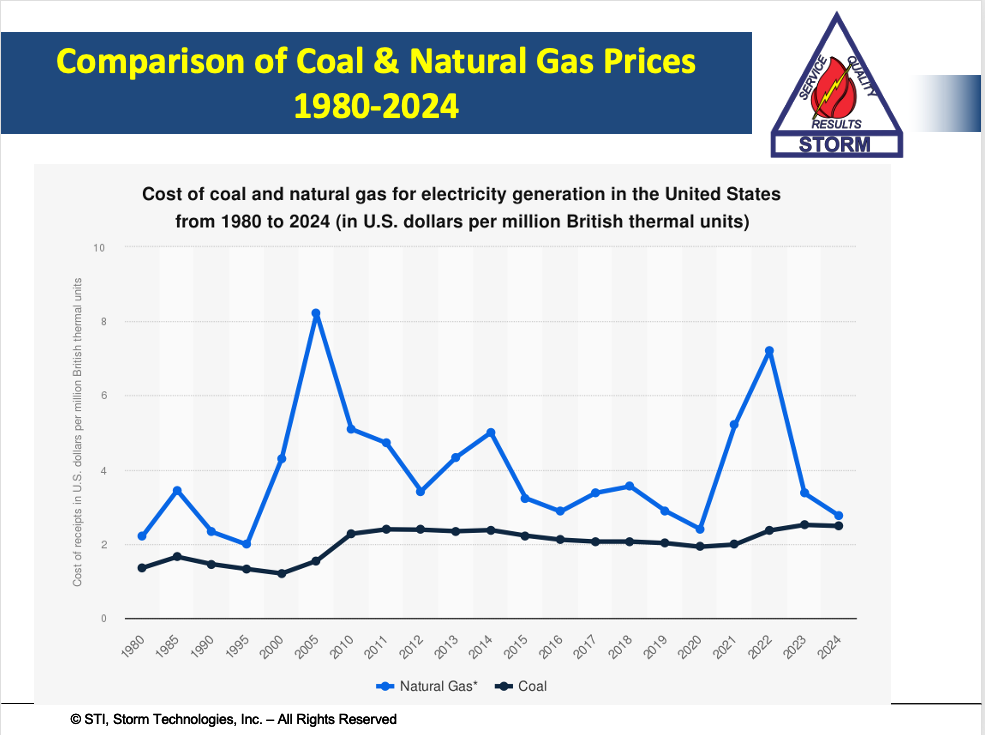
Since President Obama’s two term escalated war on coal over 50% of America’s reliable, affordable, Dispatchable and energy secure power generation has been shut down. I have called this self-sabotage. Mostly as a result of Federal Regulations, especially the politically inspired (not based on human health or science) EPA Endangerment Finding. But also due to NGOs and other voices working very effectively to demonize coal power. America had the most reliable, least expensive electricity supply in 2010 and the forces against coal power have steadily weakened our energy security, reliability and affordability. Electricity prices are climbing and will continue to do so as more unreliable, variable generation is forced onto the Grid, and backed up by natural gas fuel. Low prices of natural gas are not guaranteed into the future and fuel is the major cost component for thermal power generation. If the fuel cost doubles, so does the production cost of electricity.
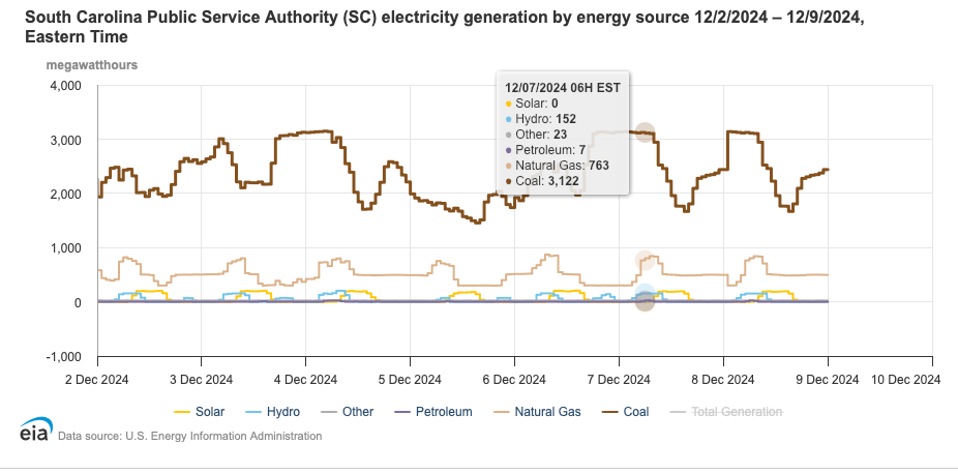
The chart below from the IEEFA shows the path of coal free power generation. Some states and countries are ahead of my state of S.C. and the electricity costs in those states that have shut down their coal plants has escalated sharply. Germany has suffered from significant De-Industrialization as a result of forcing wind and solar on the nation. If America continues the path set by Net-Zero Carbon advocates, we all will join Hawaii, California, Spain, Germany, the UK, Massachusetts and Connecticut with higher cost power and possible de-industrialization.

Thanks to President Trump and Chris Wright, America’s energy regulatory policy is somewhat corrected. However, some states, even S.C. still have laws on the books to exit coal. I feel this is energy suicide. Coal is a national treasure that should be utilized. In fact, in my opinion, it is the best and only viable choice of primary energy to provide the needed electricity generation between now and 2050. A coal plant should be able to be built in four years. We have done it before and can do it again!
The Future 2025-2050
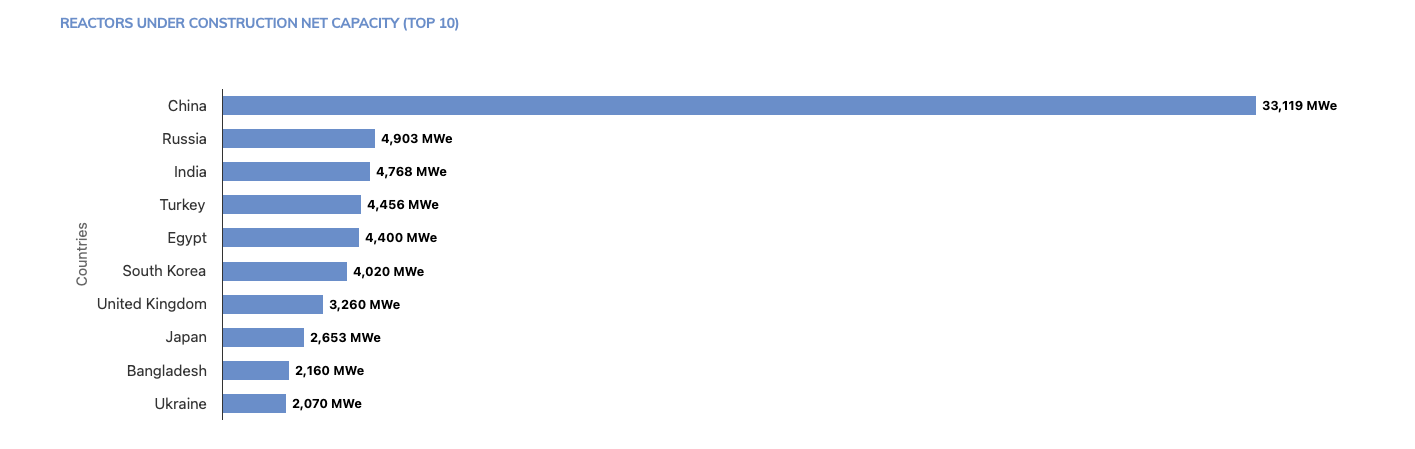
Electricity generation capacity will need to increase dramatically over the next 25 years. The projected growth has been well documented by many others including Stephen Heins, Thomas J. Shepstone, Jr., the ICF, NEMA and others. What is needed is an enormous amount of new, Dispatchable, reliable and affordable Bulk Power. About 800,000 MW of new Bulk Power. he workforce challenge is a topic to cover on another day.In my analysis, nuclear will play an important part. So will natural gas. However, there are three limits to just how much nuclear and natural gas can supply. These three constraints are Supply-Chain, pipelines and achieving a Balanced generation portfolio. The nuclear supply chain limits have been discussed before and although proven and an excellent clean choice, nuclear seems decades away before the needed capacity can be built. For example, it took America over 30 years (1957-1987) to design and build the existing nuclear fleet of about 97,000 MW of capacity. We now need eight times the nuclear fleet that was built over 30 years. Keep in mind, the legacy nuclear units built 1957-1987 were constructed when the Supply-Chain was well established, there were thousands of trained and experienced engineers at B&W, Combustion-Engineering and Westinghouse and craftsmen were much more abundant in the workforce. Many experienced engineers and craftsmen are now retired. Rebuilding the workforce is a topic for another day.
“Just in Time” Primary Energy
Today about 45% of the U.S. electricity generation at peak times is provided by natural gas through “just in time” pipelines. Not only is the Supply-Chain of new gas turbine plants limited but so are the pipelines and fuel supply. In my analysis, we already have too much dependence on pipeline provided natural gas. Remember the Colonial Pipeline Hack of 2021? Coal plants have the inherent advantage of being capable of storing several months of fuel on site.
The best choice for a Balanced Portfolio then, in my analysis is to build new coal plants. In Dick Storm’s Perfect World of Power Generation, I would like to see a Balanced generation portfolio of 30% coal, nuclear, gas, with 10% renewables. Illustration from the Coal Institute presentation.

Conclusion
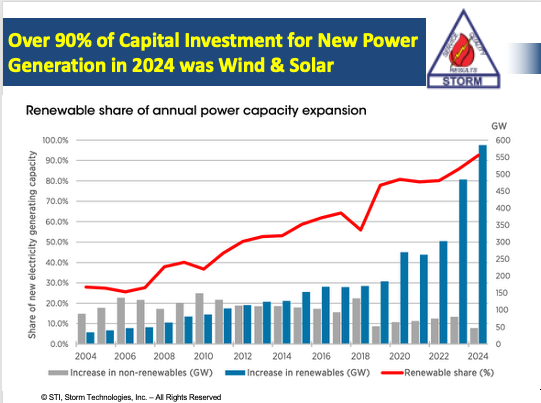
The policy planners and utilities have gravely underestimated the growth of electricity Demand and now are catching up by using the “Easy Button” of purchasing gas turbines for backup power for wind and solar. Most of the capital being invested in new generation in this calendar year is for solar, wind and BESS (Battery Electricity Storage). This is a mistake that will cost Americans dearly.
President Trump, Chris Wright and Lee Zeldin have done the best they can to correct decades of poor flawed planning by the EPA and Congress with the Inflation Recovery Act version of the New Green Deal. However, many states and large Utilities still remain on a foolish path toward Net-Zero Carbon. For example, Here are five articles on U.S. and South Carolina Energy Policies:
- SWAMP People and Organizations Against Making America Great, Foreign and Domestic https://dickstormprobizblog.org/2025/08/07/swamp-people-and-organizations-against-making-america-great-foreign-domestic/
- Swamp Opposition to President Trump’s America First Agenda, Published by Thomas J. Shepstone on Substack: https://open.substack.com/pub/energysecurityfreedom/p/fighting-the-swamp-and-our-enemies?r=kv1a9&utm_campaign=post&utm_medium=web&showWelcomeOnShare=false
- Some Red States Still Embrace the Green New deal, Including the Usually Conservative State of S.C. Sept. 8, 2025: https://dickstormprobizblog.org/2025/09/08/some-red-states-still-embrace-the-green-new-deal-including-usually-conservative-south-carolina/
- FIVE REASONS TO BUILD NEW COAL PLANTS NOW! COAL SHOULD BE INCLUDED AS A CRITICAL FUEL TO POWER AMERICA’S FUTURE, SEPT. 24, 2025: HTTPS://DICKSTORMPROBIZBLOG.ORG/2025/09/24/FIVE-REASONS-TO-BUILD-NEW-COAL-PLANTS-NOW-COAL-SHOULD-BE-INCLUDED-AS-A-CRITICAL-FUEL-TO-POWER-AMERICAS-FUTURE/
- Ten Hard Truths of Electricity Generation in South Carolina, the Life-Blood of the Economy, Oct. 8, 2025: https://dickstormprobizblog.org/2025/10/08/ten-hard-truths-of-s-c-electricity-the-lifeblood-of-the-economy/
America needs to begin building new Dispatchable, affordable and proven reliable Bulk Power Generation as soon as possible. As I see it, the best source of the needed primary energy to satisfy the demand is America’s own treasure of coal reserves. Think about the needed capacity in terms of 32,000 MW per year for 25 years. That my friends is a heavy lift. As a country we must unite behind President Trump to get this done…Wake up Americans!
Yours very truly,
Dick Storm, October 22, 2025
References and Further Reading:
- The Coal Institute Presentation by Dick Storm, July 2025: http://thecoalinstitute.org/ckfinder/userfiles/files/Dick%20Storm%20Presentation%20July%202025.pdf
- Institute for Energy, Economic and Financial Analysis. on Coal Plant retirements since 2011: https://ieefa.org/resources/us-track-close-half-coal-capacity-2026
- Duke Energy Carolinas, Demolition video of Sutton Unit #3, Nov. 2016: https://youtu.be/miSapiaJTpM
- The Coal Institute, Dick Storm presentation, July 2025: http://www.thecoalinstitute.org/ckfinder/userfiles/files/Dick%20Storm%20Presentation%20July%202025.pdf
- Dr. John Constable on the Importance of Energy, You Tube: https://www.youtube.com/watch?v=scYlWiunJo4
- The Ancestry of Energy by Pandreco: https://open.substack.com/pub/pandreco/p/the-ancestry-of-energy?r=kv1a9&utm_campaign=post&utm_medium=web&showWelcomeOnShare=false
- WSJ-Rahm Emanuel Opinion, Sept 17, 2025: https://www.wsj.com/opinion/rising-electricity-price-thank-trump-2270cf1f?mod=Searchresults&pos=1&page=1
- WSJ counter point to Rahm Emanuel OpEd, Sept. 21, 2025: https://www.wsj.com/opinion/big-electric-bill-thank-the-energy-subsidies-emanuel-trump-50d1dcd8?mod=opinion_more_article_pos32
- Isaac Orr and Mitch Rolling on wind, solar and gas cause electricity prices to rise: https://open.substack.com/pub/energybadboys/p/rising-natural-gas-costs-make-wind?r=kv1a9&utm_campaign=post&utm_medium=web&showWelcomeOnShare=false
- Devil’s Algorithm and Climate Matrix: https://open.substack.com/pub/tilakdoshi/p/the-devils-algorithm-unplugging-from?r=kv1a9&utm_campaign=post&utm_medium=web&showWelcomeOnShare=false
- Energy Charts on Germany: https://www.energy-charts.info/charts/energy_pie/chart.htm?l=en&c=DE
- Ember Charts and Energy Info on worldwide energy use: https://ember-energy.org/data/electricity-data-explorer/?data=generation https://ember-energy.org/data/electricity-data-explorer/?data=generation&entity=United+States
- Tom Shepstone Sub-Stack on Massachusetts high electric rates: https://open.substack.com/pub/energysecurityfreedom/p/political-reality-descends-upon-massachusetts?r=kv1a9&utm_campaign=post&utm_medium=web&showWelcomeOnShare=false
- Tom Shepstone on POSIGEN Failure in PA, Sept. 8, 2025: https://open.substack.com/pub/energysecurityfreedom/p/posigen-provides-yet-another-example?r=kv1a9&utm_campaign=post&utm_medium=web&showWelcomeOnShare=false
- Tom Shepstone on Wind and Solar after OBBB, Sept. 9, 2025: https://open.substack.com/pub/energysecurityfreedom/p/are-the-days-of-solar-stupidity-coming?r=kv1a9&utm_campaign=post&utm_medium=web&showWelcomeOnShare=false
- Energy Bad Boys on Electricity Rates Rising due to Renewables, yet, Trump is blamed: https://open.substack.com/pub/energybadboys/p/the-number-one-reason-trumps-policies?r=kv1a9&utm_campaign=post&utm_medium=web&showWelcomeOnShare=false
- HeatMap Newsletter: https://heatmap.news/politics/electricity-price-politics#
- POWER, Sept. 2025 on cost of solar and wind: https://www.powermag.com/solar-and-winds-hidden-price-tag-why-cost-isnt-the-whole-story/
- Fraser Institute on solar and wind cost: https://www.fraserinstitute.org/commentary/solar-and-wind-power-make-electricity-more-expensive-thats-a-fact
- Daily Caller, Sept. 2025: https://ijr.com/frank-lasee-how-wind-and-solar-are-quietly-inflating-electricity-bills/
- Forbes, Yes, Wind and Solar do Increase Electricity Prices: https://www.forbes.com/sites/michaelshellenberger/2018/04/25/yes-solar-and-wind-really-do-increase-electricity-prices-and-for-inherently-physical-reasons/
- America’s Coal: https://americascoal.substack.com/p/estimating-the-real-cost-of-electricity
- IER on cost of solar and wind: https://www.instituteforenergyresearch.org/the-grid/rising-bills-bad-blame-whats-really-driving-electricity-prices/
- Energy Policy Research Chart of world electricity prices 2024. Excellent: https://eprinc.org/wp-content/uploads/2024/08/COW2024-34-USAndEuropeanHouseholdElectricityPrices.pdf
- EPI Charts: https://eprinc.org/chart-of-the-week/?gf_protect_submission=1
- Inside Climate, Great State by State chart: https://www.linkedin.com/pulse/which-states-getting-hit-hardest-electricity-price-qybsc/
- EIA FERC Electricity and Energy Data, Sept. 2025: https://www.eia.gov/electricity/monthly/current_month/september2025.pdf
- Inside Climate News: https://insideclimatenews.org/tags/inside-clean-energy/
- Excellent Paper on the Cost of Wind and Solar across the World, Oct. 5, 2025: https://www.cis.org.au/publication/the-renewable-energy-honeymoon-starting-is-easy-the-rest-is-hard/
- Threats to the Electric Grid, Update, May 25, 2025: https://dickstormprobizblog.org/2024/03/15/threats-to-the-grid-electricity-reliability/
- Colonial Pipeline Hack, 2021: https://www.cisa.gov/news-events/news/attack-colonial-pipeline-what-weve-learned-what-weve-done-over-past-two-years
- Mitch Rolling on Wind and Solar, Oct. 18, 2025: https://energybadboys.substack.com/p/more-is-less-with-wind-and-solar
- Watts Up With That, Oct 2$, 2025, What Green Transition? Coal Use Continues to Rise: https://wattsupwiththat.com/2025/10/24/green-transition-coal-use-hits-record-high/
- American Public Power on Electricity Growth to 2050: https://www.publicpower.org/periodical/article/study-sees-dramatic-rise-us-power-demand-2050