The citizens of North America, Europe, Japan and Australia are all accustomed to having abundant, reliable and reasonable cost energy and electricity. Not until a hurricane or extreme weather comes when power lines are downed, do Americans appreciate the importance of energy and electricity to power our way of life. My goal in this Blog is to show the relationship of energy to the Human Development Index and the inter-relationships of energy and our quality of life.
First let’s take a look at NASA’s composite photo of the “Earth at Night”. Remember the dark areas of the Planet as you then scroll through the next few graphs of economic activity and energy.
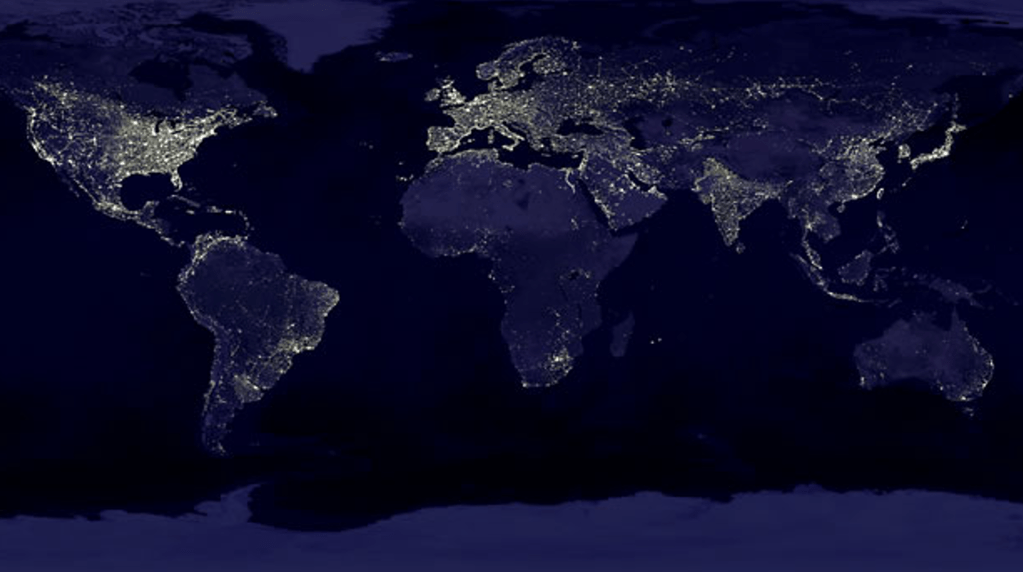
Next, plots of energy and GDP for selected countries of the world. North Korea is not included in the data plot, but the satellite photo showing lights below the 38th Parallel clearly show the distinction of a centrally controlled Socialistic government and Economic Freedom of South Korea.

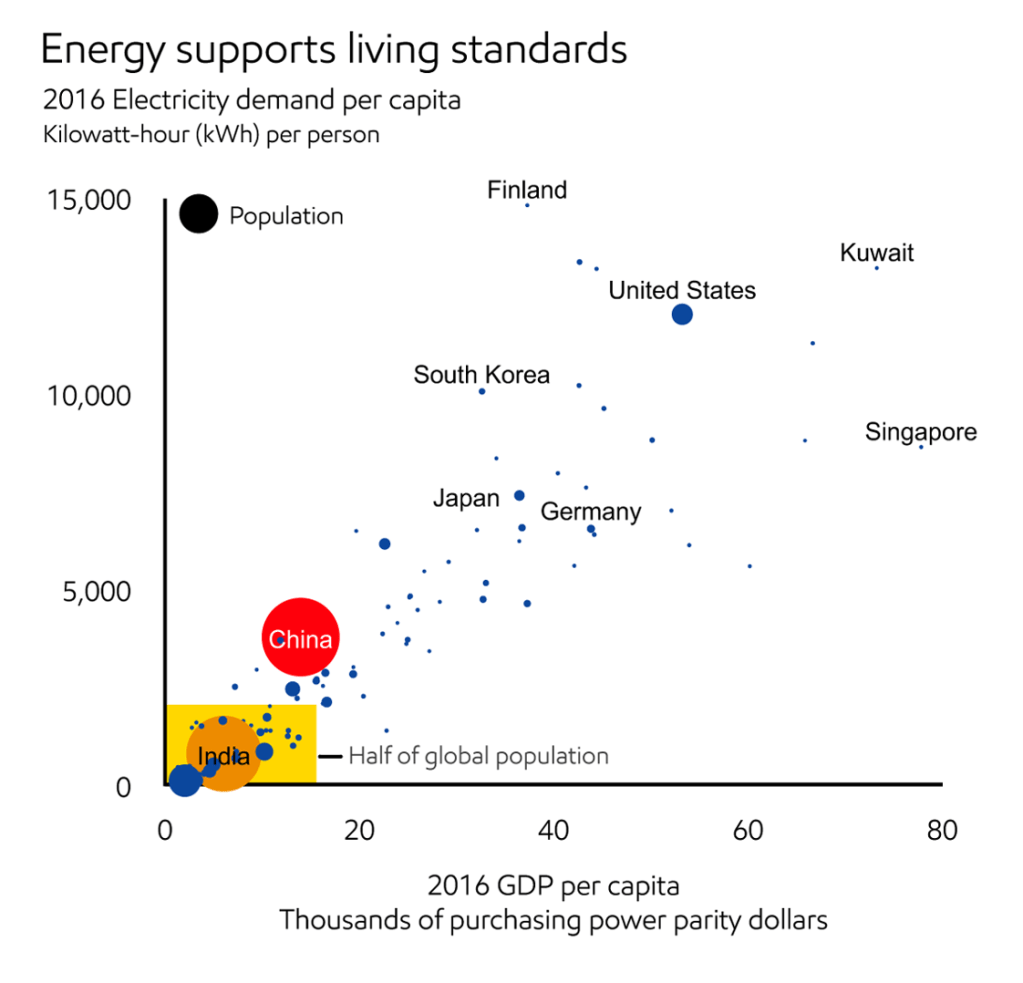
The next graph is from ExxonMobil’s Outlook for Energy and uses data from the U.N., World Bank and other respected references. Note the vertical axis showing energy use in kWh per person/year. Over 50% of the world’s population uses less than 2,000 kWh/year. Americans on average use about 13,000 kWh/year. The electricity is used for residential heating, cooling & cooking. Keeping it into perspective, nearly 1 Billion people of the world do not have access to any electricity. Note the chart which follows, below. This data from the UN, World Bank and the chart was prepared by “Our World in Data”.
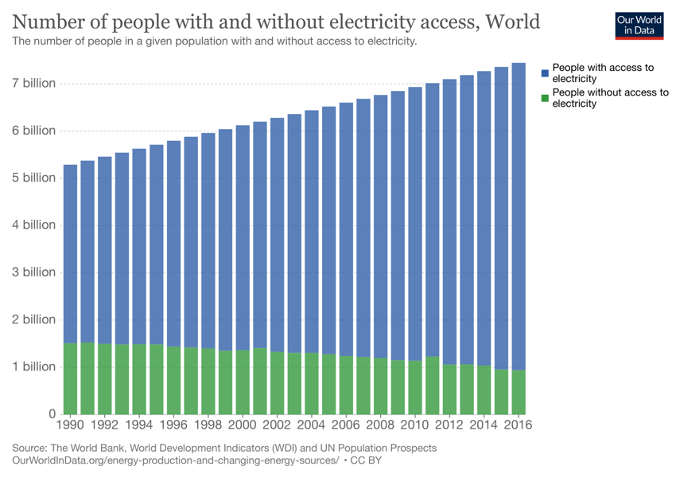
There are almost 1 Billion people of the world that do not have access to electricity. If you go back to the NASA composite photo of the earth at night above, you can see by illumination the difference between the Developing countries and the Developed Countries.
So, how do citizens use energy to create better lives? The figure below shows the uses of Total Energy used in the U.S.A. Americans utilize on average about 100 Quadrillion Btu’s (BTU= British Thermal Unit). The 100.2 Quadrillion divided by 330 million citizens comes out to about 330 million Btu’s/person/year. This is total energy use and includes energy used for electricity generation, transportation, industrial production, heating, cooling, cooking.
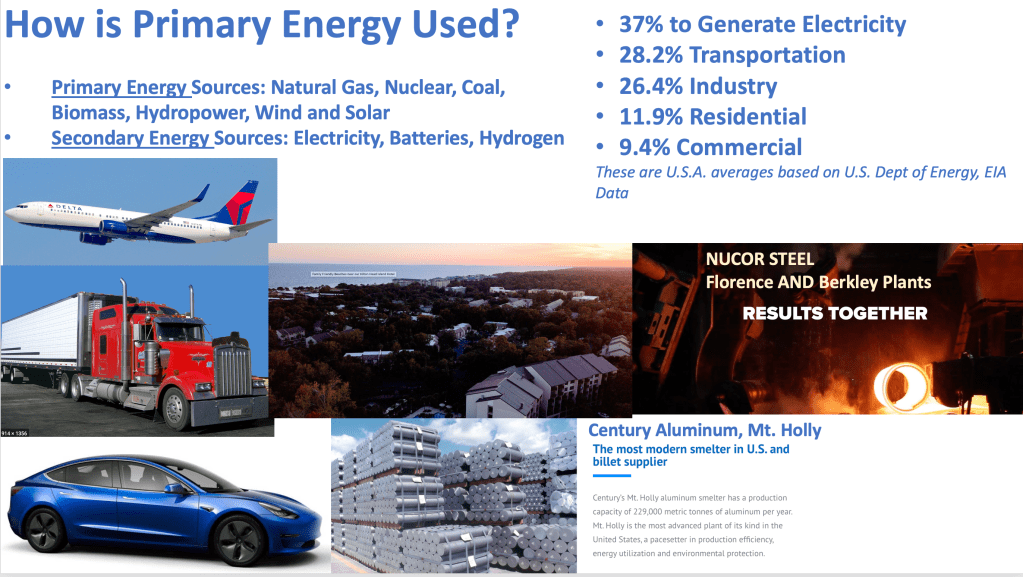
The highest use of energy in the U.S.A. is for electricity production at 37% of our total. Next is transportation at 28.2%. When all uses of energy are totaled in Btu equivalents, then divided by the population, the average comes out to about 330 million Btu’s per person per year. This includes all uses of energy.
To illustrate what 330 million Btu’s is equivalent to our friends at Storm Technologies created the graphic below:

The energy equivalent of 330 million Brittish Thermal Units could be about 48 barrels of Diesel fuel, 64.5 barrels of gasoline, 14 tons of coal or 778 pounds of propane. This is what Americans use on average. Those of us that travel more or have larger homes use more than the average. An apartment dweller in a large city with no car will use less. Also figured into the average energy use is Industrial production. Primary metals such as aluminum, copper and steel use huge amounts of electricity to produce.
The Industrial production provides jobs and improved economic freedom. The next chapter will cover energy independence and how reasonable cost energy impacts world trade and competition.
Dick Storm
