This is Part III of a three part series. Part I covered the basics of the three major Heat-Engines that provide about 75% of our electricity in the U.S. Part II covered the propulsion systems for ocean shipping. This article will explain the basics of smaller Heat-Engines used for electricity generation, farming, food production, food distribution, automobiles, trucks, trains, aircraft, small engines for landscape, construction, mining, military defense machines and more. Internal Combustion Engines (ICE’s) powered by fossil fuels are used widely in all sectors of our economy.
Conventional Energy=Life as We Know It
Let’s start with the largest Internal Combustion Engine ever built. The Wartsilla Marine Engine is credited to be the largest reciprocating Diesel engine in the world. These have been tested at up to 114,000 Hp.
State of the art design Marine Propulsion Prime Movers Have Been Adapted for Use as Stationary Power Generation for a Long Time.
Electric Power generation technology progressed from ship and aircraft propulsion systems over the years. Many central station power plant systems have their roots in marine and aircraft propulsion. Consider these milestones for land, sea and aircraft:(14)
Robert Fulton Steamboat Clermont-1807
Otto invents the 4-Cycle Gas engine-1867
Charles Parsons, invents Steam Turbine-1884
Charles Parsons Steam Turbine drive on Turbinia-1894, Fastest Ship in the world
Rudolf Diesel invents Compression Ignition Diesel engine-1895
First large Diesel engines for Maritime use are in German Submarines during WWI
Dr. Hans von Ohain (Germany) and Sir Frank Whittle (UK) are both recognized as being the co-inventors of the jet engine, later adapted to electric power generation-1933
U.S. Nuclear submarine Nautilus launched 1954 powered by a PWR
Largest Diesel Engine ever built-Wartsilla RTA96-C 107,000 HP-2006
Internal Combustion Engines for Electricity Generation
Large natural gas and Diesel powered generators are commonly used for Dispatchable backup power for areas served by large capacity of wind and solar generation. When the wind stops and sun is not shining, the Grid must be stabilized with adequate generation that is needed quickly. Internal combustion engines serve this need very well. The picture below is from a facility near Marquette, Michigan. This picture below is a 17 MW (24,000 Hp) gas engine. Multiple engines can be installed for total power capacity of over 225 MW as in the Denton, TX plant.
The advantages of the gas engines are: They have black start capability, fast load response, VAR (Volt Ampere Reactive) support, most importantly they can run 24/7 under any weather conditions and they are Dispatchable. The adaption from marine propulsion systems makes the features of black start and load responsiveness intrinsic in the design. These are referred to as “RICE”, an acronym for Reciprocating Internal Combustion Engines.
Aeroderivative Gas Turbines
The aeroderivative gas turbines also serve as tremendously reliable, Dispatchable and powerful prime movers for generators. The name aeroderivative is descriptive as these heat-engines have a long history of development and advancements in materials and design for reliable aircraft propulsion. Therefore, reliability is an intrinsic priority. One of the most common and proven designs is the G-E LM-2500 shown below.
In Part I of this series I described the larger G-E Gas Turbines used with Combined Steam Cycles (GTCC) of the 600-700 MW capacity range. Like the internal combustion reciprocating engines, the gas turbine prime mover has the advantages of fast starts, Dispatchability, VARs support, 24/7 operation, rapid load response and quick shutdown. Truly flexible generation.
Heat-Engines in our Everyday Lives
The most common Internal Combustion Engines (ICE’s) of course are used in transportation. Automobiles, trucks, tractors, farm equipment, construction equipment, aircraft, ships and trains. According to the U.S. Department of Energy, about 37% of the total Primary Energy used in the U.S. during 2023 was for transportation. About 28 Quadrillion BTUs to be exact.
These are the forms of energy that power our lives each day. The ICE is a large part of our lives whether it is in powering our computer, providing illumination, powering industrial production, construction, farming and providing jobs. Also, very importantly for our freedom of travel…..providing the fuel for transportation of our families and friends.
Fertilizer, Farming, Food Production and Food Distribution
Perhaps farming and food distribution should be at the top of the list as it is one of the most basic human needs. Food production begins with fertilizer production which is off topic for this article, but fertilizer production represents a significant portion of total primary energy consumption. It is said by Vaclav Smil and other experts that synthetic fertilizer production is important to feed about 50% of the world’s population. Then, once fertilizer is produced; planting/harvesting/processing/Distribution of food progresses from farm to table. Energy is important every step along the way.(9)
The enormous productivity benefit of a Diesel tractor is obvious. The importance of energy in producing fertilizer, food processing, refrigeration and trucking distribution is not so obvious. However, much of food production farm to table, involves heat-engines and fossil fuels. In fact, the cost component of energy; farm to table is about 50% energy.
The IEA has analyzed the cost component of energy for common foods and documented that about 50% of food cost is from energy.(10)
Conclusions
Conventional forms of energy are important and it takes a lot of natural gas, petroleum, coal and nuclear to power and sustain our high quality of life. Those that believe wind and solar can replace conventional forms of energy during the next twenty years are delusionally misguided and indoctrinated with misinformation. Professor Vaclav Smil has documented this quite well, (He has written dozens of books on the subject and is, in fact one of the sharpest world energy experts)
Four components of our lives cannot be replaced by renewable power. Those four pillars of society are Fertilizer, Steel, Concrete and Plastics.(11, 15)
The “Heat-Engines” that Civil Society Depends on will remain important for a long time and so will fossil fuels. This three part series was intended to provide an overview of these magnificent machines.
Yours truly,
Dick Storm, August 10, 2024
References and Information for further reading and research
The 20th century began with much farm work, transportation, heating and home chores being done with muscle power and wood burning. As coal, petroleum, natural gas and later nuclear energy were applied to replace muscle power, our country experienced rapid growth in industrial production, food production, shipping, travel and a growing economy. Also, comforts and conveniences at home and work such as air conditioning, refrigeration, cooking, dishwashers, automatic washers, and more. A previous article on the history of energy is here. That 105 year period 1850-1955 yielded incredible growth in both industrial output and economic growth. The strength of the U.S. grew and expanded for the U.S. to become the Greatest country in the world, with the largest economy in the world. This was made possible by many factors, including; the Judeo-Christian work ethic of the people, Liberty, Capitalism, Free Markets, creativity, inventiveness, innovation and the abundance of God’s given treasure of Domestic energy resources. Including the richest deposits of coal in the world, natural gas and petroleum. America, the Saudi Arabia of Coal!
An important point, not often discussed. Wherever there is coal, so is there oil and gas. In 2023, the U.S. produced more crude oil than any other country.(24) This in spite of excessive Federal regulations and an out of control EPA.
Reasonable cost and abundant energy was essential for America’s success, just as energy is essential for any other country’s success. America’s energy use is reported in British Thermal Units (BTU) and the U.S. uses about 100 Quadrillion BTUs each year. The Energy Institute and the International Energy Administration reports world energy use in Exajoules (EJ) and the world uses about 620 Exajoules per year. (0.947817 x 620 EJ= 587.6 Quadrillion BTU)
Why Horsepower?
I have written on this before and had some feedback from readers and friends that “The general public doesn’t understand it when they are told they use about 850,000 BTUs of energy each day or the U.S. used 100 Quadrillion BTUs in a year”. Therefore, for this two part essay I thought I would express electricity energy in “Horsepower”. Rather than BTUs, kWH, Joules or Foot-Pounds, this article expresses energy production in Horsepower because, especially my family and friends, horsepower is a term most folks look at when buying a new car or truck, whether it is a 250 Hp Diesel fueled Ford F-150 or a 1020 Hp Tesla Model S. The fuel for each must first be provided by Primary Energy used to create either motive force or electricity.
Primary Energy
About 92% of the Primary energy used in America is used in Heat-Engines to power our high quality of life. About a third of the primary energy used in the U.S. is used to generate electricity. This article is intended to be a primer on the massive Heat-Engines that keep our Grid energized. Part 2 will include smaller heat-engines used for electric power generation and those used for transportation. It is my goal to keep the Thermodynamics simple so that non technically trained people can understand the importance of the 92% conventional Primary energy that we depend on. Past articles that I have written attempted to explain the differences of Primary Energy and Secondary Energy.Here, Here and Here. Primary energy flows in the U.S. for the year 2022 is shown on the LLNL chart here. The World use of Primary energy is shown by the Energy Institute here.
Common Large Heat-Engines
Definition of a Heat-Engine: A heat engine is a system that converts heat to usable energy, particularly mechanical energy, which can then be used to do mechanical work. Such as a Steam Turbine which converts the heat energy of steam into rotational force to spin a generator to produce electricity.
Also, a gas turbine or turbo-jet engine that uses heat energy to create rotational force to a shaft. A portion of the heat energy is exhausted as waste. The difference of the heat content of the steam or hot gas at the inlet and at the exhaust is the net work that has been extracted for useful purposes. In this article steam and gas turbines will be discussed. In a power plant the steam turbine or gas turbine is sometimes referred to as the Prime Mover. A previous article touches on Heat-Engines. The illustration below is a graphical description of the conversion of coal fuel to provide heat used to generate steam. The steam is then used to spin a turbine providing the motive force creating shaft horsepower to spin a generator and ultimately generating electric power. The heat source to produce steam can be coal, nuclear, natural gas, oil, biomass or municipal waste. The basic steam cycle remains the same, referred to in our industry as the “Rankine Steam Cycle”.
From Storm Technologies Large Electric Utility Boiler Combustion & Performance Optimization Course
Thermal Power is important for everything we do!
One pre-requisite to understanding Heat-Engines, is to understand the difference between Primary Energy and Secondary Energy. Covered in previous articles, here, here and here.
Types of Heat-Engines
Let’s start with one of the largest first. Here is a photo of the Zimmer Coal Plant. This plant shut down in 2022 but when started up in 1991 it was amongst the largest single unit power plants in the world with 1351 MW capacity, Dispatchable 24/7, rain or shine, summer or winter. This plant was one of my favorites and in my opinion, it is an example of one of the most magnificent heat engines ever built.
The photo above is just part of the power plant, showing the Low Pressure Turbine and generator. There is also a High Pressure turbine and separate generator. The entire Zimmer “Heat-Engine” comprises the entire power plant shown below in an aerial photo. Although I have been in the power generation business for over 50 years, it still amazes me that so much of the equipment involved in the total electrical energy production starting with a coal conveyer moving 500 tons per hour of coal can be pulverized and burned, produce steam to the turbines and generate electricity to the Grid (the equivalent of 1.8 million Hp) through three skinny high voltage wires that are smaller than 2″ in diameter and 1.8 million horsepower of energy.
Photo from Cincinnati Newspaper about 1994
The Zimmer Coal Plant when operating at full capacity of 1350 MW’s is equivalent to about 1,800,000 Horsepower. To generate this much power about one million pounds of 11,000 BTU/# coal would be pulverized and burned in suspension in the furnace each hour. That is one reason why I refer to this power plant as a Magnificent Heat Engine. The million pounds per hour (Imagine five 100 ton coal cars/hour) of coal is converted into electricity that flows through three high voltage conductors to the transmission lines feeding the Grid. The water flow to the steam generator is equivalent to about 20,000 gallons per minute. An Olympic swimming pool holds about 600,000 gallons. At maximum capacity the Zimmer steam generator will evaporate the equivalent of two Olympic swimming pools full of water each hour and heat that water to steam at over 3,845 pounds per square inch and 1,000 degrees F. The single turbine driven boiler feed water pump is powered by a 50 MW (67,000 Hp) steam turbine which is about as powerful as all the power consumed on a hot summer day in my old town (about 20,000 people) in Albemarle, NC. Fifty Megawatts is the power to drive just the feed water pump.
These are a few reasons why I consider Zimmer to be a magnificent Heat Engine. An excerpt from the POWER Magazine 1993 feature article is copied below.
Nuclear Power Generation
The Oconee Nuclear Plant is another example of Thermal power generation. Allow me to also call this a heat engine. Three units with a total capacity of 2,554 MW. The illustration below is from the Duke Energy Fact Sheet.
This three unit nuclear powered “Heat-Engine” is about twice as large in total output as the Zimmer Coal Plant discussed above. Expressed as Horsepower, the three units together represent the equivalent of over 3.3 million horsepower.
Both the Zimmer and Oconee plants utilize the Rankine Steam Cycle.
Natural Gas Turbines
Modern gas turbines used for power generation are referred to as “Aeroderivative” Why? Because the gas turbine technology used is derived from jet engine designs. I wrote on the history of power generation in a previous article here. Two engineers, one German and one British are credited with the invention of the jet engine which came to be in the mid 1930’s. The first gas turbine application to power generation is generally thought to be by General Electric at the Belle Isle Station in Oklahoma, about 1949. The simple Gas Turbine single cycle is called the “Brayton Cycle”. An illustration of a modern Gas Turbine is shown below.
The generator is not shown in the above illustration but it will be similar to the generator shown above at the Zimmer coal plant. The point is that heat energy is used in each example thus far. For Zimmer coal is used to generate steam supply to power steam turbines as prime movers. Oconee uses nuclear fission to provide the heat to generate steam for the steam turbines there. Both use the Rankine steam cycle. The gas turbine shown above utilizes the Brayton cycle to create hot gases that flow through the gas turbine as the prime mover for the generator shaft.
Gas Turbine Combined Cycle Plants (GTCC)
One of the major advancements in the last twenty years or so has been the commercial application of gas turbines and steam turbine cycles working together. That is using both gas turbines with a shaft connected to a generator and then exhaust heat recovery of the gas turbine in a boiler to generate steam to provide a steam supply to a steam turbine which is the prime mover of a second generator.
By combining the gas turbine and steam turbine cycles, a much greater overall efficiency can be achieved. Modern GTCC plants achieve up to 65% thermal efficiency.
The plant below is 697 MW capacity. Fueled by natural gas.
The GTCC plant electrical output of 697 MW is equivalent to 927,000 Horsepower.
Summary
Heat engines power our lives and very little is stated in the Main Stream Media about the importance of conventional energy. Especially, Thermal Energy. In fact, if anything is written or discussed on TV, the MSM demonizes carbon and thermal power. This article is an attempt to explain the immensity of electric power generation systems on which we depend. There is a war to abolish fossil fuels which provide about 80% of the fuel needed to power our lives. This is best shown on the LLNL Energy Flow Chart below. Yes, it is expressed in BTU’s (British Thermal Units) and each BTU is equivalent to 778 foot pounds of work which may have been accomplished by muscle power 150 years ago, but now many politicians and leaders seem to have forgotten what conventional energy has made possible. The Zimmer plant and many other fine coal plants are being decommissioned and most demolished, without replacement of similar reliable, affordable generation capacity. I wrote on this before, here,here and here. So have many other people and respected organizations that understand generation by conventional fuels. Some references of these others are included below.
The 2023 LLNL Energy Flow Chart is not yet available. The most recent is for year 2022, shown below. Yes, 100.2 Quadrillion BTUs and only 4.96% of this Primary Energy was provided by wind and solar. This after decades of subsidies. Anyone that thinks wind and solar can replace the 92% conventional energy sources by 2030 or even 2050 are delusional. I wrote a previous article to discuss the “Impossibility of Achieving Net-Zero Carbon”. Then the Hawaii early adoption of the “Green New Deal” became public information. Hawaii is an “Energy Island” situated geographically with plenty of sunshine and wind. Their experiences with renewables has been very expensive and at reduced reliability. You can read more on the Hawaii experiences with renewable power here. Why? Hawaii is the perfect experiment to “Transition” to renewables with no Grid connection. Therefore, the availability, affordability and practicality is a perfect science experiment. Does anyone think electricity costs of over $0.40/kWH will improve the lives of Americans? Improve our economy and world competitiveness of manufacturing? I think not. EIA electricity costs by state here.
Americans use between 833,000 and 1,000,000 BTUs of energy each day to sustain our quality of life. There are some misguided leaders and politicians that are on a path to destroy the magnificent prime movers that power our lives.
Do you remember this poem from 1948?
First They Came, by Pastor Martin Niemoller
First they came for the Communists And I did not speak out Because I was not a Communist Then they came for the Socialists And I did not speak out Because I was not a Socialist Then they came for the trade unionists And I did not speak out Because I was not a trade unionist Then they came for the Jews And I did not speak out Because I was not a Jew Then they came for me And there was no one left To speak out for me.
The environmental activists and Democrats in the U.S. have an anti-Carbon policy that has nothing to do with protecting human health or the environment. It is an agenda for one world government and control of our lives. We could paraphrase Martin Niemoller’s poem with the words….“First they came for Coal”. Trust me friends, the Biden-Harris and Democrat Party Climate Policies are NOT based on protecting your health. The (D’s) hate fossil fuels, including natural gas. The U.S. is on a path this year, to depend on about 50% (interruptible pipeline supplied) Natural gas fuel for power generation. I do not think this is wise. The Zimmer coal plant is an example of true “Energy Storage”. A coal pile plus, Coal barges tied up adjacent to the plant can provide weeks or months of Primary Energy storage. Pipelines are vulnerable to harm, whether accidental or malicious. Battery storage systems are for hours at best. Think about Grid Security and the many threats, within our country from Deep State Regulators (EPA, BLM and more) and Politicians, as well as from criminal minded foreigners. There are many threats to the energy supply to the country we love. Threats to your conventional energy powered lifestyle…..Please, THINK before you vote.
America uses right at 100 Quadrillion Btus of Primaryenergy each year.(12 &13) We have used right at this amount of total Primary Energy for over 20 years. The entire world uses about 600 Quadrillion BTUs of total Primary energy. The energy systems to provide this indispensable primary energy are beyond huge and so large and complicated that it is difficult to describe in words. In this post, I will attempt to demystify the immensity of the energy systems we depend on.
Energy on Which We Depend
Remember the last hurricane or winter storm that killed your power and made gasoline short in supply? It seems to take a traumatic experience such as severe weather for us to appreciate the importance of energy. Whether for heating in the winter, for gasoline to take a road trip, cooking hamburgers on the BBQ or cooling our homes in the heat of summer. Like many things in life, “Energy is not missed until it is unavailable”.
Dr. Robert Hargraves wrote an excellent article entitled, “Energy IS the Economy” for Grid Brief in Nov. 2022. (48) In the Developed world affordable, reliable and affordable energy is vital to sustaining Industrial production, commerce and our economy. Energy is a prerequisite for almost anything and everything we do or have come to depend on.
315 Million BTUs/Person/Year
Each American uses on average, about 315 million Btus (BTU=British Thermal Unit) of Primary Energy each year. This averages about 863,000 Btus per capita, each day. The purpose of this article is to explain the importance of “Energy” in our everyday activities. Folks that are not involved as employees in the energy business may not have a comfortable understanding of the relationship of Primary Energy in BTUs (British Thermal Units) and work. So, let’s take a look at the fundamental energy equivalence of BTUs and work. One Btu=778 Foot Pounds of work. What is a BTU? It takes 1 BTU to raise one pound of water 1 degrees F.
Example: A pint of water is about one pound. So visualize warming a pint of water from 32 degrees F. to 212 degrees F., (That will require 180 BTUs. 212-32=180)
Another equivalent to keep in mind; One kWh of electricity is 3,413 BTUs. These equivalents are at 100% conversion efficiency. Since our grandparents days, we have come to use and depend on a lot of thermal energy to replace animal and human muscle power. The replacement of muscle power with heat engines fueled by energy has served Humanity very well over the last 130 years. Both in heat engines for transportation and for Bulk Electric Power Generation by Electric Utilities. Replacement of muscle power with thermal energy has come a long way since my grandparents days.
This commentary is my attempt to explain the vastness of the energy systems that have created the high quality of life on which we depend and take for granted, thanks to heat engines and thermal power plants.
Why BTU’s? (British Thermal Units)
Government energy statistics are expressed in BTUs, and the BTU equivalent of wind and solar are calculated and converted to BTUs. Example; One kWh of wind or solar is equivalent to 3,413 BTU. International journals and reports may use other energy units, such as kWh’s or Joule’s. In the U.S. our EIA (Energy Information Administration) uses BTUs as the unit of energy for data reporting.
Dr. Lars Shernikau has published an excellent article explaining Primary Energy in his article, “Primary Energy is Still King”(34) I recommend reading this, because he has done an excellent explanation to provide an understanding of primary energy and renewables. Here.
100 Quadrillion BTUs/Year
Coal, oil, natural gas, nuclear, wind and solar are included in the LLNL chart below to total 100.3 Quadrillion BTUs of Primary Energy for the year 2022. It is my hope that this post will help the reader to get your arms around the vastness of our supplies of Primary energy and what it does for us. A reminder: Electricity is Secondary Energy and Primary Energy is required to generate Electricity. Each Kilowatt Hour requires 3,413 BTUs at 100% efficiency. The most efficient GTCC generating plants are about 60% efficient so that is about 5,690 BTUs of input to the gas turbine at steady loads at the most efficient load point to produce one kWh of electricity. A deeper dive into Heat Engines and heat rates are topics for another time. Suffice it to say, we use a lot of primary energy for electricity generation, a little more than a third (37.7 %) of the total primary energy America consumes.
Transportation, Industrial, Residential and Commercial Energy Demand
We also use a lot of primary energy for transportation, food production, residential heating, cooking, commercial and industrial production. Long story short….reasonable cost, abundant and reliable energy powers our high quality of life.
Examples and Reminders of the Immensity of the Energy Systems on which we Depend
The U.S. Electric Grid has been described by the Smithsonian (and others) as “the Largest Machine Ever Built“, here.
The quantity of motor fuels used each year was described in 2007 by the National Petroleum Council chairman, Lee Raymond,
“As enough to fill 150 billion one gallon cans that if placed end to end, would circle the earth 1,000 times”(2)
That was 2007. In the year 2022 motor fuels increased and the U.S. used 209 billion gallons of gasoline and Diesel fuel.(3,4) Gasoline and Diesel are forms of Primary energy. That is a 39% increase of motor fuels in 15 years.
America uses right at 20 million barrels of oil each day. The total petroleum use in Quadrillion BTUs energy is about 36 Quadrillion Btus/year. This is about 36% of the Primary Energy we use. Below is a photo of me and the 48″ Alyeska (Alaska) Pipeline. This 48″ line is above ground to protect the frozen Tundra. The Alyeska Pipeline at its peak flow delivered about 2 million barrels per day of crude oil from the north slope of Alaska. It would take ten pipelines the size of the 48″ Alaska Pipeline to provide the petroleum needed to supply 36% of America’s total Primary Energy demand and needs.
Perhaps you can visualize in your mind, ten of these lined up side by side easier than you can imagine 150 Billion one gallon gasoline cans circling the earth 1,000 times? That is how much crude oil we need and depend on to provide a little over one third of our Primary energy needs. In addition to transportation energy needs, petroleum is also used as the feedstock for plastics and thousands of other products. Ron Stein has written much on the thousands of products derived from petroleum. Here is one of his excellent articles, “Are Politicians Oblivious to the Need for Crude Oil, or are they Intentionally Sending Us Back to the 18th Century?“.(49)
Alaska Pipeline and Dick Storm, photo used in numerous Presentations
How About Coal. Is Coal Still Important?
For electricity generation Coal provided over 50% of the primary energy to generate U.S. electricity up till about 2011. In 2011 about 22% of America’s Primary Energy was provided by coal. (This is a fact). In 2011 the total Primary energy use was 107 Quadrillion BTUs and coal provided 21% of the total. Since 2012 much of the coal power generation fuel has been replaced by natural gas. Here below, is the EIA Total Energy Flow Chart for 2011. This supports my statement that America has depended on about 100 Quadrillion BTUs of energy for decades. In the 2011 example, Total Primary Energy was 107 Quadrillion BTUs.
Today coal fuel provides about 20% of the fuel used for electric power generation. To be exact, coal provided 9.9 % of the total primary energy in 2022. Coal use provided the fuel for about 20% of the electricity generation in that year.
Primary & Secondary Energy
Please note: When I discuss Primary Energy and Electricity generation percentages, it may seem confusing. Both statements above are correct. Coal provides fuel for 20% of our electricity generation and coal provides 9.9% of our total Primary Energy. The apparent discrepancy is the reporting of total Primary Energy and Total Fuel used for electric power generation. Electricity is important and it represents the consumption of 37.7% of total primary energy, including renewables. The LLNL chart above shows the other major consumption of energy for Industrial, Commercial and Residential uses. The difference between Primary Energy and Secondary Energy is important, but this is rarely explained when the term, “Electrify Everything” is used.
Coal Fuel for Electricity Generation
Now let’s get back to the importance of coal. Today about 10% (I rounded 9.91% to 10) of the U.S. primary energy is provided by coal. This is about 10 Quadrillion BTUs. The photo below is a coal car which holds 100 tons of coal. The length of the coal car, coupling to coupling is about 55 feet. The heat content of 100 tons of western Powder River Basin coal at 9,000 BTU’s per pound is about 1,800 million Btus per coal car. Dividing 1,800 million Btus into 10 Quadrillion results in a train of coal cars about 52,083 miles long. Long enough to circle the earth two times. That is just the coal used in the U.S.A. in 2022 and we used more than twice that much in 2011. (see 2011 Sankey Diagram above)
A typical 100 Ton coal car. The energy equivalence of 100 tons of 9,000 Btu/# coal is 1,800 million BtusTypical Unit Train of about 100 coal cars, each loaded with about 100 tons of coal. The total energy of a 100 coal cars is about 180,000 million Btus or .00000018 Quadrillion Btu
Again, to supply 10 Quadrillion Btus of coal for electricity generation in the U.S. the coal would fill a train that would circle the earth two times. Just as a matter of reference, the amount of coal used in China is more than five times the coal consumed in the U.S.A. According to World O Meter, China uses about 4.4 Billion metric tons/year. According to the IEA, Coal was the primary energy used to provide 60% of China’s electricity in 2022. (22) Coal is the top fuel for electricity generation in most Developing countries and including China and India. As shown below, in 2023 the world used an all time record of coal use.
On January 6, 2024, here is a screen shot of the MISO (Midcontinent Independent System Operator) Energy RTO. Note that although coal is not believed to be needed by government Bureaucrats, the MSM and environmental activists, it is providing almost 40% of the electricity being used this day at 0600. A post on the Count on Coal Blog is aptly entitled, “2024 A Critical Year for Grid Reliability” which provides another take on the importance of coal (20). Also POWER Magazine Commentary,“EPA’s No-Win Rule for the Electricity Grid” July 2nd, 2024. (50)
Here is an update from Jan. 2024 on coal power in the Midwest from the website of MISOEnergy.org.
What does the rest of the world understand that we do not? More coal was used in 2023 than all of history.
Coal remains important in America. The Count on Coal Blog offers many anecdotes, data and environmental policy assessments. (20)
Especially in winter, because snow storms will likely be even more difficult for electric Utilities to keep up with demand. In addition to the problems of snow blocking solar collectors, ice on wind turbine blades make them less reliable as well. It is worth recalling the winter storm in Feb. 2021 which created Blackouts in Texas and a near collapse of the entire ERCOT Grid. Over 246 people were killed during that storm. Many as a result of the rolling Blackouts. I wrote my views on the missing 6,000 MW of coal plant capacity that had recently been shut down, on this blog.(51)
How About Natural Gas?
How do we visualize 33 Quadrillion Btus in natural gas? About 1/3 of America’s Primary energy is provided by natural gas and about 50% of our electricity is expected to be generated from natural gas in 2024. So, to get an idea of the enormity of the importance of natural gas, let’s try looking at pipelines providing natural gas across the U.S.A. Here is the EIA map of Interstate natural gas pipelines in the U.S.
Regulations and Environmental NGO’s hate pipelines and do all that they can to restrict their expansion, but that is a story for another day. (21) Suffice it to say, natural gas is very, very important to America in 2024. It is projected that in 2024 natural gas will provide the fuel for about 50% of all U.S. electric power production.
It is difficult to visualize the enormity of the natural gas flows from the map. Also difficult to visualize 33 Quadrillion BTU of invisible natural gas flowing through a pipe. So, let’s try this, a photo of an LNG Tanker. Natural gas stored as a liquid at about minus 263 degrees F.
Liquified LNG is about 1/600th the volume of the gas as used for power generation or cooking.
This LNG Tanker holds about 4,770,000 cubic feet of natural gas, when vaporized for use. This is equivalent to about 5 trillion Btus. This equates to about the same energy equivalence of three Unit Trains, each comprised of 100 coal cars.
To visualize 33 Quadrillion Btus, picture 6,000 ships such as the one shown above.
So, how do you visualize an armada of 6,000 ships like that shown above? Try this. If 6,000 ships, each 950 feet long were placed in a line, stem to stern touching, they would reach over 1,070 miles. So a continuous line of ships from just south of Philadelphia in the Delaware Bay would reach to Miami. This would represent the quantity of natural gas, stored in super dense liquid form used in one year. This line of ships would be equivalent to the natural gas burned in the U.S. in 2022. In 2024 gas consumption will be even greater.
The latest LNG ships are larger at about 175,000 cubic meter capacity, such as the ship Pan American shown below.
Energy use is directly related to economic output and the quality of life we enjoy. Economic prosperity is another subject, so let’s stick to the immensity of the quantity of energy that we need and depend on. If you are interested in the relationship of energy and economic prosperity, there are numerous references below. ( 5, 6, 7, 8, 9, 10, 11)
Getting back to electricity and the largest machine ever built. Yes, the Electric Grid is huge and complicated. However, huge as it is, the Electric Grid uses about one third of the total primary energy used in the U.S. The other two thirds is used for transportation, Industrial production, heating, cooling, cooking and commercial uses. “Electrifying Everything” as promoted by numerous non technically trained politicians, NGO’s, wealthy Philanthropists and well intentioned corporations, is simply not possible.
Paraphrasing Lee Raymond’s comments in 2007,
“It will take an enormous effort and a lot of time to replace the current energy systems”(2)
Take a look/listen to Lee Raymond for about two minutes. Start at minute # 8 here.
From Dick Storm presentation to Rotary Club, Dec. 7, 2023 (14)
Primary Energy Use of the U.S. 100 Quadrillion Btus/Year
The Lawrence Livermore National Laboratory Sankey Diagram of U.S. Energy Flows for the year 2022 is copied below. The energy use is reported in British Thermal Units so that one unit of energy can express all common forms of energy that we use. The energy sources reported are wind, solar, petroleum, natural gas, nuclear, hydroelectric, Biomass and Geothermal. Interestingly to me is the fact that America has used a steady flow of about 100 Quadrillion Btus of energy (+/- 10 Quads) for about the last 25 years. This in spite of population growth and increased electrification of nearly everything we do. The chart below shows the flows of sources of PRIMARY Energy.
Hydrogen is not on the chart but there is a lot of talk about the future of hydrogen as a fuel. Let me just state for now that hydrogen, like electricity, is another form of Secondary Energy. It takes about 3 or 4 units of Primary Energy to produce one unit of hydrogen energy.
The next graph is also from the U.S. Department of Energy and it shows the total energy use by fuel since the Founding of America. The key point is: Over 90% of the Primary energy we depend on each day and use, is sourced from conventional sources of gasoline, Diesel, natural gas, Jet Fuel, coal, nuclear, Hydroelectric and Biomass. Only 5.71% of the Total Energy used in 2022 came from wind and solar.
Electricity and the Grid, “The Largest Machine in the World”
The following is copied from a post by Bloomberg and I give full credit to Bloomberg and the author. It is well stated and I thought apropos to explain the Immensity of the electric grid. From Bloomberg and to be fair, this refers to the electric grids all over the world, not only the U.S.A. …..
“Bloomberg 2 May 2023 Merryn Somerset Webb There is something attractive about things that are complicated, boring and expensive. What is the biggest thing that mankind has ever built? All the obvious answers to this pub-quiz question are wrong. It is not the Great Wall of China, nor the Three Gorges Dam, nor the Large Hadron Collider. It is also not Terminal 3 at Beijing Capital International Airport. In fact, the feat belongs to something rather prosaic: the global electricity grid. The total length of the distribution grid globally is estimated to be some 56 million miles, though it’s hard to be sure. The circumference of the world is an around 24,900 miles. Our electricity transmission lines can g o around our world 2,250 times over. So it’s big — very big. It’s also in an awful lot of trouble. ……So next time someone from the Green Party or government tells you that the energy transition is cost-free, ignore them. It most definitely is not. You can’t double the size of the biggest thing in the world for nothing.” Emphasis on the last line by me.
However, because the IRA codifies the “Green New Deal” we cannot exactly ignore government as we watch them destroy the largest machine ever built. I wrote about the Great State of Hawaii a few years ago. Hawaii adopted the “Green New Deal” several years before Congress passed the IRA. Unlike California or other states, Hawaii is an “Energy Island”. Therefore, the consequences of the Green New Deal are experienced faster. Take a look at what I wrote a few years ago and check the current electricity costs in Hawaii. Also, an update here.(53) Then you decide how inexpensive renewables are. (52)
Conclusions
Replacing the energy of 100 Quadrillion BTUs with wind and solar is impossible. The foregoing described the immensity of petroleum use and the electric grid. Also, the Lawrence Livermore Laboratory, Sankey Diagrams show energy flows for the years 2011 and 2022. In the 2022 LLNL diagram, wind and solar provide less than 6% of the primary energy used. This meager, less than 6% contribution of intermittent power is after decades of subsidies.
All fuels, including coal should be included in America’s energy mix. Why? For many reasons, here are four; 1. The U.S. is the Saudi Arabia of coal and we have more high quality fuel within our borders than any other country, 2. A 60 day coal pile on the plant site is the best proven energy storage known, 3. Coal plants provide Dispatchable Bulk Power and can run 24/7 300 plus days per year and 4. Coal generated power is affordable. Just check the electricity prices of states that generate most of their power from coal and compare to the electricity rates in Hawaii and California.(57)
My concern is that we have not built a new clean coal plant since 2013 and the U.S. manufacturing supply chain is threatened. Not only manufacturing facilities, but also including skilled engineers, technicians and welders. The recent history of the decline of the supply-chain for nuclear power plants is an example. In the 1970’s, America had the largest and best manufacturing supply chain for nuclear power plants. Over a period of about 40 years America built nuclear power production capability for about 20% of America’s total electricity production. 1949-1989) Most of the manufacturing that built the robust, reliable and safe nuclear fleet are gone. We should not let this happen to the supply chain for clean coal plants. Remember the names Combustion-Engineering, Westinghouse, Allis-Chalmers, DeLaval, Foster-Wheeler and more…? Thankfully, we still have Babcock & Wilcox, but much downsized from when I worked at B&W in the 1960’s. I wrote on this blog about the Rise and Fall of Nations from the perspective of nuclear power systems manufacturing and some photos of U.S. Reactor and steam generator manufacturing from the 1960’s are included. We can “Hope” for sanity in public education and government Regulations so that some day American manufacturing will be great again. (54)
Energy policy in the U.S. as one well respected energy issues publication author stated, “American Energy Policy is a Mess”.
Worse yet, the average voter has been indoctrinated with misinformation that the Climate has been altered by the burning of fossil fuels and the future of the earth is in peril because of combustion of fossil fuels. The largest scientific hoax in the history of mankind.
On enemies, Sun Tzu said “Know the enemy and know yourself in a hundred battles you will never be in peril. When you are ignorant of the enemy but know yourself, your chances of winning or losing are equal. If ignorant both of your enemy and of yourself, you are certain in every battle to be in peril”.(1)
Most of the American people have no idea of who the enemies of coal are. In fact, I worked in the coal power industry for about thirty years before I became aware of some of them. The true facts are, that there are multiple entities and organizations that are enemies. Let’s call them “Carbon Hating Tribes”. These Tribes include rogue Bureaucrats (alphabet agencies of the U.S. Federal Gov’t) politicians, Well funded NGO’s, Public education K-12 plus many Universities, Public Broadcasting, Billionaires who do not understand the importance of Domestically produced Primary energy, U.S. elected politicians, the United Nations, the World Economic Forum, the MSM, the Entertainment Industry, celebrities and foreign participants that wish to weaken the U.S.A. I tried to capture some of the prominent anti Carbon Tribes in one meme which I have used in my public presentations. Most of the leaders and the members of these anti-coal Tribes, are NOT elected by the U.S. citizens . I have written several previous commentaries naming some of the individuals and organizations. (6, 207, 208) A Congressional report also outlined the escalation of the war on coal during the McCarthy years at EPA in the Obama Administration. (10)
More on the influencers of Net-Zero Carbon before. Here,here and here. After years of observations from the industry and research, I am of the strong opinion that the priorities and goals of “Climate Policies” are really not about improving human health or saving the planet. Thomas Shepstone captured my thoughts in his Substack entitled, “Energy Matters If You Value the Life You Now Have and Don’t Want to Live Under Socialism” (210)
Those of us that understand energy and electricity generation are a small minority that I estimate at 3% of the population. The “Good Guys” that understand energy and electricity generation are vastly outnumbered and out shouted. The enemies of coal are also the enemies of Liberty, Freedom and Capitalism.
Are You Worried About the Future of the U.S.A.?
This excerpt from my previous blog post and it is worth repeating. This is from my commentary entitled, “Are You Worried about the Future of the U.S.A.?” I posted this the day after inauguration day, January 21, 2021.
“The November 2020 Presidential Election to put it politely did not end with the best interests of America as a priority. President Biden disingenuously said at the inauguration, that he wants to unite the country. Then he went to the Whitehouse to sign Executive Orders to Cancel the foundation of our economic growth during President Trump’s four years. He is in the highest office of the world and he has plans to use the power of that office to do as much harm as possible to America. I don’t know why the Democrat Party, Liberals & the Mainstream Media can be so hateful of America. But they are.
Their Goals seem to be to Dismantle America’s #1 Position in the world as a Beacon of freedom and to harm or kill the largest Economy on the planet. Biden’s first step to weaken the U.S.A. is to reduce Domestic Energy Production. Reasonable cost energy is a huge component of world manufacturing competitiveness. Abundant production of reasonable cost energy also creates and sustains “Jobs” too! To put it into in a four letter word Mr. Biden may understand.
I will be perfectly honest, I am concerned for the future of America. Here are some of the reasons why I am concerned…...”Continue reading on blog post here
Background of The War on Coal
I have followed the war on coal since the 1990’s and the enemies of coal have gained strength and political power. Now with a rogue, out of control EPA and Biden as President, they have near Totalitarian Control over the entire government. In fact, Biden’s #1 Priority is/are the bogus, “Climate Policies” which have weaponized all of the government swamp Bureaucrats and all alphabet soup agencies including the EPA, BLM, SEC, Dept. of Defense, DOJ and more. This is a War on the American people and America’s productive capacity. This is a war that we must win. I have completed presentations to groups and written on the beginnings of the war on coal since about 1995 when it first dawned on me that these people in the EPA are trying to kill coal. Yes, it started during the Bill Clinton Presidency when Carol Browner was EPA Chief, and was escalated with Obama. (See the 2015 Congressional report on the Obama Carbon Mandate(10) , Here. ) Up to about 2012 about 50% of our electricity was generated by coal fueled power plants and I thought it was inexplicable and not possible that the government would wage a continuing war on the American Treasure of coal. Since 2012 over 102,000 MW’s of reliable, affordable, Dispatchable coal power generation capacity has been shut down. I presented this at the ENERUM energy Forum in Columbus, OH in 2022. (215) A modern, new clean coal plant has not been built since 2013, yet hundreds have been shut down and Demolished. (11, 12, 13, 14, 215) The two photos below are typical of how U.S. Utilities dispose of coal plants. This one is Genoa #3 of Dairyland Power, near Lacrosse, Wisconsin. Yes, it was old, but it should have been replaced with a new coal plant. The other is the Duke Sutton #3 which I was the manufacturer’s lead startup engineer in 1972.
The U.S. Government is Choosing Euthanasia for our Energy & Electricity Generation Infrastructure. Why?
I saw a bizarre story in the “Free Press” about a perfectly healthy young woman that has decided to end her life. The article title: “I’m 28. And I’m Scheduled to Die in May.“I did not make this up, read it here in the Free Press. After a dozen years of watching Obama, Biden, Swamp Bureaucrats, NGO’s, the MSM, Entertainment and energy ignorant but wealthy celebrities demonize coal….the planned death of Zoraya ter Beek seems similar. The big difference is, Zoraya Ter Beek has made her decision by herself. The American people are having Euthanasia of our energy and electricity infrastructure forced on us and likely to cause economic harm, pain, suffering and deaths of our American citizens. Being done in plain sight, eyes wide open and the perpetrators have about 50% of the voters support. Wake up America!
So much for “We the People” having a say into policies that impact all of us and all that we do. (Note the meme above of energy policy influences, none were elected by the people of the U.S.)Think about loss of power, loss of gasoline availability and cancellation of public transportation. Loss of heating, HVAC, refrigeration and just about everything we depend on, including food production and distribution. Dr. Robert Hargraves wrote an excellent article on “Energy IS the Economy“. It is here in Grid Brief, Nov. 2022. I live in Hilton Head, SC. The last time I remember losing power and having gasoline shortages was Hurricane Mathew in 2016. It has been very easy for many residents to forget what loss of power meant for just a few days. In February 2021, Texas suffered a massive statewide Blackout. That was in winter and cold kills more people than summer heat. The Texas Blackout killed a minimum of 246 people. I predict that, If the EPA and the Biden Administration is not reined in, more people will die in the near future. Why? Because of Bureaucratically enacted and foolish Climate Policies. Keep in mind electricity supply is comfortably easy to sustain during the spring and fall months. The challenge is PEAK Demand periods in the summer and winter. Perhaps that is one reason the EPA and the administration release these excessively restrictive rules in the spring and fall? I wrote my commentary on “Threats to the Grid” last month. It is here. An excerpt of that commentary listing the ten largest threats to Grid Reliability follow. These are based on my experience and my opinion:
The top 10 “Threats” are ranked, with the greatest risks first. All of these risks could be mitigated if energy and environmental policies were in effect the same as they were in 2012 when the U.S. had amongst the cleanest air in the industrialized and Developed world. There is a lot of blame to be spread around, but these policies are threats to Grid reliability.
Government Agency Climate Policies, EPA at the top, SEC, BLM, DOD, DOJ and all of government is wrongly applying “Climate First” policies rather than the Best policies for America and younger Americans to experience the “American Dream” as my generation did
Creation of RTO’s that absolved most utilities from planning for future electric generation growth, ie, plants can be shut down without a Utility being required to replace it with like, Dispatchable generation
Environmental Extremist/Activists that use enormous wealth to demonize carbon (and support (D) politicians against the Best interests of the U.S.A.
Wealthy Business people who fund NGO’s to Decarbonize the western world
The United Nations IPCC, Agenda 21, Agenda 30 and other so called “Climate Policies”
The World Economic Forum and the members who under the guise of saving the planet are forcing policies of De-Growth, De-Industrialization and Energy Poverty on all of the people of the western world, but not the BRICS, and other countries aligned with Russia and China
“Woke” or “Politically Correct” companies including electric Utilities and Co-Operatives that espouse solar and wind power as being capable of replacing coal, oil, gas and nuclear energy
Public Education, K-12 and Universities that promote climate scare tactics to sway public opinion toward accepting higher energy costs and reduced reliability of energy and electricity
World Bank, IMF, Large Banking and Investment companies that determine which infrastructure projects to finance
Terrorists or criminal acts of sabotage When I first wrote this commentary, I placed terrorsists as last in the hierarchy of risks. Now, with millions of illegal immigrants from dozens of countries, some that are enemies of the U.S. Perhaps the priority should be higher. It is in fact, a risk to Grid reliability and Green Policies have made the Grid more vulnerable to attack.
If you are interested, here are three previous blog posts on the beginning of the War on Coal and the some of the individuals and groups that have been involved. Here,hereand here. The IER has prepared an excellent report which enumerates on the vast energy resources within America’s borders. (6)
The American Coal Council Letter to Elected Officials-May 17, 2024
Emily Arthun, President of the American Coal Council prepared a letter for supporters to sign and submit to Congress. The letter is copied below and I support Ms. Arthun’s comments 100%! I have submitted to my elected officials:
“Dear Senator Graham, Senator Scott and Congresswoman Mace,
As you know, the Environmental Protection Agency (EPA) recently issued a number of new regulations, such as the Clean Power Plan 2.0 (CPP 2.0), the Mercury and Air Toxics Standards (MATS), new rules around coal combustion residuals (CCR), and others that will have direct and detrimental impact on coal-fired power plants and the people that depend on them for reliable and affordable power. I urge you to hold agencies accountable for overreach and careless rulemaking which is intended to force coal plant closures and endangers the reliability of our electric grid.
Coal supplies affordable power when other sources cannot. It plays a critical role during times of intense demand, such as during cold snaps and heat waves, ensuring that the lights stay on and the grid remains reliable. According to recent reports, electric utilities have nearly doubled their forecasts of how much additional power they’ll need by 2028 given the torrid pace of data center development and other manufacturing demands that are putting new pressures on the grid. Despite the promise of renewable energy technologies, coal remains a critical energy source that must remain in use to prevent crippling energy costs to low-income families and to ensure energy shortages do not put unmanageable pressures on the grid.
The EPA has crafted a suite of rules specifically designed to force the closure of reliable and efficiently operating coal plants. These plants are the primary source of power generation in many states, and a significant source of grid-saving baseload power across the country. Further, the EPA issued these rules while conducting zero analysis of the collective impact of the new rules on grid reliability. EPA’s rules fail to account for the fact that electricity prices are increasing above the rate of inflation, demand is expanding, grid experts are already issuing warnings concerning plant closures, and there is no adequate replacement ready for the sorely needed, dispatchable generating capacity coal provides. Further shuttering coal generation will have a devastating impact to communities and our economy.
Thank you for considering my concerns, and I hope you will take swift action to support reliable and affordable energy for United States citizens and industry.”
I hope each reader will send a similar letter to your elected officials. The EPA and extremists are at War with the American People. We the People MUST win this final battle.
America is Blessed With Enormous Natural Resources of Critical Minerals and Including Coal, Uranium, Oil and Natural Gas. We Should Use them All!
Why would “We the People”...Not use the God given natural resources that America is Blessed with? A good question. My previous commentaries have expounded on the individuals, NGO’s, and others that have created the insane Net-Zero Carbon policies. Because I have written so much on this, I will not repeat my concerns and some would say, my rant. However, if you are interested, here are fourteen blog posts that attempt to show who and how the anti-American Climate Policies have come to be. The Biden Climate Policies must be reversed to win the War on America’s Productive capacity and the Best interests for the American People;
Remember the poem by Martin Niemoller to describe events leading up to the Holocaust? We could paraphrase and say: First they came for coal…..
FIRST THEY CAME
First they came for the Communists And I did not speak out Because I was not a Communist Then they came for the Socialists And I did not speak outBecause I was not a Socialist Then they came for the trade unionists And I did not speak out Because I was not a trade unionist Then they came for the Jews And I did not speak out Because I was not a Jew Then they came for me And there was no one left To speak out for me.
There is a parallel strategy by the enemies of coal. Today it is a war on coal, later they will (actually, they already are) attack natural gas and oil, your freedom of transportation, what you eat, how you cook and more.. Even worse, the forces against coal are also against the one zero carbon source of carbon-free dependable, Dispatchable Bulk Power, nuclear. The Sierra Club and other extremist NGO’s have been opposed to nuclear power. So, if it is not protecting human health or the environment, then what is their motive? My friend Thomas J. Shepstone has an answer in a Substack post we corroborated on titled, “Energy Matters If You Value the Life You Now Have and Don’t Want to Live Under Socialism“
Please Consider…..
Do yourself and all Americans a favor. If you already understand energy and electricity generation, help teach those that are not well informed. My estimate is that only about 3% of the American population really understands Primary energy, electricity generation and energy economics. Here are some examples of my attempts.(23, 30, 31)
If you are one of the 97% that does not understand energy and electricity generation, (or have been indoctrinated to demonize carbon) please ask me or anyone else who does understand energy to please take time to explain how government policies and cultural indoctrination has placed America on a path of self destruction.
Yours very truly,
Dick Storm, May 18, 2024
If you are interested in digging down for more research, then here are hundreds of references to support my claim that the EPA and Environmental Zealots have America on a Net Zero Path to Destruction:
Conventional fuels, including coal provide most of the power needed to sustain our high quality of life. During 2022 coal use in the world reached a new high and provides the fuel for about 35.4% of the world’s electricity generation. Asia’s electricity generation was 82% from coal fuel in 2022(40, 41)
Meanwhile, the current U.S. government policy, green religion, renewable energy policies and crushing regulations are geared toward electrifying everything. Including transportation. The emphasis on phasing out internal combustion engines for autos is well publicized. This outlawing without Congressional action of internal combustion engines in spite of the majority of Americans desire to keep gasoline and Diesel powered vehicles seems unlawful to me? Then, on Good Friday Biden’s EPA issued new rules on electrifying heavy trucks. The EPA is out of touch, not only with their purpose of protecting human health, but also with Physics, Thermodynamics and Reality. The Demand for electricity is increasing because of increased use by Data Centers, EV’s and the natural organic growth of electricity as people of the world are lifted from poverty.(60) The surge in EV Demand has not really been felt yet because EV’s are still a small percentage of the total U.S. vehicle fleet.
The EPA is on a mission to kill coal plants regardless of the harm to our country, it is a rogue government agency, staffed by extremists, guided by extremists in the Biden Administration that are using the regulations as a weapon against the Best interests of America and the citizens. (1, 2, 3, 4, 5, 6) America needs to use all fuels which are within our borders and including coal. America is the Saudi Arabia of coal and has the highest quality & richest coal deposits on planet earth. We should use this God given Primary Energy Treasure to keep America strong.
The lure of billions of dollars in tax subsidies has made otherwise well run organizations and corporations to become “Woke & Green Biased”. It is extreme fantasy to believe that wind and solar can power the economies of Developed Countries. Yet, policies of many otherwise well run companies and organizations, even when they employ well trained and experienced engineers that know better, promote the “Green narrative. One example of this green wokeness is the “PowerGen” Conference. This conference was one of my favorites and I have been a presenter for decades since the 1980’s. In January I was asked by a Utility engineer friend, Mark Barton, along with two other senior power engineers, Frank Mitchell and John Grusha, to serve on a panel. The title of the Panel: “Legacy Perspective of 100 Years of Power Generation Experience”. I wrote my take aways here. (35) Frank Mitchell, retired from AEP and now active as an independent consultant also has published many technical papers on power generation. One entitled, “Analysis of Variable Renewable Energy and Reserve Margins” is available from the ASME. (36) Suffice it to say, the panelists involved do not agree with the Net-Zero Carbon path our country is on. We are not alone.
Also hard to understand is the well respected POWER Magazine embracement of renewable power to “Electrify Everything”. Here is an excerpt from this month’s POWER Magazine. This is written by Matt Helgeson, head of Sustainabilityfor Siemens USA.(8) He also should know better.
“The “electrification of everything” is
underway to not only decarbonize,
but also support optimized, safer and
more resilient processes and systems.
This concept means that we are replacing
our fossil fuel economy with wind,
solar, hydro, electric vehicles (EVs), heat
pumps, and more. This transformation
will be made possible—at scale—with
the application of digital technologies.
However, the challenge arises to electrify
everything before the grid is fully “green”
if we are going to appropriately and effectively
address climate change.
From electrifying buildings and vehicles,
and navigating the impact to the
grid, the technology to accomplish a fully
electric transformation is available today.
And now’s the time to utilize these technologies
to ensure that everything that
can be connected to the grid is electrified.
We’re running parallel races to transition
power generation to renewable sources,
improve the grid to manage those sources,
and replace infrastructure that’s ready
to use the power delivered to it.
Electrification of Transportation
An exciting and rapidly advancing industry
transformation is the electrification of transport.
According to Car and Driver, 2024 is
expected to set a new record for EVs sold
and their share of the total market. Further,
the EV market is projected to have a compound
annual growth rate of about 10%
projected through 2028, leading to more
than $900 billion in sales that year.
As the need to reduce carbon emissions
has become clear, we’re seeing
unprecedented support and funding from
the federal government to deploy EV infrastructure.
State and local governments”
Dick Storm’s Love of Power, Articles and Commentary in POWER Magazine….
POWER Magazine has been my favorite power generation magazine since 1959 when I was a teen and just beginning preparation for a career I loved in power generation. I was inspired by Steve Elonka’s fictional character “Marmaduke Surfaceblow” who was a “Globe Trotting Consulting Engineer” that solved power engineering problems around the world. I wanted to become an engineer like Marmaduke Surfaceblow. I pretty much succeeded in that goal. Thank you POWER for the inspiration! Later in my career I was a contributing editor to POWER Magazine where I shared the Storm Technology team’s experiences in improving combustion and efficiency. As recent as 2021, my commentary was published in POWER, which I still believe and stand behind. (9) Linked Here and it is a contrast with the Siemens commentary this month. A few other POWER articles I contributed are listed below in the references. (9, 10, 11, 12, 13, 14, 15, 16) I remain very proud of what I did to make a small contribution of helping generate reliable, efficient and clean coal power. Yes, I remain a friend of coal! And so should all Americans embrace coal, oil, gas and uranium use, all are fuels that are capable of being produced in the quantities we need from within our borders. More later on the need for 833,000-1,000,000 Btus per day/person to power our economy and our lives.
Reminder of the vast coal reserves in the U.S. and on the planet.
Getting back to the reality of Primary Energy and the sources of Primary energy that can meet our needs:
Meet Energy Reality
America uses right at 100 Quadrillion Btus of energy each year. This is likely to increase, that is if we maintain our high quality of life, over time. The IEA believes that with increased Data Center consumption, electricity growth will likely be over 3.4%/year. (67) Also, with more electrification, large new Data Centers, more EV’s and a growing population, Demand for electricity will grow. The entire world uses about 600 Quadrillion Btus of energy. These amounts of U.S. and world energy use are reported by numerous references. Amongst them, the IEA, EIA, Our World in Data and the Energy Institute. Most of the rest of the world is using coal. The greatest amount of coal ever used in history was the year 2023.
I have written on the 100 Quadrillion Btus that the US uses on a previous blog posts Here, Here,Here Here and Here(17, 18, 19, 20)
The “Count on Coal” Blog article quoting a conversation with worldwide energy expert, Daniel Yergin, sums up the energy transition very accurately. (27) Yergin’s comments are supported by the “Our World in Data” world energy use chart above and numerous other references included at the end. An excerpt from the Count on Coal Blog is copied below. The bold font and underlining is my emphasis:
“Renowned energy analyst and historian Dan Yergin recently observed that the world isn’t just using more coal than ever before but three times what it did in the 1960s. While Yergin recognizes significant changes in the global energy mix, he said, “I’m sick of the energy transition discussion. It sometimes loses touch with economic history and reality. If you look at the history of energy transitions, they all last for over a century. To try and make change happen in 25 years, or even half of that time is highly unlikely.”
For Yergin – and energy analysts the world over – the coal age has miles to run. The International Energy Agency (IEA) expects coal consumption in India and Southeast Asia to in fact “grow significantly.”
By 2026, the IEA expects just China and India together to account for 70% of global coal demand. Those two nations and Indonesia opened 59 gigawatts of new coal generating capacity last year. India has 85 GW of new coal generating capacity already under construction with more expected.
Both China and India are rapidly adding renewable energy but see coal as essential to helping meet rising power demand and view it as an energy security and reliability backstop. China is on track to add 200 GW of new coal capacity by 2030. For comparison, that’s more new capacity than the entire existing U.S. coal fleet.
As Dan Yergin observed, we need a better energy transition discussion. Globally, we remain firmly in an era of energy addition. Just ask China and India. “
Energy provides life as we know it
China and India are rising as economically prosperous nations and they are doing so powered by all available sources of energy, including coal.(33, 34, 65) We in America should do likewise. The last new highly efficient and clean coal plants built in America started up in 2013. We have not built a major coal plant in the U.S. in over twelve years. However, hundreds have been shut down without replacing the reliable, affordable and dispatchable generation capacity in kind. (28,29, 30, 68)
Electrifying Everything is Not Possible
To say Electrifying Everything is possible, is a ludicrous fantasy and a lie. More politely, but factually it simply is not possible. (25) For example: Ammonia, Food production, Steel, Plastics, Aluminum and Concrete all are dependent on vast amounts of Primary Energy for production. It is not an exaggeration to say Energy = Life.(25)
Further, for all of the talk on the news about inflation and the rising cost of living, this inflation, in my opinion, is based largely on the government climate policies (more correctly described as a war on carbon) that are making it harder to produce Primary energy from conventional sources and also, forcing more expensive, less reliable, variable, intermittent, renewable energy on all of us. The so called, “Energy Transition” is not a transition, it is only a “War on Carbon and Conventional Forms of Energy” Daniel Yergin said it and so did I in previous Blog posts and presentations. (28, 29, 30, 31, 32, 68) A previous article I wrote used Hawaii as an example. The Islands of Hawaii are an excellent case study in applying green only power generation. Why? Because Hawaii has plenty of sunlight and wind and it is separated from the U.S. Grid. Therefore, as the green only generation is built, with Diesel fuel backup, then the natural and high cost of intermittent green power is experienced by more use of expensive Diesel fuel. Hawaii is an ideal “Science Experiment” in using Green Power. (38)
833,000-1,000,000 Btus of Primary Energy/Day/Person
This is how much primary energy we have become accustomed to having available and at a reasonable cost. Replacing this quantity of reasonable cost, reliable and abundantly available conventional energy with renewables as stated before, is impossible. To attempt to decarbonize America will contribute to the decline of our quality of life and even worse, contribute to the decline of America. Here below is the U.S. Energy Flow Chart for Primary Energy. Prepared by the Lawrence Livermore National Laboratory.
The primary energy flow chart shows the energy flows from all of the sources of energy and how they are used. This is done in BTU equivalents to include non-thermal sources such as Hydroelectric, solar and wind. As shown on the chart, for 2022 Americans used a total of 100.3 Quadrillion BTUs of energy.
A reminder: one BTU is equivalent to 778 foot pounds of work at 100% efficiency. One kWh of electricity is equivalent to 3,412.6 BTUs.
After decades of tax subsidies the quantity of primary energy provided by wind and solar is less than 6%. The fact is, over 90% of our primary energy was in 2022 and remains in 2024, provided by conventional forms of energy: Oil, gas, coal, nuclear, Biomass and old hydroelectric dams. Remember the key words “Primary Energy” when you are told we should “Electrify Everything“. Electricity and Hydrogen are Secondary Energy that must be produced using Primary Energy.
Reality of Bulk Power Supply
Most authors refer to the Grid, (aka Largest Machine Ever Built).(59, 60) I chose to use the term, “Bulk Power Supply” because the term “Bulk Power” better describes generation from conventional power stations. When I reported for work to Carolina Power & Light Company in 1973, the sign on the office door in the central general office stated, “Bulk Power Supply”. I thought it a curious term and wondered why it was not called the “Electric Generating Department”. Apparently, many others have found the term “Bulk Power Supply” awkward too because I do not see references to “Bulk Power Supply” much anymore. However, after all of these years, I think it is the right term to describe Bulk Power Generation when discussing “Megawatt or Gigawatt Hours” not kilowatts of generation.
Let’s take a look at (Bulk Power Supply) electricity generation, by fuels over the last few years during peak summer and winter Demand periods. These are screen shots of actual data. The first is PJM on June 30, 2018. Note that about a third of the generation is by coal fuel.
Since de-regulation of electricity markets in the 1990’s, the U.S. has been divided up into Regional Transmission Operator or RTO’s and Independent System Operators or ISO’s. Here is a map to show what PJM, MISO, ERCOT, etc.
FERC.gov
First, let’s look at PJM on a high Demand day: Notice the importance of coal generation? In this example, coal power provides about a third of the total generation.
The next example is the 48 state Grid for the week January 28-Feb. 4th 2023. Note the generation by fuels. Coal is providing about 22% of the total 544,000 MWh generation on Feb. 1.
Next, let’s look at Duke Energy Carolinas for the first week of September 2023. Duke has a very balanced generation portfolio including a lot of nuclear, gas and coal generation capacity. At the moment shown, coal was providing 21% of total generation.
The neighboring Utility in SC, Santee-Cooper. A much smaller Utility than Duke, with much more dependence on coal fuel. In this example, about two thirds coal power generation is from coal. The lead photo at the top is the 2390 MW Cross Generating Station. This is a very important generating plant for my area of S.C.
The Midcontinent System Operations (MISO) is shown below for a summer day in 2022. Coal is delivering about 42% of the electricity generation at that moment. (68)
From Dick Storm Presentation to ENERUM, Columbus, Ohio, August 2022 Data from MISOENERGY.org
These illustrations are taken from past presentations I have given to show the importance of coal generated power.(68) As this is written, it is spring time and what we in the power plant maintenance business used to call “Outage Season”. Why, because power demand in the spring and fall is the lowest due to mild weather and it is the time to perform major maintenance overhauls. Typical demand curves for different seasons are shown below. From these you can imagine the risk of coming Blackouts is not in the spring and fall, but in the high demand summer or winter months. Remember Texas in Feb. 2021 with over 240 people killed by cold and power shortages?
The PJM load profile shows peak demand in the summer with high air conditioning loads. In the south many states electricity demand peaks in the winter (South Carolina as an example).
Blackouts are forecasted and warnings have been loud and clear. However, the EPA and the government continue their “War on Carbon”. This is intentionally weakening America.
Planning for Blackouts
The illustration below is from the Santee-Cooper IRP. It shows how the forecast of increasing load Demand that is greater than the installed, Dispatchable generation capacity. Some more history of failed S.C. Energy policy is on LI here. (69)
North of Santee-Cooper’s service territory is Duke Energy Carolinas. Their IRP shows a similar gap of Demand and installed capacity. Why? Because the Legislatures in both states have pressured the Utilities to stop using coal. Much of the Duke Energy Coal Plants have been demolished and they plan to completely exit coal use by 2036. The chart below is from one of the Duke Energy IRP’s and it shows an actual deficit of required generation capacity as the coal plants are shut down.
Stopping the use of coal is unnecessary. The Climate Policies are, in my analysis, not to protect the environment or human health. The Climate Policies that have been cooked up to scare the public are all about “One World Government”, Socialism and control of the citizens. Have you noticed that these Climate Policies are only being applied in the Free Western World? Yet, Asia burns over 75% of the world’s coal. Americans need to wake up and here below are some books and references to shed some more light on Climate Policies and sustaining our high quality of life.
Excellent books that forecasted the future of Electric Power shortages and the worldwide misinformation on climate science.
We Have Been Warned!
I am one of many who have warned of coming Blackouts. That’s right, I am not the first skeptic. Let me give credit to Mr. Donn Dears for being one of the first that published books on these harmful policies. Then, after over 100,000 MW of reliable coal plants have been shut down, FERC and NERC and other reputable organizations finally started to chime in. At this time, Blackouts during peak extreme weather in the summer or winter periods are expected. My previous article discussed what I consider to be the largest threats to energy and electricity generation reliability.(64)
FERC, NERC, America’s Power and many others have provided warnings. (43, 44, 45, 46, 47, 48, 49, 50, 51, 52, 53, 54, 68)
Yet, the government agencies, especially the EPA continues the same misguided path toward Net Zero Carbon. My friend, I am sad to say, my late friend, Donn Dears wrote about a dozen books to highlight foolish and un-American energy policies. Four of his books are correctly titled: “Nothing to Fear-A Bright Future for Fossil Fuels”, “Looming Energy Crisis”, “Net-zero Carbon: The Climate Policy Destroying America” and “Clean Energy Crisis”. Donn was a solid American Patriot; Navy Veteran and he had a long career as an executive engineer at General Electric. This was back when G-E was a world leader in conventional power generation equipment. Donn was truly an energy expert’s Expert! Donn’s books are available on Amazon. Worth the read, each is only about 100 pages and they are packed with facts. Donn did his best to save America, even in the last days of his life he was contributing articles and posts on his web site, “POWER for the USA” and communicating with me (and others) to review articles or presentations I prepared and then asked for his advice and review. What a wonderful man and engineer Donn was. RIP my friend, we miss you.
Donn Dears was the one that inspired me to start this Blog. I offer my experiences and my knowledge in all humility, and in memory and respect for my friend, Donn Dears. I miss his friendship and shared wisdom.
America is heading for an energy crisis and it will be hard to correct the harm that has been self inflicted by alphabet government agencies and a rogue, energy ignorant administration.
Please wake up American’s! Please do some research into the importance of energy and reasonable cost, reliable and Dispatchable electricity. Then, pass on the information to your friends and family. Do this for Donn, your own good and for your grandchildren. In my opinion, only about 3% of Americans really understand energy and electricity generation. The Marxist Left has done an effective job of indoctrinating the public with green misinformation. All of us that understand energy and electricity generation need to get involved in preaching the true facts on the unachievable “Net-Zero Carbon and Electrify Everything” nonsensical path of U.S. energy policy.
“Clean Energy Crisis”, Book by Donn Dears, 2023. An excellently written, short and concise review of the energy crisis we are facing. Available on Amazon.
The Finland GTK organization has provided comprehensive and well researched information on the challenges of providing adequate minerals for the future. I recommend referring to their excellent work. (1) Also, the National Mining Association has excellent information on their web page. (2) The current slogan for the NMA is, “Minerals Make Life”. I would add, minerals, lots of minerals are also needed for the transition to more renewable power generation. Even then, as a friend pointed out to me, the exotic minerals do not produce electricity until they are incorporated into final products such as solar panels or wind turbines. Electricity produced from renewables cannot make the products needed by society. See Ron Stein’s explanation for more on the importance of crude oil. (8, 9)
Mining and Power
My background and expertise is in electric power generation, not mining. So, why am I writing this if I am not a mining expert? The reason is, although my experiences are in combustion and power, over the last 60 years or so I traveled the world with involvement in power plants and ore processing facilities that provided electricity and combustion systems required for the mining of aluminum, copper, coal and steel. The fact is that both internal combustion engine powered vehicles and EV’s, all require lots of copper, steel and aluminum. As technologies advance for more reduced carbon power generation and use, so will the requirements for Rare Earth minerals, Uranium as well as the more common metals. Aluminum requires the most electricity for smelting of all common metals, about 5 kWh per pound. Copper mining requires a fair amount of electricity as well. For example, I once worked at the Freeport-McMoran copper mine in Irian Jaya (now called West Papua) and it had 180 MW of conventional generation just to run the ore processing equipment. A good read is the Forbes Wilson book, “Conquest of Copper Mountain” which is better than fiction on the story of how one of the largest copper mines in the world came to be. (7) Let’s get back to minerals and metals.
Time to Wake Up!
This is the title of the GTK report and I have taken the liberty of using some of the illustrations from GTK. The first slide in the GTK presentation shows the relationship of metal/minerals required by 2050 compared to the current world use of coal, oil and gas. My previous articles have elaborated on the need to supply the U.S. alone with 100 Quadrillion BTUs of energy. Mr. Michaux provides the graphic below as another approach to communicating the need of minerals.
The metals and minerals needed for batteries alone is enormous. GTK shows the relationship of minerals used now and minerals needed as more power generation is produced from renewables and more electricity is used for transportation.
Energy is required to produce these metals. Lots of energy, both primary energy such as Diesel fuel as well as electricity which is secondary energy. For example, take a look at the 400 ton mine haul truck below. This modern and efficient truck uses a 4,000 hp Diesel engine for propulsion. Keep in mind that ore deposits are mostly dirt with a little bit of metal. Typical rich copper deposits are about 1 -2% copper. So, it takes about 50-100 tons of ore to produce one ton of copper. Plus, lots of energy for processing. I also worked at a gold mine in Nevada and there the gold content of the ore was 0.2 ounce per ton of dirt and rock. So, it takes huge haul trucks to move a lot of dirt and rock for these small percentages of metal.
Conclusions
The path to Net-Zero Carbon is not possible by 2050 for many reasons. The one limitation highlighted in this article is the need for enormous quantities of new metals and critical minerals. Also, huge amounts of energy to power the mining, processing and manufacturing. The U.S. government regulations are biased against mining as well as against conventional energy use. Our government seems to hate to use our natural resources. Another slogan used by the NMA that I saw bumper stickers at a Trona mine was “If it isn’t Grown, it is Mined”. See the Competitive Enterprise Institute list of 10,000 Commandments.(6) I invite the reader to visit the web sites of GTK and the National Mining Association. They are experts in minerals and metals and offer outstanding information on their web sites.
What about Nuclear Power?
Nuclear power generation provides the greatest amount of carbon free electricity. Nuclear is the most likely solution for reduced carbon electricity expansion. Since the 1990s, despite ample domestic reserves, the U.S. has increasingly relied on imported uranium for use in nuclear power plants. Our near complete import reliance for uranium is concerning, including 60 percent of our uranium imports coming from Russia, Kazakhstan and Uzbekistan. The U.S. is currently heavily reliant on China for advanced rare earth materials needed for EVs, wind energy, and other advanced technologies, including those needed for national defense. This need not be the case, whether for uranium, rare earths or other energy materials. The NMA has further information on uranium, rare earth minerals and mining. (2, 4)
A great read not only fascinating but also better than fiction! The story of the development of a copper mine in Irian Jaya, Indonesia: “The Conquest of Copper Mountain” by Forbes Wilson, 1981
Conventional energy is vitally important for all that we do. Missing from news reports to the general public is an honest communication to try to explain the huge and enormous energy systems that we depend on each day and the impossibility of replacing conventional energy with wind and solar. To start 2024, I thought I would post a series on the Hard Truths of Energy. I borrowed the title from the 2007 National Petroleum Council report, led by Chairman, Lee Raymond, retired CEO of ExxonMobil. Petroleum, natural gas and coal were important in 2007 and they remain important today. The “Energy Density” of fossil fuels makes them indispensable to sustain our economy and our high quality of life.(4)
Fossil Fuels Provide 79% of U.S. Primary Energy
79 Quadrillion BTUs is the amount of energy we depend on from fossil fuels. This is my attempt to try to explain and illustrate what 79 Quadrillion BTUs of energy looks like. The number 79 Quadrillion is from the Department of Energy’s Lawrence Livermore Laboratory for energy use in 2022.(2) Below is a short summary of the amount of natural gas, petroleum and coal that we used in the U.S.A. in 2022.
How Huge is a Quadrillion?
I have discussed the steady U.S. energy demand of 100 Quadrillion BTUs per annum for decades and yes, 100 Quadrillion BTUs is the amount of energy we use each year and it has been steady for over 20 years.(6) Until now, I did not take the time to explain the enormity of a Quadrillion BTUs. Here is what one Quadrillion BTUs of energy is equivalent to:
Coal= About 50 million tons of coal. This would be a coal pile that would be one mile wide, ten feet high and 3.3 miles long.
Oil= 7.14 Billion gallons. See Lee Raymond quote below on the quantity of motor fuels used in the U.S. in a year
Natural Gas= 1 Trillion cubic feet. This is equivalent to 200 aircraft carrier sized LNG Tankers. More on the enormity of an LNG ship below.
It is a fact, in America, we use and need about 100 Quadrillion BTUs of energy each year.
36 Quadrillion BTUs of Petroleum
The single largest form of energy that we depend on is petroleum. About 20 million barrels per day. To visualize what 20 million barrels per day would look like, take a look at the photo of me and the 48″ Alyeska pipeline in Alaska. At its peak flow, about 2 million barrels per day flowed through the Alaska pipeline. So, to visualize 20 million barrels per day, picture in your mind, ten of these 48″ pipelines installed side by side.
Photo credit, Dick Storm circa 2007
Another illustration was offered by Lee Raymond, retired CEO of ExxonMobil when introducing the National Petroleum Council report “Facing the Hard Truths of Energy” in 2007. This explanation is offered by Mr. Raymond on You Tube, here. Mr. Raymond explained that the amount of motor fuels used in 2006 was about 150 Billion gallons. He then went on to state that if each gallon was placed in a one gallon tin can as he used in his youth to fill his lawnmower, the length of 10″ high cans, if placed end to end would circle the earth 1,000 times. That is the enormity of 150 Billion gallons of motor fuel. Mr. Raymond stated, (among other important points), “To replace current energy systems it will take a an enormous effort and a long period of Time.”(5)
The gasoline and Diesel motor fuels used in the U.S. has increased from the 150 Billion gallons consumed in 2007, to about 209 Billion gallons in 2022.
33 Quadrillion BTUs of Natural Gas
America used 33.4 Quadrillion BTUs of natural gas during 2022. Most of the natural gas used by the U.S. is distributed by a vast network of unseen, underground pipelines. Therefore, hard to visualize. So, let’s imagine that if we were to use all of our natural gas from shipments of LNG, (Liquified Natural Gas) how many huge LNG Super Tankers would it take? Such as the vessel Pan American shown below:
This LNG tanker holds 174,000 cubic feet of liquified natural gas. LNG is 1/600th the volume of the gaseous state. The ship is over 977 feet long and the gross tonnage is 114,966. This is a ship about the size of a U.S. Navy aircraft carrier. The energy equivalent of the cargo is about 6 trillion BTUs.
Now, imagine 6,600 ships like the Pan American above all lined up along the east coast. If the ships were placed touching, end to end, this would be about 1,220 miles of ships from New York City to south of Miami, Florida. That is the number of aircraft carrier sized LNG tankers that it would take to provide 33 Quadrillion BTUs of natural gas fuel. The 33 Quadrillion number is from 2022, the actual demand. The future will likely require more than 33.4 Quadrillion BTUs.
10 Quadrillion BTUs of Coal Power
Coal power has been important to the U.S. since the days of Thomas Edison, Nikola Tesla and George Westinghouse. The American electric system, referred to as the “Grid” was built on the foundation of reliable, affordable, domestically supplied and environmentally clean steam power generation fueled by coal. This took over 125 years to build and has been described by the Smithsonian as, “The Largest Machine Ever Built”. Video here. As recent as 2011 about 50% of America’s electricity was produced by steam turbines with steam generation from coal fuel. In 2022 the coal powered electricity generation dropped to about 20%. Much of the total electricity generation which was once powered by coal fuel, has been switched to natural gas fuel.
As recent as 2011 America used about a billion tons of coal. In 2022 coal use declined by about 50% to about 512,000 million tons. Coal is important because of it’s enormous energy density. Another important fact, is that weeks and months of primary energy can be safely stored on site. Coal provides Dispatchable power and it is proven to be affordable. America has the largest coal reserves of any country. The U.S. is the Saudi Arabia of coal.
How much coal is 512,000 million tons? This is enough coal to fill about 5,000,000 coal cars such as the one shown below.
How long would a single train of 512,000,000 tons of coal be? About 50,000 miles, long enough to circle the earth two times at the equator.
Conclusions
The so-called energy transition from conventional to wind and solar is simply not possible with today’s technology. As Mr. Raymond stated in 2007, changing from our conventional energy systems to something else is an enormous effort that will take. a long time.
Net-Zero Carbon by 2050 is impossible. A previous blog post is here.
The largest energy density and provider of the greatest quantity of carbon-free energy is nuclear power. However, replacing the existing electric generation with nuclear will take decades to accomplish and massive roll back of Federal Regulations. It took about 40 years to develop, manufacture, construct and perfect the 93 operating commercial nuclear units in 54 plants. These currently provide about 20% of America’s electricity. Most of these are now over 30 years old and the last two units built by Southern Company (2,200MW capacity) took over ten years to build. A previous blog post discusses “Without New Thinking on Nuclear Power, Net Zero Carbon is Impossible”, here.
Electrifying Everything is not possible, even electrifying transportation is not practical for every vehicle and if they were, much more electricity would be required.
The so-called energy transition from conventional forms of energy to wind and solar is impossible and attempting to do so by forced laws (such as the IRA), increased Regulations and the continuing war on carbon will destroy our country.
It is my hope and prayer that after the next election some sanity to energy policy will return.
Much has been written on the importance of energy to power a nation’s economy and to continue to provide a high quality Human Development Index. The purpose of this post is to focus on the importance of Fuel Diversity for electricity generation. There is a proven concept for energy storage for electricity generation. It is coal fueled power plants with a 30-60 day supply of coal in a pile, on site. This is proven to be reliable, low cost and safe.
Energy powers everything we do!
Think about this. You are probably reading this on a computer screen. Have a warm cup of coffee nearby and are sitting in an air conditioned office or home. Your car is sitting outside and at your urging is ready to provide transportation. You get the point. Remember the last hurricane or severe winter storm that killed power for a day or so? Loss of energy sources or electricity is debilitating. Think about the 1970’s Oil Embargoes. If you are too young to remember 1973-1979 check these references, here and here.
Primary Energy Sources-Back to Basics
Lets discuss energy and electricity and the sources and quantity of everyday energy that we depend on.
America has used right at 100 Quadrillion Btus of PRIMARY energy per annum since about the year 2000.
The energy we use is compiled by various government agencies in BTUs equivalent (British Thermal Units). A BTU is enough heat to raise one pound of water one degree Fahrenheit, just as a reminder of High School Physics. Each BTU converted to work is equivalent (at 100% efficiency) to 778 Foot Pounds. Therefore, the energy production and consumption is converted to BTUs so that all forms of energy can be reported on a like basis. I wrote an article on the basics of energy for Middle School students here if you are interested, also on “Demystifying Energy and Electricity” here.
This article is about fuel diversity. Just as I explained above regarding the reporting of energy in BTUs to have a common measurement of energy quantities, in some cases one fuel can be substituted for another, especially in electric power generation. Thermal Power Generation Plants that generate Bulk Power can be provided with natural gas, coal, oil, Biomass or nuclear energy to produce steam to drive a steam turbine generator. The fuel selected is done for reasons of economic or fuel availability. Hawaii is truly an Energy Island and thus cannot interconnect with the lower 48 states. Fuels for Thermal Power Generation needs to be imported. In fact, I wrote on Hawaii’s electricity generation in 2020, here.
The proportions of each form of energy used and depended on to power our lives has changed as technologies for extraction and production have improved. For example for electric power generation coal fuel was consumed for about 50% of power generation in year 2000. Then due to the Shale Revolution of Hydraulic Fracturing and Directional Drilling, natural gas became less expensive than coal on a $/million BTU basis. See my review of Harold Hamm’s book, Game Changer which covers the Shale Gas Revolution, here. Thus, gas was substituted for coal generation by many utilities that could get it. Alaska and Hawaii of course do not have pipelines to connect, but of many utilities in the lower 48 states, gas was an economical and clean fuel of choice.
Coal fuel in the U.S. today provides about 23 % of the primary energy to produce Bulk Electric Power over the year. The substitution of coal fuel as primary energy is natural gas which has become more economical as a result of the Shale gas revolution which took off about 2012. Electricity is SECONDARY Energy and must be produced from Primary energy. Electricity is important and in 2022 electricity consumed about a third (37.7% to be exact) of the total PRIMARY energy used in the U.S. The best factual illustration that I am aware, of the sources and consumption of primary energy is the LLNL Energy Flow Diagram, shown below. This is one of my favorite graphics and it is prepared each year by the Department of Energy. The chart above shows the total primary energy used since 1950 and thus supports my conclusion that America needs right at 100 Quads per year to sustain our quality of life, economy and industrial production.
The total Primary Energy used by the U.S. from coal fuel in 2022 was about 10% of the total. (9.91% from data above). That doesn’t seem like much does it? Remember, this is primary energy I am talking about. So, although coal only provided about 10% of our total primary energy it was in fact, Dispatchable, affordable and it provided electricity generation when solar and wind were not available. The chart below is of MISO generation by fuel this past summer. This example shows 40% of total power generation in MISO from coal at this moment in time.
The topic of this article is “The Importance of Fuel Diversity”. The example above of summer Bulk Power Generation depending on coal fueled power generation units is just one of many reasons America should keep our Fuel Diversity. Another example of the importance of coal plants and the consequences of shutting them down is discussed in my blog post discussing the February 2021 Texas Blackout that killed over 200 people. Here.
My previous post on De-Mystifying Energy attempted to explain this, here. The difference between Primary and Secondary Energy is important. If everything is Electrified as many suggest we should do, has anyone really thought through where the primary energy to do so is to be sourced? In my opinion, it has not. Wind and solar cannot replace the primary energy currently required. The four charts shown up to here should make that clear.
Government policy and many people in the general public believe that renewables can replace fossil fuels and nuclear. The harsh reality is that after decades of government subsidies & tax credits wind and solar provide less than 6% of our total PRIMARY energy. Here below is the LLNL Energy Flow Diagram from 2021 with the 4.96% wind and solar contribution circled.
Public demonization of all conventional fuels including nuclear, coal, gas, gasoline, Diesel are unAmerican and foolish. Wind and solar only provide single digits of the total Primary energy needed to power our lives and it will be impossible to ramp wind & solar renewables up to 100% of our energy needs. The charts above are from the government statistics as published on the Lawrence Livermore National Laboratory Sankey Diagram website, an excellent resource.
Back to Fuel Diversity
Each American citizen, on average is accustomed to using about 315 million Btus of energy per year. I have written separate articles on American energy use here and here. My first point is that we all need on average of about 863,000 to 1 million Btus each day in Total Primary Energy. This number is provided by dividing 330 million citizens into 100 Quadrillion Btus and then dividing that by 365 days/year = 863,000 BTUs per day/citizen of PRIMARY Energy. This is for all uses which (see LLNL chart above) including: Electricity generation, Transportation, Industrial Production, Commercial and Residential uses. The second important point is that providing this energy each day may be from various forms of energy. Depending on which is more efficient or more economical. Let’s take an example of electric generation on July 21, 2023 in the Midwest at about 2:00 PM in the afternoon (example above). It was more economical to use coal fuel for 40% of the electricity generation at that hour. It may have been, I do not know for sure, that only coal generation could deliver the electricity Demand at that moment. The fact is, coal delivered 40% of the electricity at that moment.
Let’s take another example from last winter. This example below is from Christmas week, 2022.
Fuel Diversity with more coal plants ready to operate and properly maintained could have avoided the Blackouts of Christmas week, 2022. Duke Energy has shut down many coal plants as part of their Net-Zero Carbon plan. So have many other Utilities, both Public and Investor Owned. I presented my views on this at the ENERUM (Columbus Ohio Energy Forum) in August 2022. My presentation is Here. Also, my recent article on the self sabotaging of our energy and electricity generation Grid is here.
Even well respected utilities that were once known for their outstanding leadership and engineering excellence are planning to shut more of their coal plants down in the near future. This works against Fuel Diversity! Here below is a screen print excerpt of the Duke Energy IRP for 2023:
These planned shut downs are in spite of the winter 2022 rolling Blackouts described above. Why? Because the N.C. politicians and top Duke management have agreed to follow a disastrous Net-Zero Carbon path. So has the S.C. Legislature and Santee-Cooper. I wrote about Santee-Cooper in an earlier article, here.
Energy Storage
My first instructor on electricity generation was in class in 1959. The instructor, Harry Park stated, “Electricity needs to be generated the instant that it is needed”. That stuck with me my entire career. Today intermittent renewables are the rage and of course, as Mr. Park stated in 1959, electricity needs to be generated or provided from storage the instant it is needed. That is what built America’s Grid and America’s strong economy. Reliable, affordable electricity available the instant it is needed or in today’s word, Demanded. The published articles I see regarding the justification of higher and higher percentages of wind and solar generation are dependent on electricity storage. The best and largest Bulk Power Storage systems today are “Pumped Storage Hydro”. Such as Duke Energy’s Bad Creek or TVA’s Raccoon Mountain. These work well where the local topography allows it. Bad Creek has about 1,200 ft of elevation change between the upper and lower reservoirs(21). Bad Creek is currently, according to N.C. Business Journal, being uprated to about 2,800 MW. TVA’s Raccoon Mountain provides 1,650 MW of storage. Two other alternatives for storage are batteries and hydrogen. The largest battery electric storage system (BESS) that I am aware is in California. This is at Moss Landing Plant in California. It is being uprated to 3,000 MWH. The “H” after MW means Hour. That means the electricity stored is good at the rated capacity for one hour. Enough time to start gas turbines or buy power from a neighboring utility on the grid. Hydrogen can be a source of storage too. However, it must be remembered that it takes about four times the input of electricity to produce one unit of Bulk Power from hydrogen. An excellent reference on this was published in Gas Turbine World Magazine in August 2022, Here. (22)
The most reliable, proven, safe and affordable form of Energy Storage: A large pile of coal onsite at a clean, efficient coal power plant. When I started in the power generation business in the 1960’s one of my experiences was in conducting a boiler efficiency test at a large power plant in Illinois. As I recall the explanation for the huge coal pile was, “Because of the possibility of Union walkouts at either the coal mines or the railroad, a 90 day supply of coal was required to be stored on site”. Proven, safe and affordable. The photo below is real long term energy storage. A coal pile can store enough energy for a 2,000 MW power plant to run full power for months, not hours as is currently planned for batteries.
These five categories of energy use are shown on the LLNL charts above. Americans with our current population of about 330 million, will need at least 100 Quads per year for the foreseeable future. If we are to sustain our quality of life and freedom to travel, we will continue to need about 100 Quads per year. This article is focussed on electricity generation and the 37% of America’s PRIMARY Energy used to generate Bulk Power. The second part of this article will cover the other 63% of our PRIMARY ENERGY.
Conclusion
It will be impossible to replace fossil fuels with wind and solar any time soon. Attempting to do so will create hardships, economic decline and a general weakness of our country including weakness of our National Security.
The best and most proven energy storage system that I have known through my entire career in power generation is a large coal pile. It was common for coal power plants to have 30 or 60 day supplies of coal storage on the plant site.
On a positive note, I wrote about the preceding 80 years the “Era of Affordable, Reliable Energy and Electricity Generation, Part 1” Here. America really did great things in making energy and electricity reliable and affordable for over 80 years. Coal plants became more efficient and clean, nuclear power came of age and America became energy independent and the largest producer of natural gas in the world. I chose 80 years because that covers my lifetime and I know the history of accomplishments during these times, because I worked in the power generation business for over 50 of those years. Experiences in design, maintenance, operations, tuning, upgrading, capacity improvements, Betterments, Heat-Rate Improvements, fuel flexibility, fouling and slagging reductions and emissions reductions of fossil power systems. I admit, I am not a policy wonk, I am a nuts and bolts power engineer. But, I have been gifted with many years of experiences and have traveled much of the world to witness the relationship of energy and economic prosperity.
The loss of legacy coal plants is threatening Bulk Power Supply Reliability by the loss of over 100,000 MW’s of reliable coal power generation capacity without replacing it in kind is wrong. I wrote on the “End of the Era of Reliable, Affordable Energy and Electricity” a couple weeks ago. It is here. The references included are from NERC, FERC and other reliable people and sources of information. I encourage the reader to check these references to decide for yourself.
Nuclear power generation is the only known technology to produce carbon dioxide free electric power. However, building a new nuclear power generation supply chain will take decades. David Archibald wrote an excellent article on “The Energy Future We Need to Have a Future Worth Having”, here. I also support nuclear for the long term, but the next 30 years are important to work through and hopefully, sustain our high quality of life until future technologies and the needed supply-chains are sufficiently developed for safe and reliable implementation. My previous blog post covered an overview of the needed new thinking (and policies) on nuclear power for carbon dioxide emissions reduction to succeed. here. (27)
Each citizen needs about 315 million Btus of energy to sustain our freedom of travel and way of life
Introduction
Yesterday I was a guest speaker at the “Money Talks Club” gathering in Sun City. I presented my views of Net Zero Carbon and was impressed with the interest and understanding of energy and electricity generation by the group. A fine gathering of American Patriots and I was honored to be their guest. At the same time of my talk, Santee-Cooper published their final 2023 IRP which shows the planned shut down of the 1,150 MW Winyah coal plant and plans to replace the generation largely with solar panels. Based on my experience yesterday, I thought it would be timely to attempt to explain in as short a post as possible, the importance of energy to our lives and where this primary energy can be sourced. Hint, it is not from wind and solar.
I have lived the American Dream and wish the same for my grandchildren to do so. I also pray that the U.S. politicians will wakeup and understand the energy sources to keep America strong, productive and free.
As shown above, the majority of the energy we depend on each day is sourced from traditional forms of primary energy. To me, sustainable living means that we Americans can continue to live our good lives as we have been. Doing so requires that reasonable cost, abundant forms of energy are an absolute pre-requisite. Replacing the traditional forms of energy with wind and solar is simply not possible. Attempting to do so by, shutting down, “Killing the supply chain”, demolishing and abolishing reliable forms of primary energy as shown above, is self sabotaging our quality of life. It is engineering fiction to believe that wind, solar and batteries can replace the Primary Energy sources that have served us so well for my entire life-time and I have been Blessed with many good years.
The most descriptive and simplified chart to show the forms of energy we depend on and how that energy is used, is the LLNL energy flow chart. The 2021 version is shown below.
Americans have used right at 100 Quadrillion Btus of Primary energy for over 20 years. The chart from 2021 shows a total of 97.3 Quads because 2021 was after the Covid lockdowns and reduced freedom of travel and reduced industrial production as well as other factors. The fact remains that Americans still used within +/- 3% of the decades long energy consumption, about the same amount of total Primary Energy, 100 Quads.
Electricity is Secondary Energy
The understanding of Primary and Secondary Energy should be clarified. When the government or MSM promotes “Electrify Everything” they are suggesting that electricity always will be available from some unlimited and magical source to power their EV’s, trucks, cooking, HVAC, industrial production, etc. The inference is that pollution free electricity can be provided by wind and solar to replace fossil fuels by simply spending billions of taxpayer dollars in incentives and installing millions of acres of wind farms and solar panels. My point here is to remind readers that Electricity is Secondary Energy. It must be generated using Primary energy! Batteries and hydrogen are also forms of Secondary Energy.
Let’s go back to the LLNL energy flow chart above. Note that wind and solar provided less than 5% of the total Primary energy in 2021. This is after over 30 years of incentives to force renewable wind and solar onto the Grid. Most of the other 95% Primary Energy was provided by conventional forms of energy.
How Can We Electrify Everything Without Increasing Generation From Traditional Forms of Energy?
The short answer is, we can’t. I have written other posts to explain. Donn Dears and Vaclav Smil together have written over 50 books to try to explain the importance of energy and the most likely sources for the future. I highly recommend their books to help understand the Importance of Energy and the differences between Primary and Secondary Energy..
Here is a list of the most common sources of carbon-free energy. Please refer to the LLNL Energy Flow chart above and then you decide how to replace or reduce fossil fuels by substituting those that are socially acceptable today:
Summary
I wanted to keep this post short and concise. For more details on the importance of energy in our lives, I suggest referring to other posts on my Blog and Donn Dears and Vaclav Smil’s books listed below.
The most important point of this post is to attempt to explain how keeping your quality of life depends on abundant, reasonable cost and reliable Primary Energy. Electrifying transportation and nearly everything else you use and doing so with wind and solar alone will be impossible in the near term.
Since the Oil Embargoes of the 1970 and 1980’s the public has been indoctrinated by extremists. Part of the indoctrination was well meaning to force government action on cleaning the air and water of our great country. This goal, has been largely accomplished. However, the extremists have grown in influence to seek more than clean air and clean water, they have morphed into promoters of Socialism and one world government. My previous posts on my Blog have described my thoughts on the demonization of carbon and the war on coal, and how they came to be. This post was primarily written to show my attempt through a two part course on energy and electricity generation to provide an energy information course for the general public. The course was provided as part of the USCB-OLLI program and entitled, “Understanding Net Zero Carbon”. It is posted on LinkedIn. Part 1 and Part 2. Then, as I thought about the misguided indoctrination of the public, I thought it would be helpful to provide some insight as to how such absurd energy policies came to be. Therefore, at the end of this post is a summary of some of how this public indoctrination into “Electrifying Everything with Wind and Solar” evolved. It began as misguided public indoctrination. Now it is the “Green New Deal” passed into law and codified into government policy as part of the so-called “Inflation Reduction Act”. The green policy is based on the premis that, “Everything can be Electrified”. Really? The illustration below shows the traditional sources of 95% of our primary energy. A large part of the public’s misunderstanding about energy is NOT knowing the difference between Primary and Secondary Energy. Many Energy providers do not help with clearing up the public’s confusion. I will provide an example later.
Net Zero Carbon by 2050 and Sustaining Our High Quality of Living is Impossible
The short course I presented at OLLI is my attempt to explain the facts of: “Primary & “Secondary” Energy, Energy Density, Dispatchable Generation, Electricity Storage, Electricity Demand Cycles and production cost increases with increased percentages of wind and solar. The main point: If reduced carbon intensity is really sought after, then the only known and proven source of reliable 24/7 carbon-free Bulk electricity generation is to build many new nuclear plants. The current path of reaching Net-Zero carbon by 2050 using only wind and solar is impossible.
Donn Dears published the book(19), “Clean Energy Crisis” just a couple months ago. In about 100 pages Mr. Dears explains the futility and impossibility of achieving Net Zero carbon by 2050. One excerpt from chapter 8, “Impossibility of Net-Zero Carbon”, expresses the number of new nuclear power plants needed to achieve Net Zero Carbon by 2050: “The total number of new nuclear plants needed to achieve net-zero carbon by 2050 is 881. This requires building thirty-one new nuclear plants, comparable in size to existing units, every year between 2022 and 2050. This in spite of the fact that the United States hasn’t been able to build one new nuclear plant over the last ten years.” Check the latest news update for Georgia Power’s Vogtle Units 3 & 4, the only major 1,100 MW+ new nuclear units under construction in the U.S. at this writing. The loss of nuclear component manufacturing facilities and obtaining a trained workforce of engineers, welders, machine tool operators, electricians and instrument technicians is a topic for another day. Suffice it to say here, The U.S. does not have the facilities and talent to build the components needed to build 31 new nuclear plants each year. Plant Vogtle is struggling to build two.
The current policies of decarbonization favor (and incentivised with tax dollars) wind and solar generation. Getting back to Mr. Dears “Clean Energy Crisis”, he has calculated that by 2050 almost a million wind turbines would need to be installed. To be exact, he calculated 995,141 wind turbines of 2.5 MW each. To achieve this number 35,540 must be installed each year. If they were 5 MW each, it would take 17,770 installations per year. The maximum actually installed in one year to date is 5,680. At this rate it will take 175 years to install the needed wind turbines. An important point I made in my course is that wind and solar are forms of “Intermittent Power Generation” and must be backed up by other forms of Dispatchable generation, such as gas turbines, coal plants or Diesel generators.
Replacement of conventional generation with solar is just as impossible. According to Mr. Dears, “It would take 3,918,996 MW of capacity. The most ever installed in one year is 21,500 MW. Therefore, it would take 182 years to complete”. Like wind power, solar power is intermittent power good for about 6 hours each sunny day. Therefore, energy storage by not yet invented batteries or other storage devices will need to be installed for backup.
Mr. Dears (and mine) Conclusions of the Net-Zero Carbon Transition:
It is impossible for the United States to achieve net-zero carbon by 2050.
CO2 is not a threat to mankind.
Energy Reality
The EIA chart of nuclear generated electricity for the state of S.C. is shown below. Over 54% of S.C. electricity was generated from four nuclear stations within the state in 2022. These plants are very reliable, robust and safe. Most are also very old. Two, Oconee and Robinson began operations in the 1970’s. I know that for a fact, because I was working for Babcock & Wilcox in Barberton, Ohio in 1966 when the Reactors and Steam Generators for Oconee were being manufactured. These outstandingly successful units may receive new operating licenses for another 30 years, but the fact remains, some day new generation will be required to replace the aging units.
I personally had believed that NuScale Nuclear’s “Small Modular Reactors” (SMR’s) would be a large part of future replacements for aging coal and nuclear plants. However, the recent cost escalations do not look very encouraging, based on Donn Dears cost analysis of NuScale’s SMR. (275)
Over 200 slides are included in my course to show the reality of all forms of Primary and Secondary Energy. Energy used by America is used for more than generating electricity. In fact, about 37% of total primary energy is used for generating electricity. The other 63% is for Industrial production, Transportation, residential and commercial, cooking, heating, lighting, entertainment and cooling.
The course includes information on all forms of energy and how it is used to power our lives. I invite you to take a look at it, if you are interested, part 1 and part 2.(2,3)
Confusing the Public
I live in Hilton Head, South Carolina and soon the Heritage Golf Tournament will take place. This is a huge event that draws tens of thousands of Golf fans to this island. The normal peak electric power demand on Hilton Head is between 150 and 250 MW’s and it is provided by Palmetto Electric Co-Op which distributes electricity generated by Santee-Cooper, a state run electric utility. Santee-Cooper has about 5,300 MW of installed capacity and most of this is coal, natural gas and nuclear generation. Santee-Cooper is interconnected with the Duke and Dominion nuclear plants as well as other generation from the Grid. Overall, over 50% of S.C. electricity has been from nuclear power. (Santee-Cooper owns 322 MW of Summer nuclear plant operated by Dominion Energy) Santee-Cooper advertizes that they have about 400 MW (Nameplate) of solar power capacity either owned or under contract. So at first glance the claim of 100% green power to power the island may seem plausible, especially if Palmetto Electric defined nuclear power (they don’t) as being “Green”. Nuclear is the largest form of carbon-free electricity generation in the world. The point not explained regarding solar and wind is that “Nameplate Capacity” is not the same as delivered Dispatchable power. The actual electricity produced in the state through the year 2022 to SC is shown above. 54% nuclear & about 5% solar.
The bill insert from Palmetto Electric Coop, the HHI electricity supplier is copied below. This infers that the island of Hilton Head is powered by wind, solar and landfill gas. If you check the website scgreenpower.com it shows that most of the green power is from the 29 MW landfill gas units that Santee-Cooper operates. Not solar and ironically, they mention nothing about the importance of carbon free nuclear generation?
The misinformation and resulting misconceptions are nationwide as shown below. The headline refers to installed “CAPACITY” not actual generation. My Part 2, OLLI course(2,3) , slides # 16-20 show the recent actual generation for the U.S. electric Grid by fuels. (about 80% conventional generation)(157)
The actual delivered wind and solar generated electricity cost when metered and billed to the consumer is typically a higher cost/kWh than electricity generated from conventional generation. This is partly because the intermittent solar or wind power needs to be backed up with natural gas, Diesel or other Dispatchable generating capacity. So, the installed cost of solar is only the cost to install solar collectors or wind turbines. In the real world, the cost to the consumer includes the cost of the installation and fuel for backup generation. Another factor regarding intermittent wind and solar is that maintenance costs tend to be very high. Especially for offshore wind turbines. The chart below is from European experiences. The case study of Hawaii Electric which has shut down their one highly successful, clean and reliable coal plant is shown on slide # 48 of part 2 of the OLLI course. Now, dependent on wind, solar and other renewables Hawaii has the highest cost electricity in the U.S.A.. (53, 223 & 224) Mostly because the backup power when the wind isn’t blowing or sun not shining must be made up by Diesel Fuel burned in Internal Combustion engines, gas turbines or oil fueled steam boilers. Diesel fuel in the middle of the Pacific ocean is the most expensive form of primary energy. Diesel fuel is also one of the highest cost forms of primary energy anywhere, second to hydrogen in $/BTU.
Weaponization of the EPA
The Biden Administration is hell-bent on killing coal power generation(29) in America. The latest EPA Rules may in fact kill over a third of the remaining U.S. Coal generation capacity. Many of the power generation facilities that have been depended on as recently as last December 2022, (even now) will likely be shut down in the next year or two. This despite the fact that electricity shortages are expected. We already have had Rolling Blackouts in 2022 due, in part to too many reliable coal and nuclear power plants being shut down without replacing them in kind. Check slide #81 of OLLI course, part 2. This shows the over 102,000 MW of coal generation shut down since 2011. This is from data in the NERC report.(4)
In addition to the concerns of solar and wind being intermittent generation, there is the concern of Grid voltage and frequency stability with increasing generation provided through inverters. (20) The “Spinning Reserve” of thousands of tons of generator rotors from conventional power plants add Grid Stability of voltage and frequency as new power demand is added. Solar and wind power provided through inverters does not provide this dynamic reserve stability.
“Roosters of the Apocalypse” How Junk Science of Global Warming Nearly Bankrupted the Western World(1)
The Heartland Institute published the short book, “Roosters of the Apocalypse” in 2012. Basically it is a story of how “in the spring of 1856, the Xhosa tribe in today’s South Africa destroyed it’s own economy. According to the book, the Xhosa killed an estimated half-million of their own cattle (which they ordinarily treated with great care and respect), ceased planting crops and destroyed their grain stores. By the end of 1857 between thirty and fifty thousand of them had had starved to death. A third of the population. The British herded survivors of the once powerful tribe into labor camps, and white settlers took much of their land.(1)
The Xhosa had acted on the prophecy of a 15 year old girl who promised that if they destroyed all they had and purified themselves of “witchcraft” (including evil inclinations and selfishness), the world before the white invaders came would be restored: The British oppressors would flee, and the Xhosa ancestors would return, bringing with them an even greater abundance of cattle and grain.”
I found a copy of this book which I had purchased in 2012 amongst some other old books. I paged through it and thought “gee whiz, this is very relevant to the absurd actions and Regulations our government is now forcing on us”. The EPA and most of the rest of the U.S. government (Nearly all government Bureaucracies) have been weaponzied.(5) An OpEd opinion writer to the “Wall Street Journal” has written at least one letter with the truthful title: “America is Self Sabotaging the Electric Grid”. Then considering the story of the young girl advising the Xhosa tribe we could say, this is much like the message of Greta Thunberg and non-energy savvy politicians. In current times we have an inexperienced and thoroughly green indoctrinated Greta Thunberg (and along with many energy ignorant politicians) addressing the World Economic Forum as if she (and they) is/are well credentialed Atmospheric Scientist(s) and Greta appears on the cover of Internationally circulated magazines and is Time Magazine’s person of the year in 2019. Greta’s message, “Stop using fossil fuels”.(270) The fossil fuels that power 80%+ of all that we depend on to achieve the high standard of living we have come to enjoy.
Are the free people of the western world as gullible as the people of the Xhosa tribe? It sure looks that way to me. The Net-Zero Carbon Path may be impossible and wrong-headed, but our government sure is hell-bent on following it no matter what the consequences.
How, Why or Who is Responsible for the Absurd Energy Policies and Demonization of Carbon?
The perpetrators of the war on carbon and all conventional fuels for that matter are numerous. In my opinion, it began with the United Nations Agenda 21 and that (later the formation of the UN-IPCC) I believe is the root cause of why and how the “Green” policies have been started in the U.S. and EU. Demonizing conventional forms of energy (carbon and nuclear) and strangling of the Free World’s Energy supplies. I started digging to try to discern how such ludicrous policies could become embraced by most of the leaders of the free western world, some who are otherwise reasonable people believed to be of above average intelligence.
The intent of the following is to show the progression of the U.N. Agenda 21 from the inception in 1992 and how it morphed into being a policy to promote “One World Government” and control over all of the citizens of the Free World and to do this through environmental regulations. Why did the UN choose the environmental route to promote socialism? Because, in my opinion, everyone wants clean water and clean air, so it was a means for the leaders of the U.N. and Socialists to appeal to the free world’s citizens, even if it meant using scare tactics(6). If it sounds like a conspiracy, well please read on. I have provided many references at the end for your further reading and research. I said the scare tactics are aimed at the citizens of the Free Western World. You would think that the Main Stream Media would notice and report that the war on carbon does not apply to China and Russia. These two countries have the most to gain as the OECD countries become weaker.
The largest influencers of U.S. energy policy has been environmental extremist organizations.(250, 251, 252, 253,254, 255)Not engineers or energy savvy organizations. Not even electric Utilities.
The Beginning of Agenda 21 1992-Rio De Janeiro -Conference on Environment and Development (UNCED)
This conference produced three documents: The United Nations Framework Convention on Climate Change (an international treaty), the United Nations Convention on Biological Diversity (an international treaty), and U.N. Agenda 21, (not a treaty, but a “soft law” or suggestion)
President George H.W. Bush along with 178 other countries signed the agreement, along with 178 other countries. But he refused to sign the U.N. Convention on Biological Diversity because it required transfer of technology without recognition of property rights.
The treaties and the Agenda 21 (soft law) were not ratified by the U.S. Congress. However, parts of it have been incorporated into other laws passed because all members of Congress do not read all of the words that are in Bills. (7)
Nancy Pelosi in 1992 introduced a bill to follow the 1992 Rio Earth Summit to conform to U.N. Agenda 21, its local sustainable community practices, and to follow international law.
The administration of the next President, Bill Clinton initiated the “War on Carbon”. (10) Many prominent members of the Democrat Party have hated coal for a long time, and I have yet to find a reason for their angst against the treasure of energy that America is Blessed with? Clinton’s administration started with appointing environmental activist zealot Carol Browner to the EPA. Between her and some clever and devious lawyers on staff at the EPA they ramped up the Rules on “New Source Review”. This is the point that extreme policies came to my attention. At that point in my life (early 1990’s) I was working as a boiler engineer/consultant and was directly involved in upgrading and improving older coal plants to improve efficiency, reliability, fuel flexibility, reduced NOx emissions and capacity. I learned the hard way that the word “Upgrade” was a trigger word to the EPA. It triggered NSR. Even if it improved efficiency and reduced emissions. The word upgrade in a technical report we wrote or a proposal triggered NSR “New Source Review”(8,9). The concept by the EPA was to eliminate coal plants gradually by forcing an environmental review of an older plant as if it was a new plant being constructed at that time. Because the older coal plants were built before the newer Regulations, NSR was a death sentence to any coal plant faced with NSR. Here are some links to NSR lawsuits. That was the beginning of the war on coal, based on my observations, then the U.S. had a pretty good run of enjoying some of the lowest cost electricity in the world for the next two decades.
Summary and Conclusions
It will not be possible to reach net-Zero Carbon by 2050. It may be possible to help the Chinese Economy and Influence in the world to surpass America’s by restricting, regulating and taxing America’s vast energy resources. Thus, weakening America as the WSJ OpEd title stated, “America is Self Sabotaging Our Electric Grid”. It is not only the electric grid. Remember there is a difference between “Primary and Secondary” energy. Electricity currently utilizes about 37% of America’s “Primary Energy. If everything is electrified (not possible) then the Grid will need much more than the 37 Quadrillion BTUs used currently to generate our electricity. Note the LLNL chart below of total PRIMARY Energy use in the U.S.
My hope is that the American people (and our elected officials) who are not involved in energy or electricity production, will wake up and study the fundamentals of energy and electricity generation. (that was the intent of my OLLI course) I have written to many elected officials. I have had little if any interest by these officials to do anything. Why? I think it is because the environmental extremist organizations have literally Billions of dollars of funding to use in election campaigns against any politician that stands up for Common sense Energy Policies. Check Capital Research Center’s “Influence Watch” website to see some of the enormous resources of funds that the Sierra Club, Environmental Defense Fund, NRDC and others have. Besides being enormously well funded, these are Tax sheltered. Also, the 2012 book, “The New Leviathan”(158) which outlines the funds of extremist non-profit organizations in Appendix X, page 245: $9,310,833,507. That was 2012 and at that time the average annual revenues were $6,454,568. Being 501(c)3 non-profits, they have even greater funding today,(15,16,162) thanks to American Billionaires and some Dark Money. Many of the non-profit leaders have participated in a Revolving Door of high government positions with the EPA and other agencies of the U.S. government. (254)
Also, I have written on my Blog on Influencers of Energy and Environmental Policy. America has not had an energy policy since the presidency of Jimmy Carter. His National Energy Act as older folks will recall, was following Oil Embargoes of the 1970’s and 1980’s.
A couple final thoughts on “Electrify Everything”…..
Itshould be obvious that Energy Independence is a prerequisite for National Security.
Everything cannot be electrified. For example, Plastics, Steel, Cement and Fertilizer. Yes, energy and food production are inextricably linked also.(182)
The bottom line is. America does not have an Energy Policy(159) for an orderly transition to Net-Zero Carbon. My message to my fellow citizens is this: Please wake up(59) and go study the true facts on energy and electricity. If you only check two references, the two I suggest are Vaclav Smil’s book, “How the World Really Works” and take a look at the Finnish GTK presentation, entitled, “Time to Wake up”. (59)
Yours very truly,
Dick Storm, March 18, 2023
When you have some free time, kindly read or at least peruse through the additional resources listed below. Learn about the details of our energy mess and then educate your friends and neighbors to the true facts. Especially your friends that are involved in education. Thank you.
References and Factual Information for Further Reading
Roosters of the Apocalypse by Rael Jean Isaac, published by the Heartland institute, 2012
“The Climate Change Hoax Argument” by C. Paul Smith, 2021
U.N. Agenda 21 by Dr. Ileana Johnson Paugh, ISBN: 978-0615716473
The Right Stuff Climate Team Reports and Videos. Outstanding applications of Science and Common Sense by retired NASA highly credentialed experts: https://www.therightclimatestuff.com
TED Talk Nuclear Power Is Our Best Hope to Ditch Fossil Fuels | Isabelle Boemeke on the need for more nuclear power. I do not agree with her bashing fossil fuels, but her promotion of nuclearis correct and well done with class and a little humor: https://www.youtube.com/watch?v=ESAaz9v4mSU
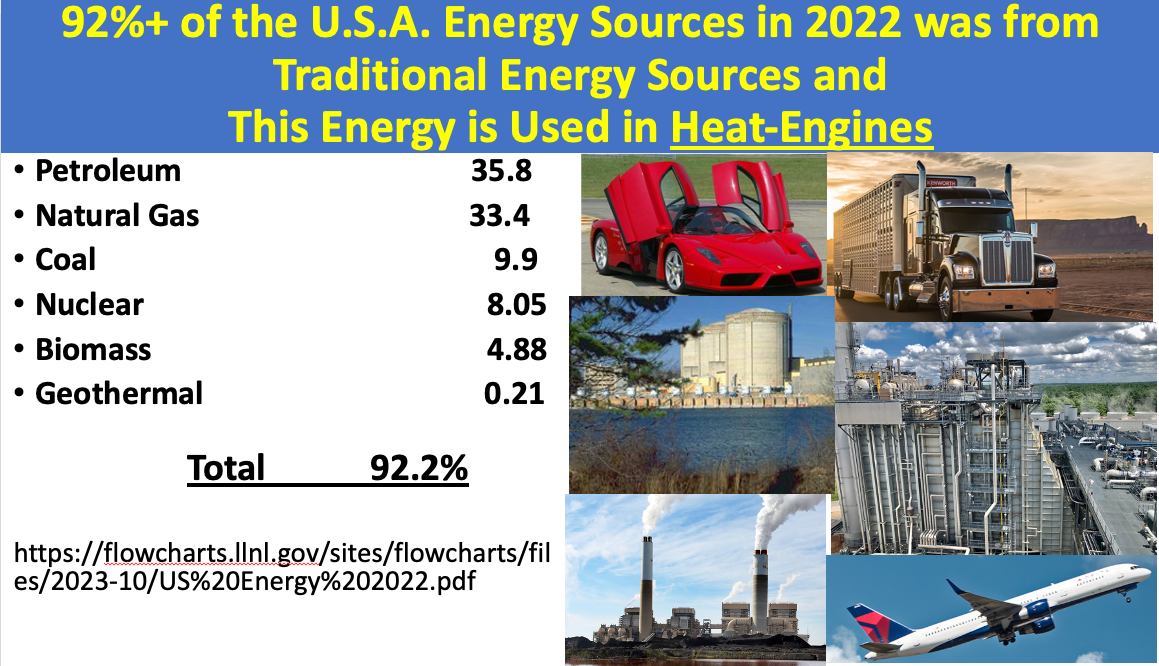

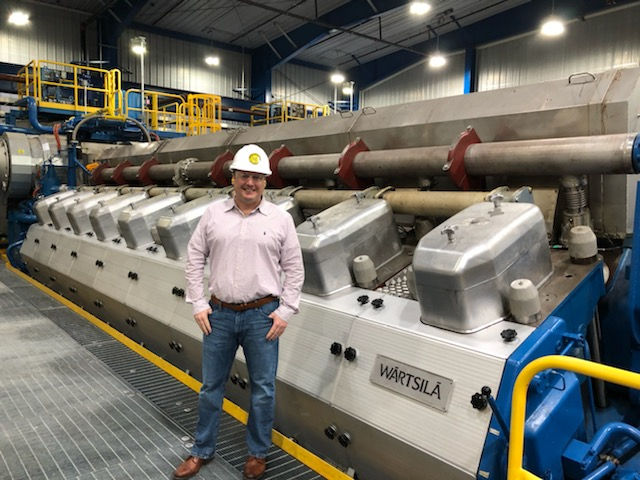

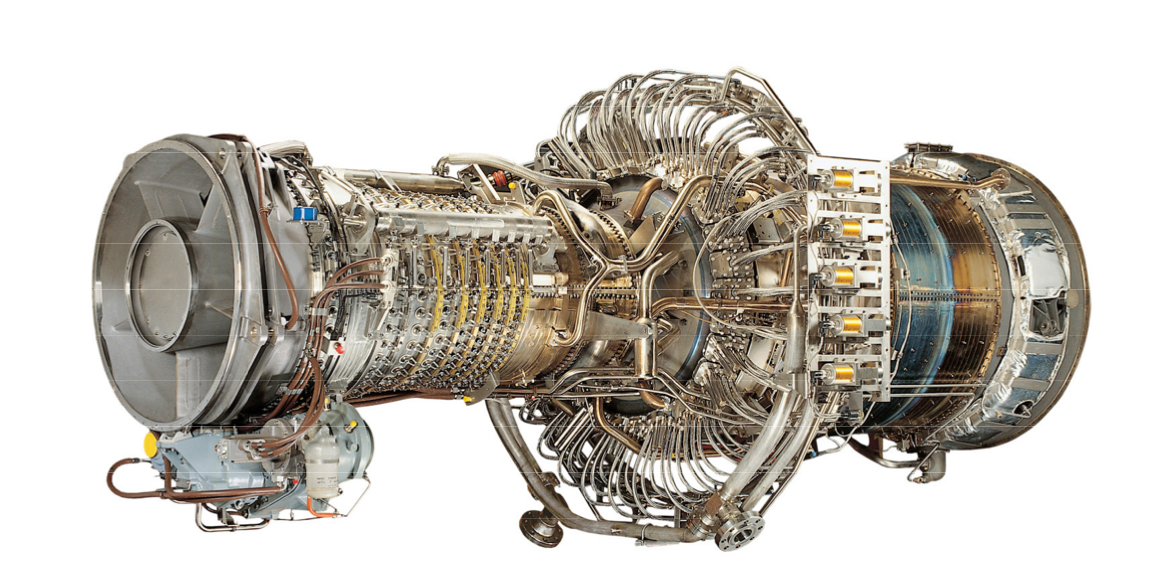


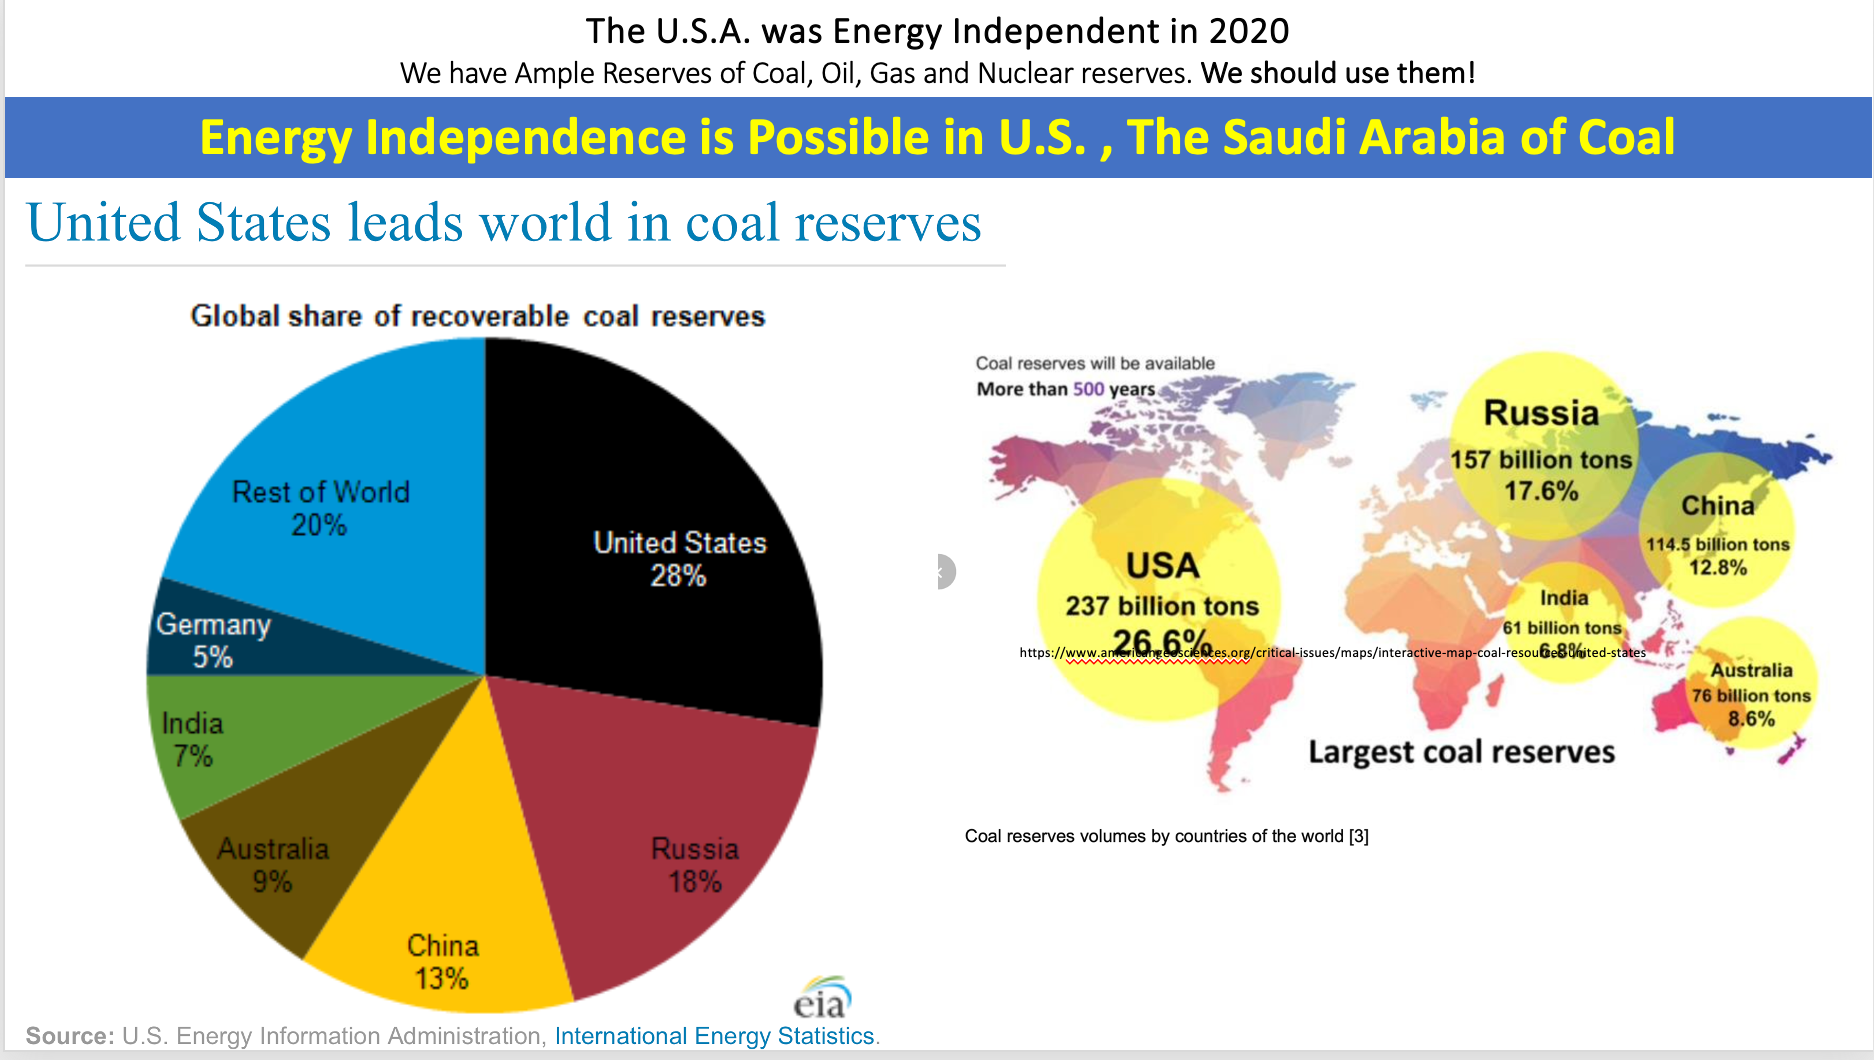
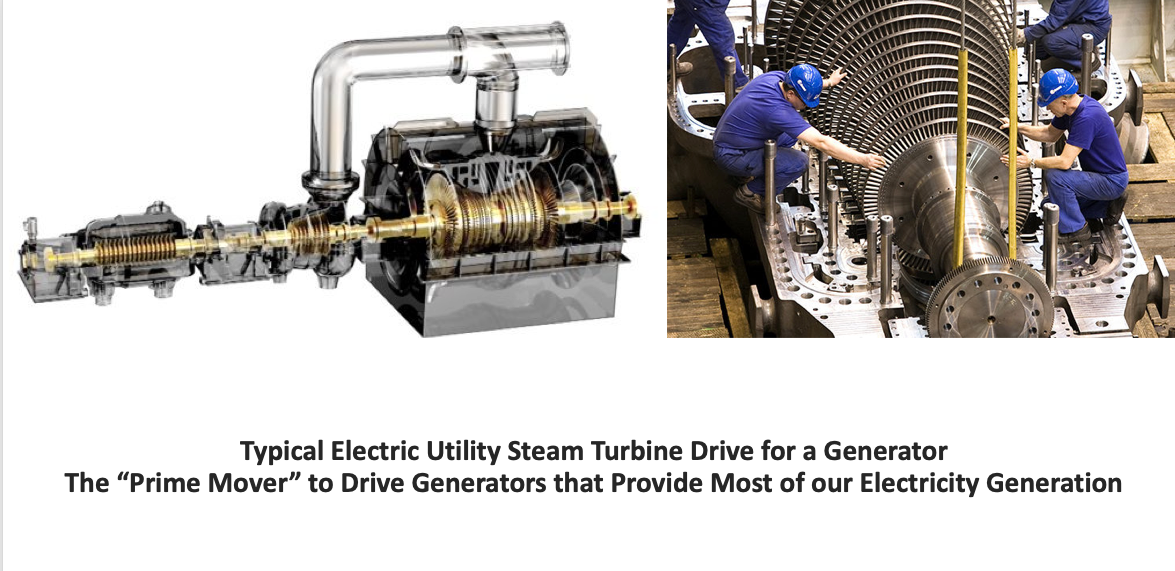


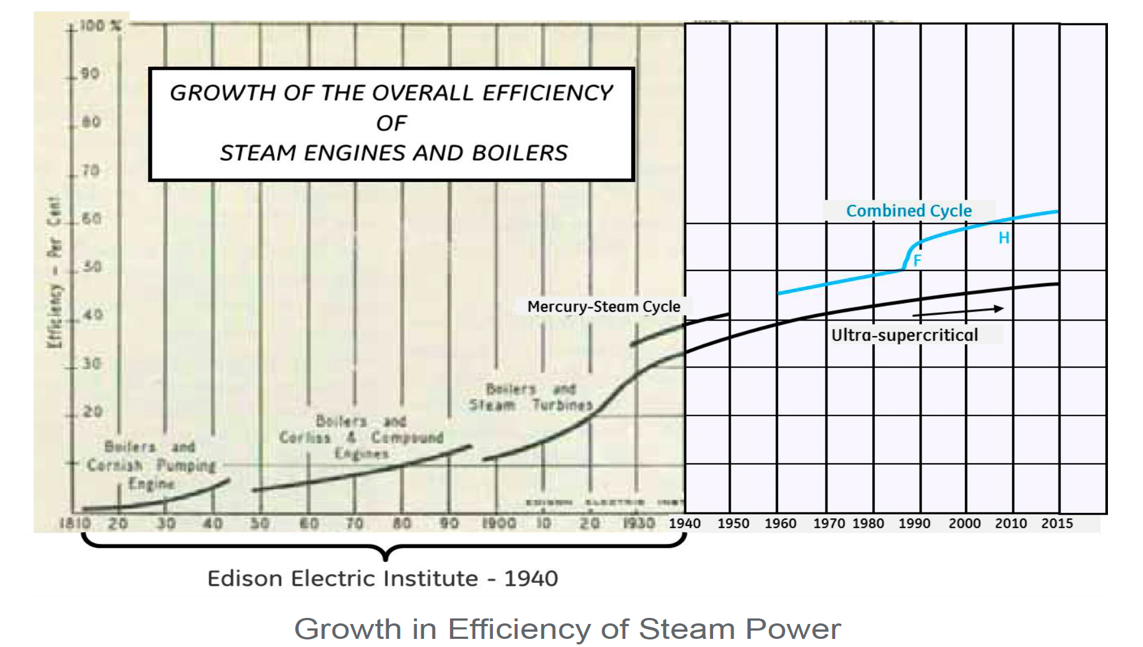
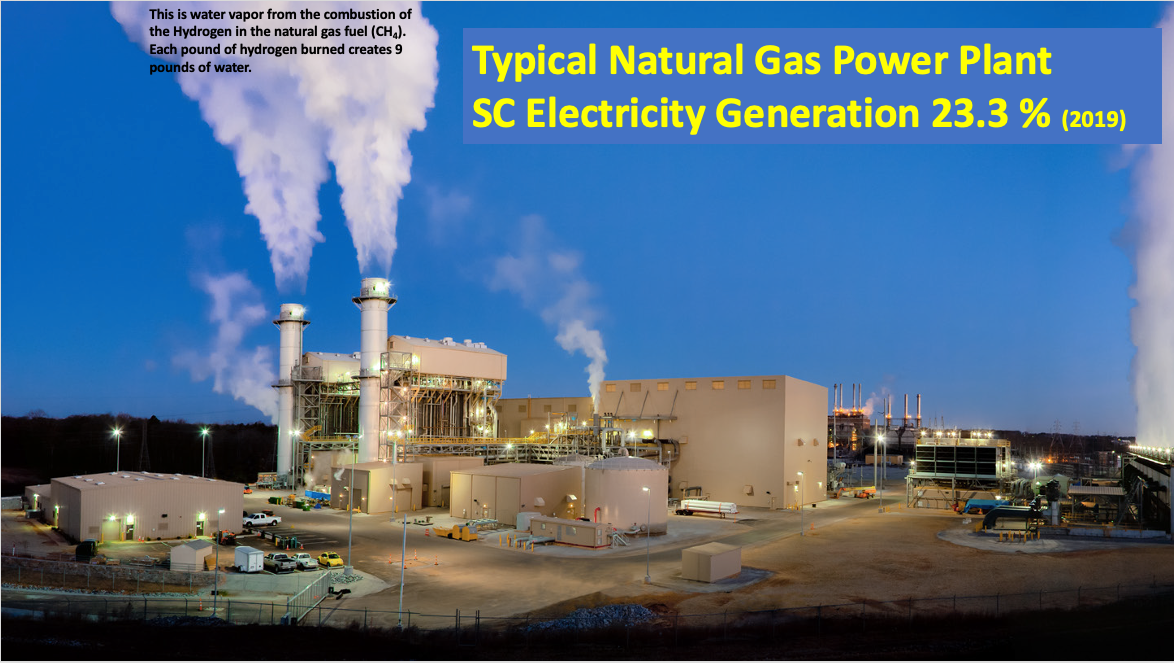
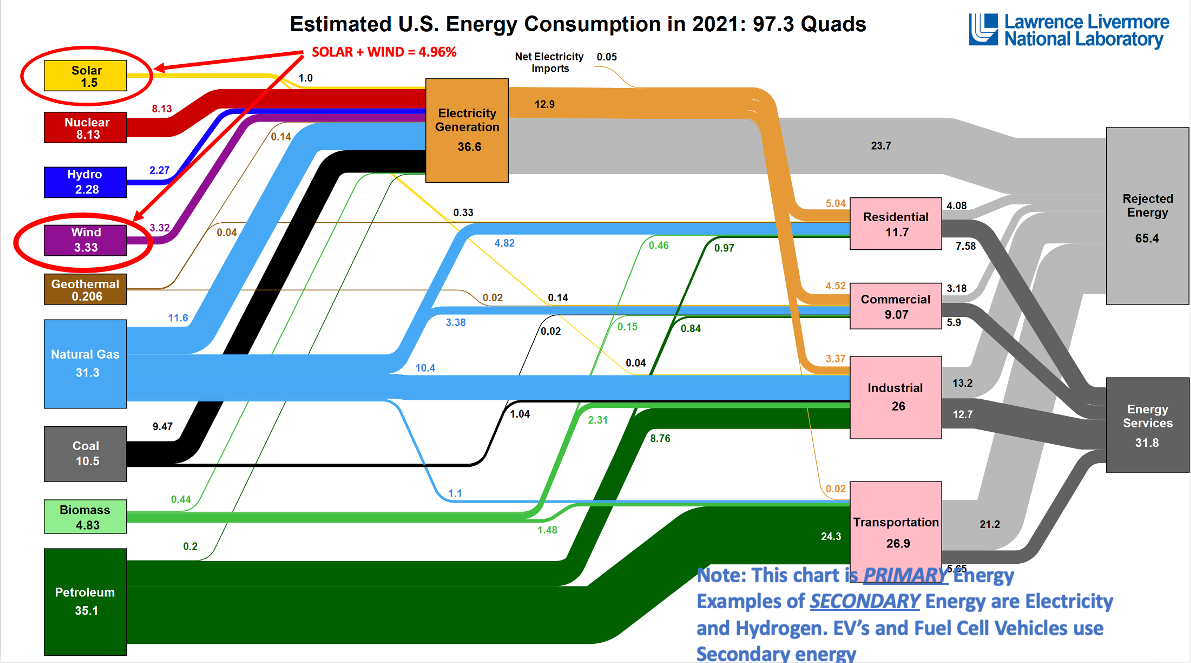
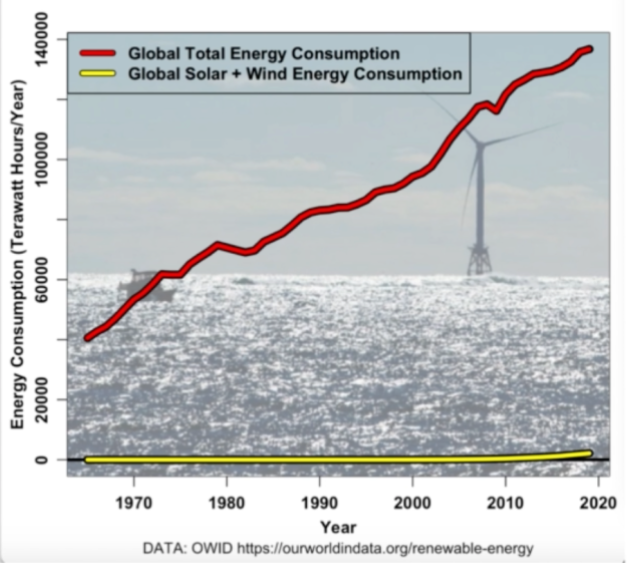


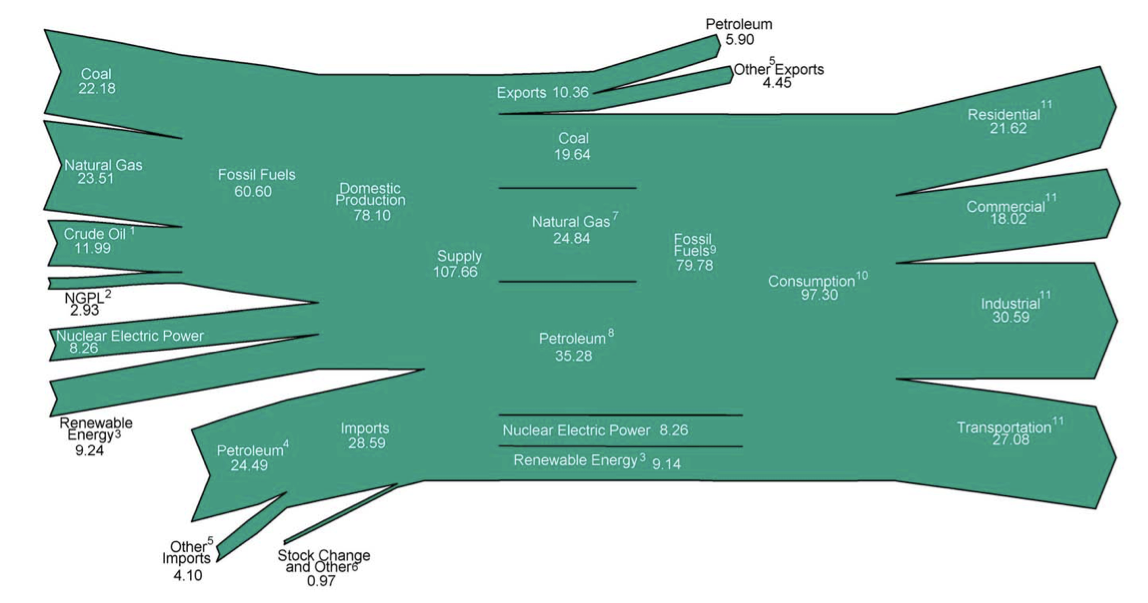


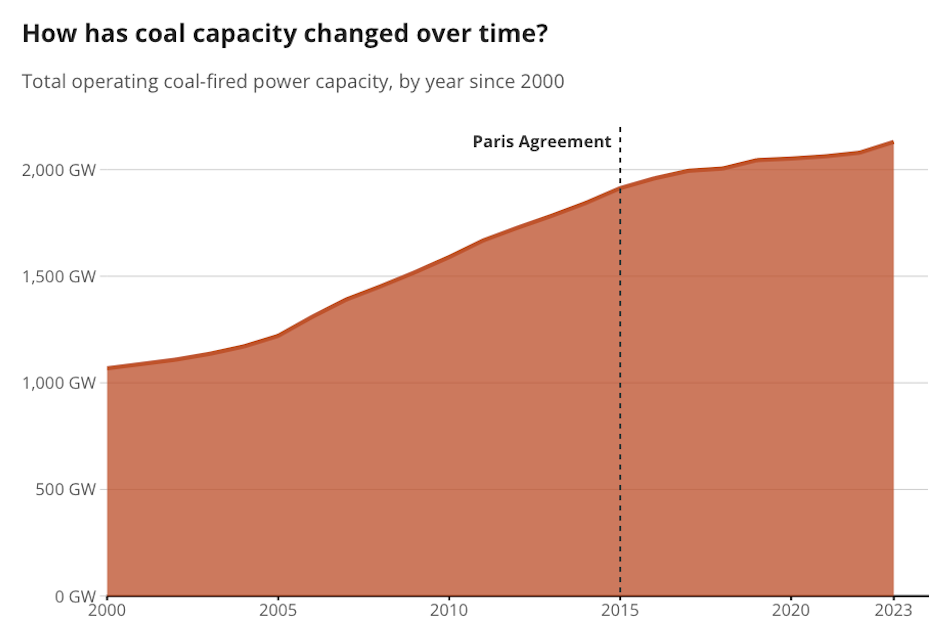


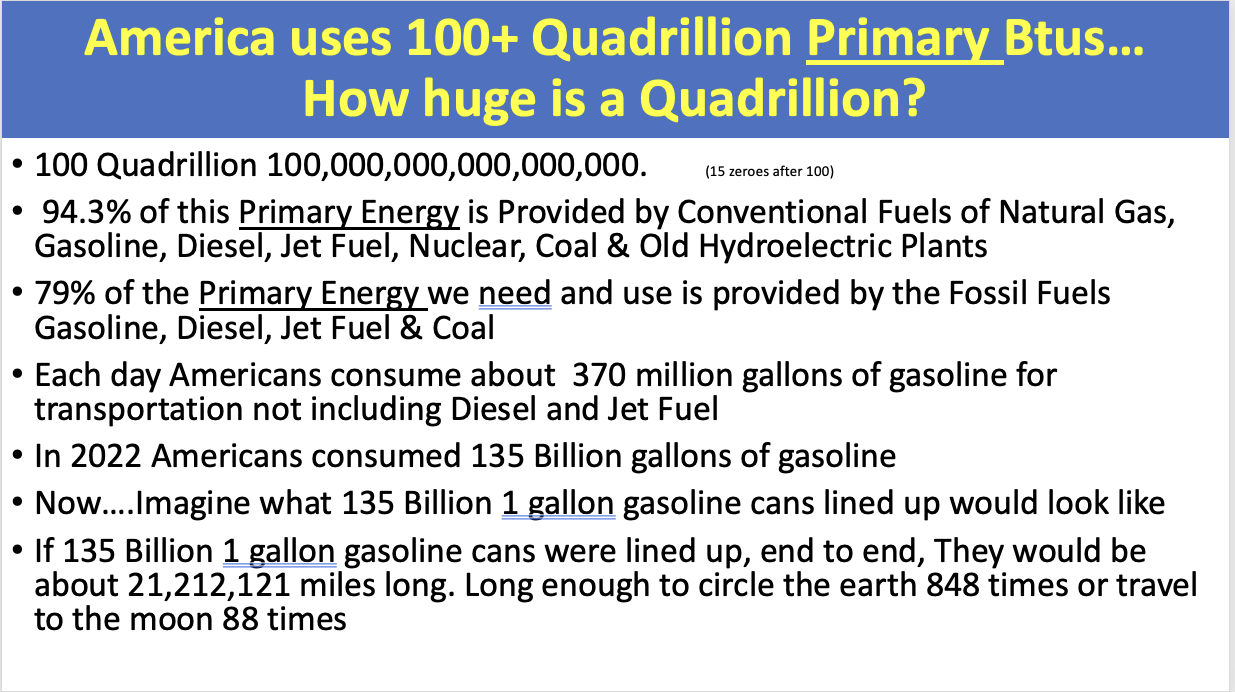


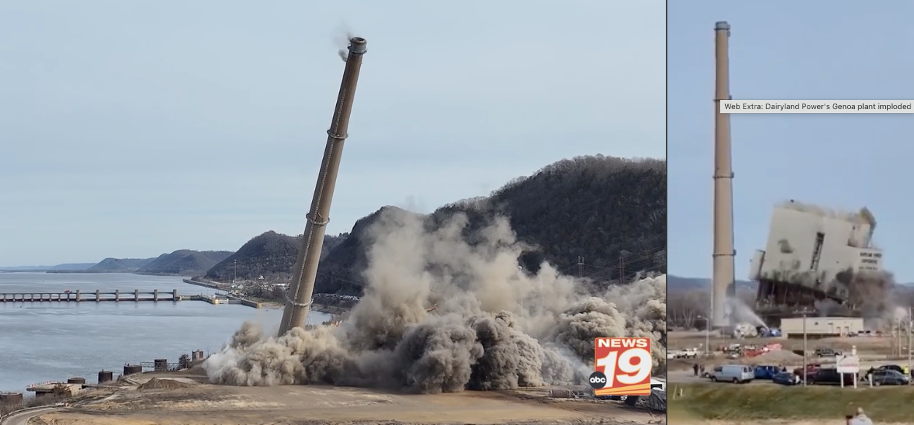


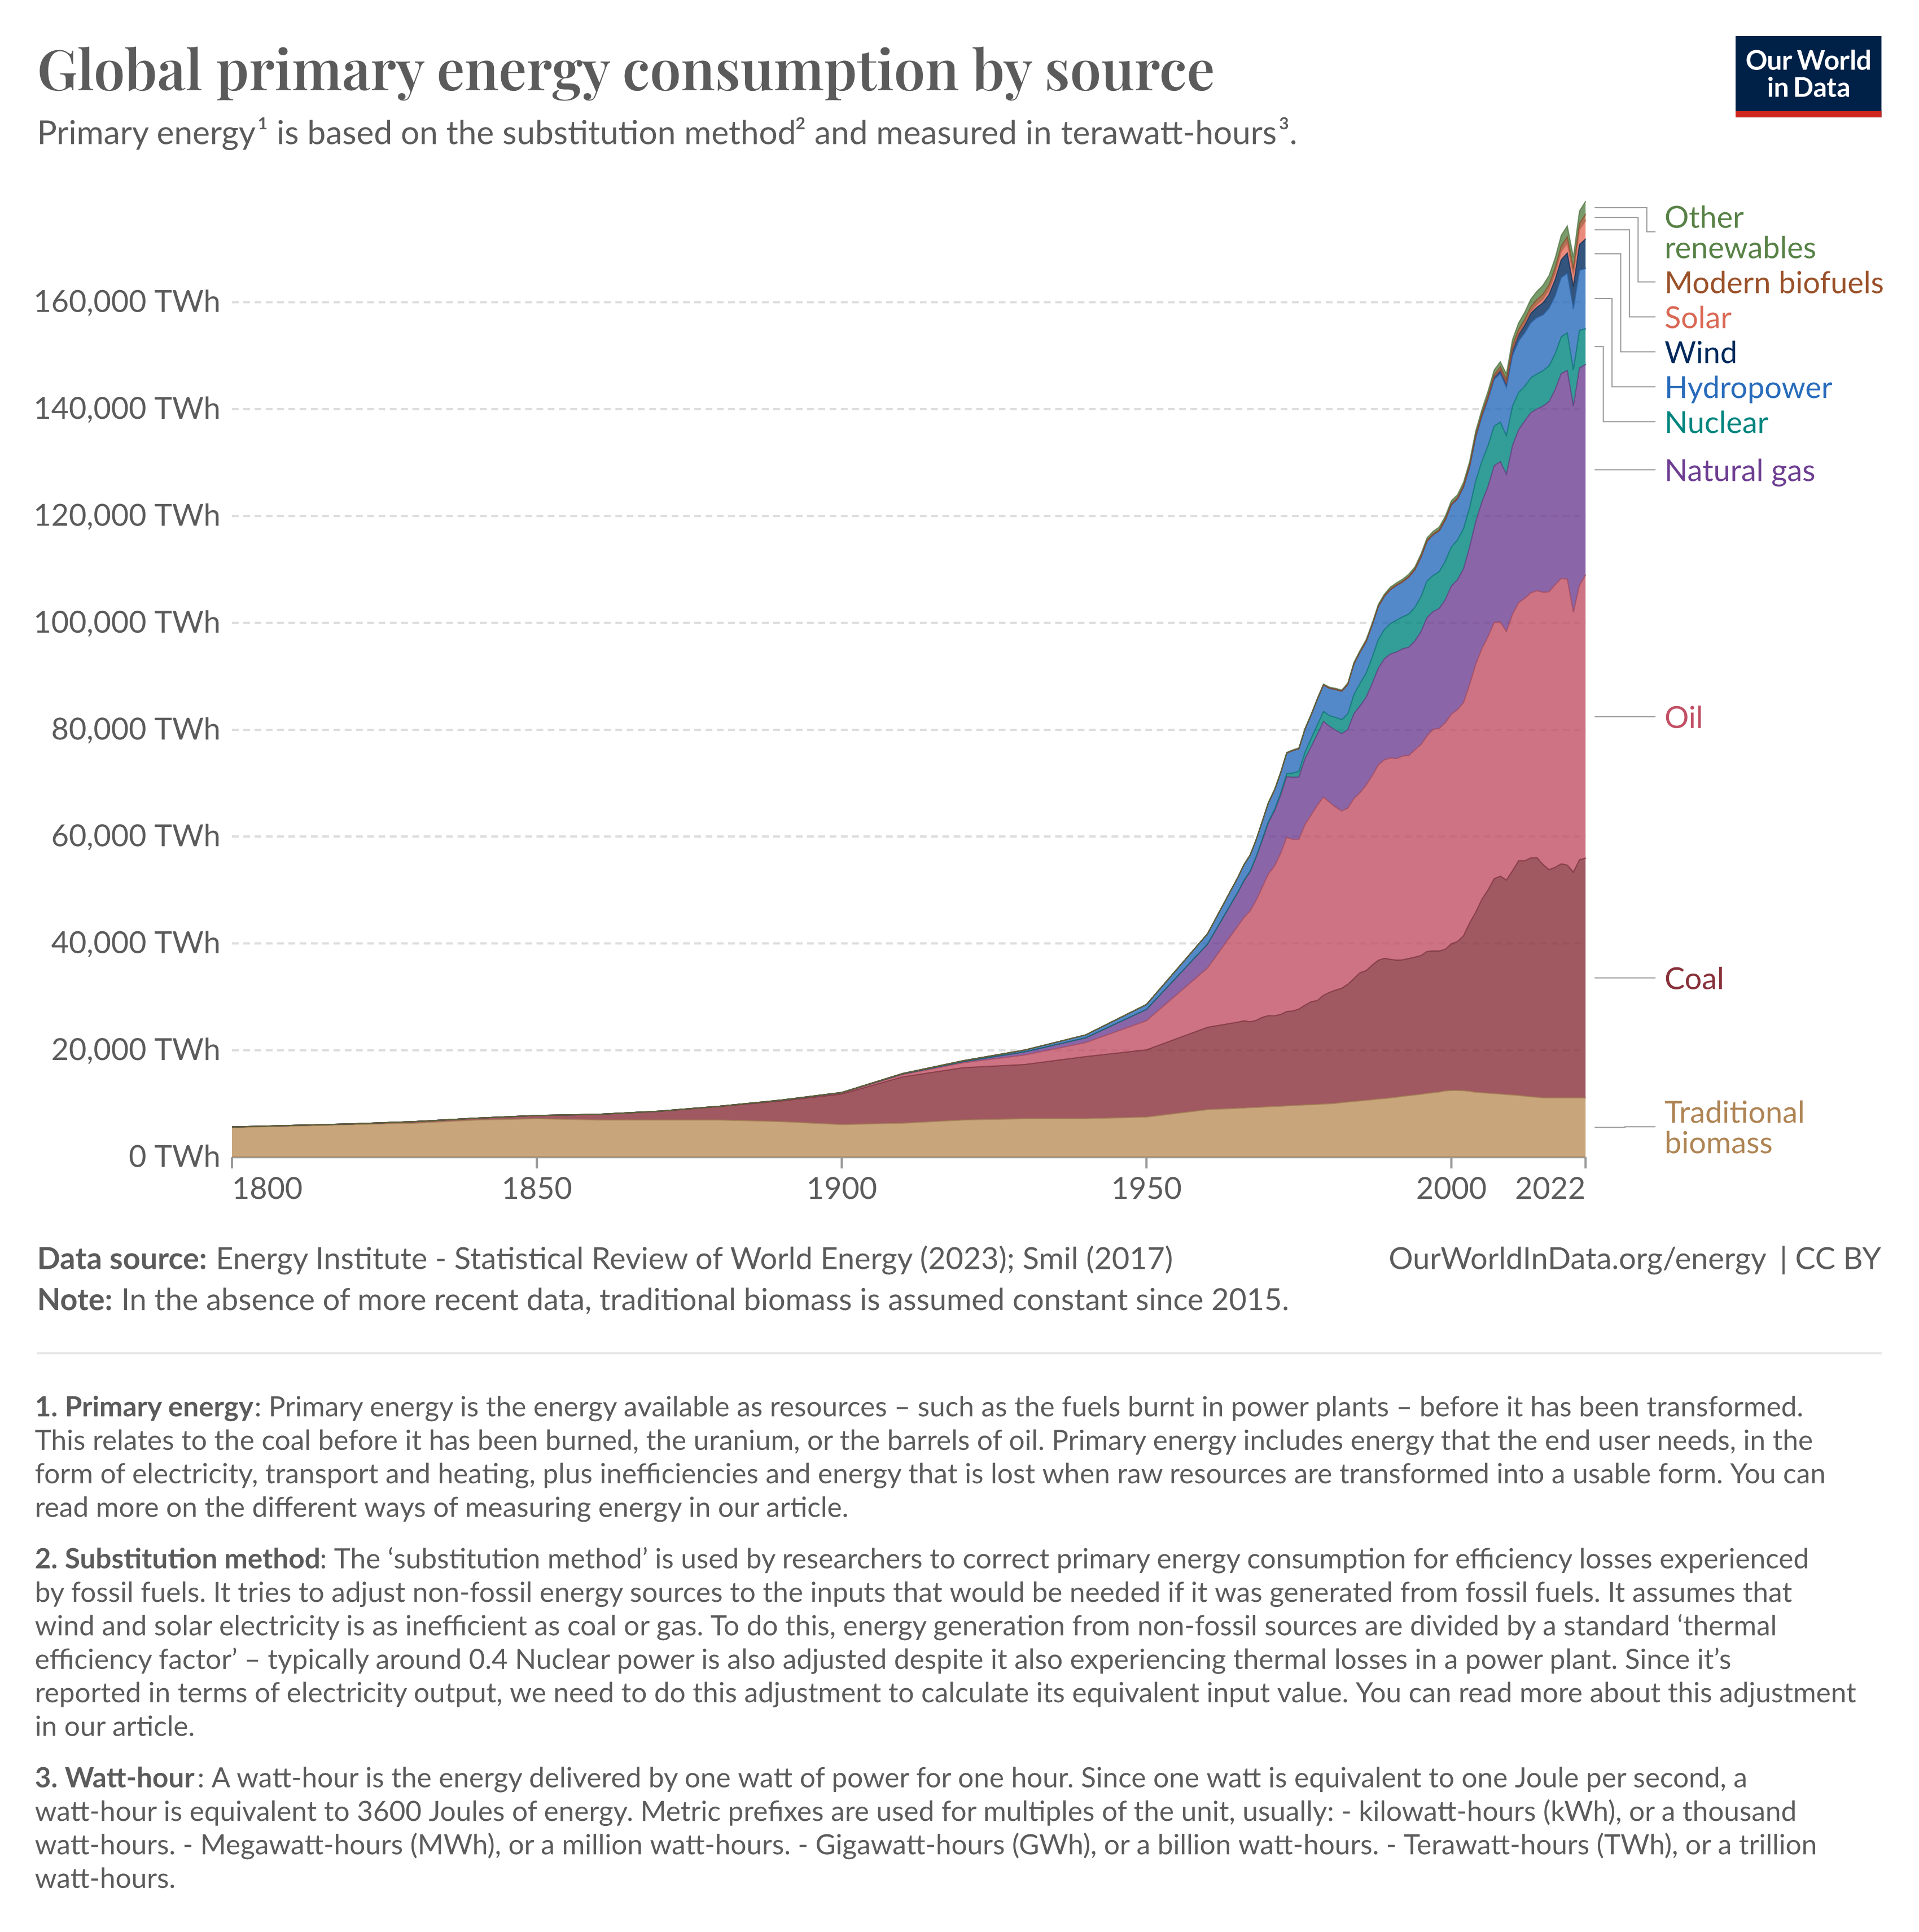


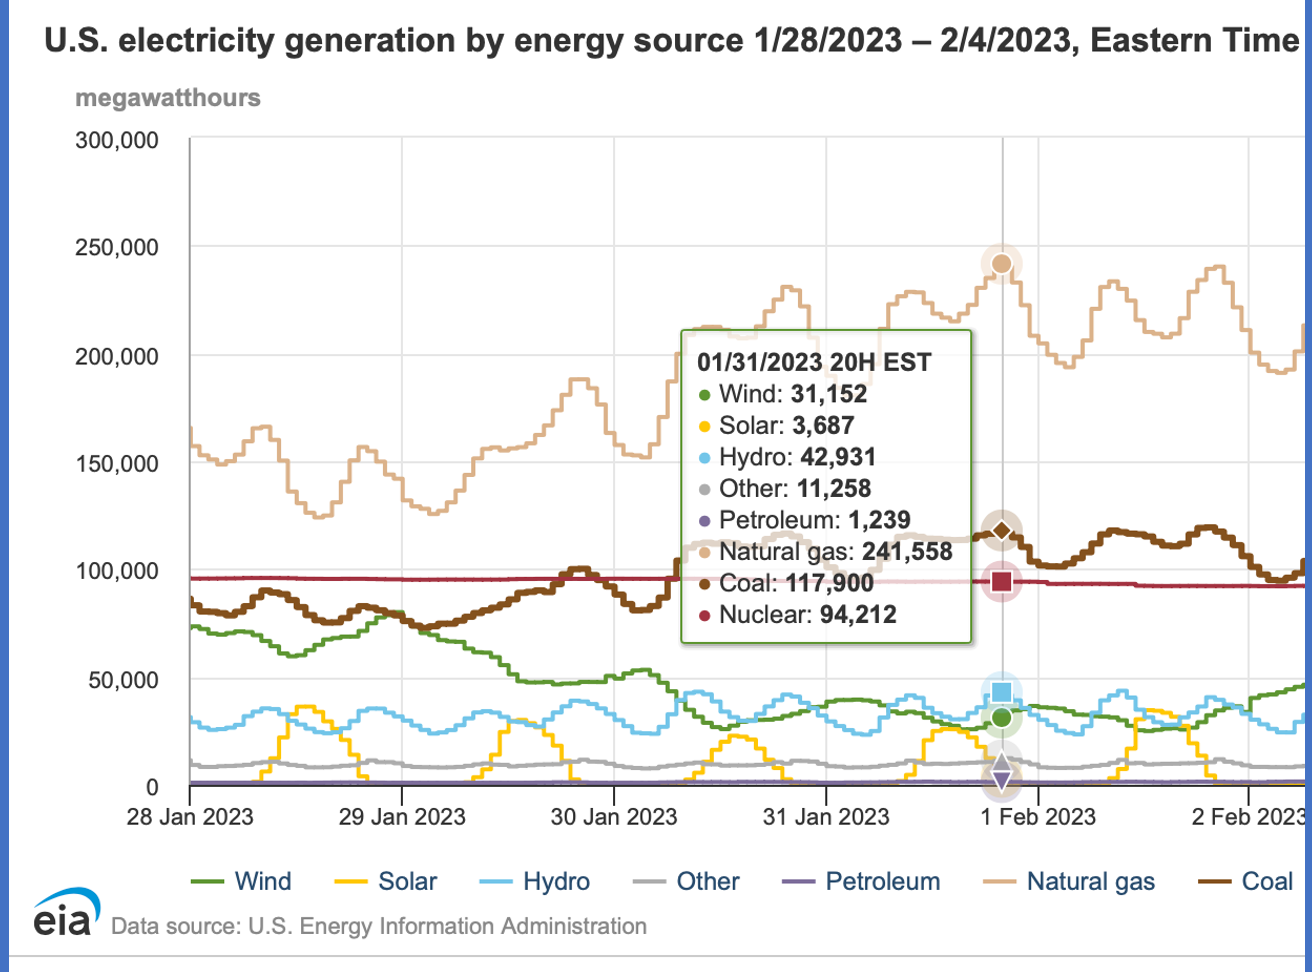


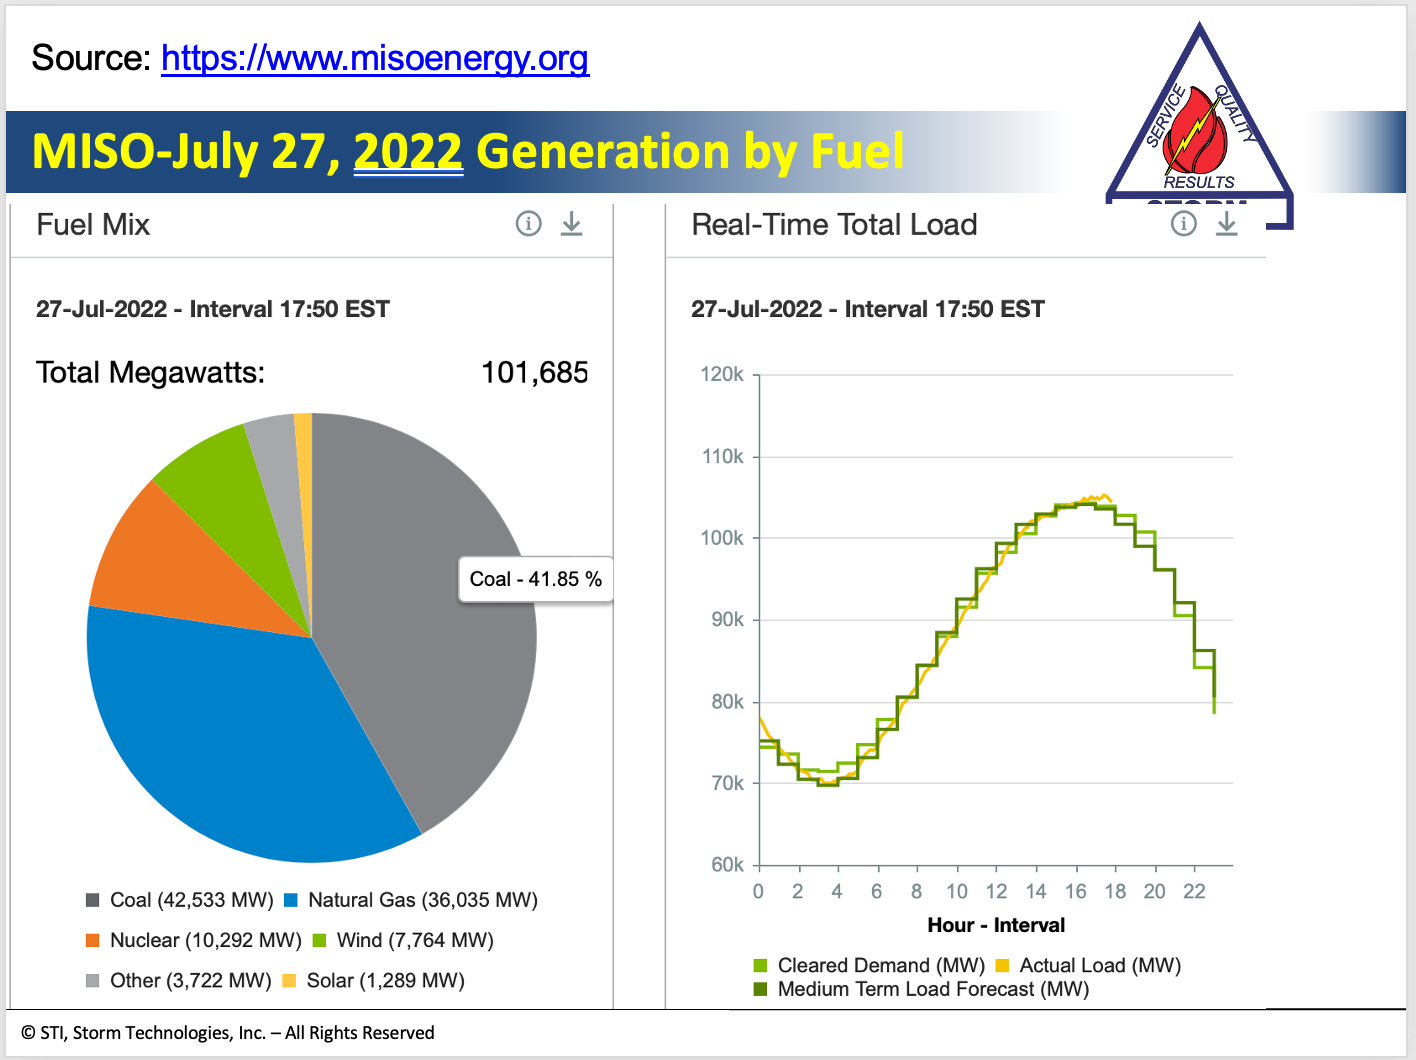


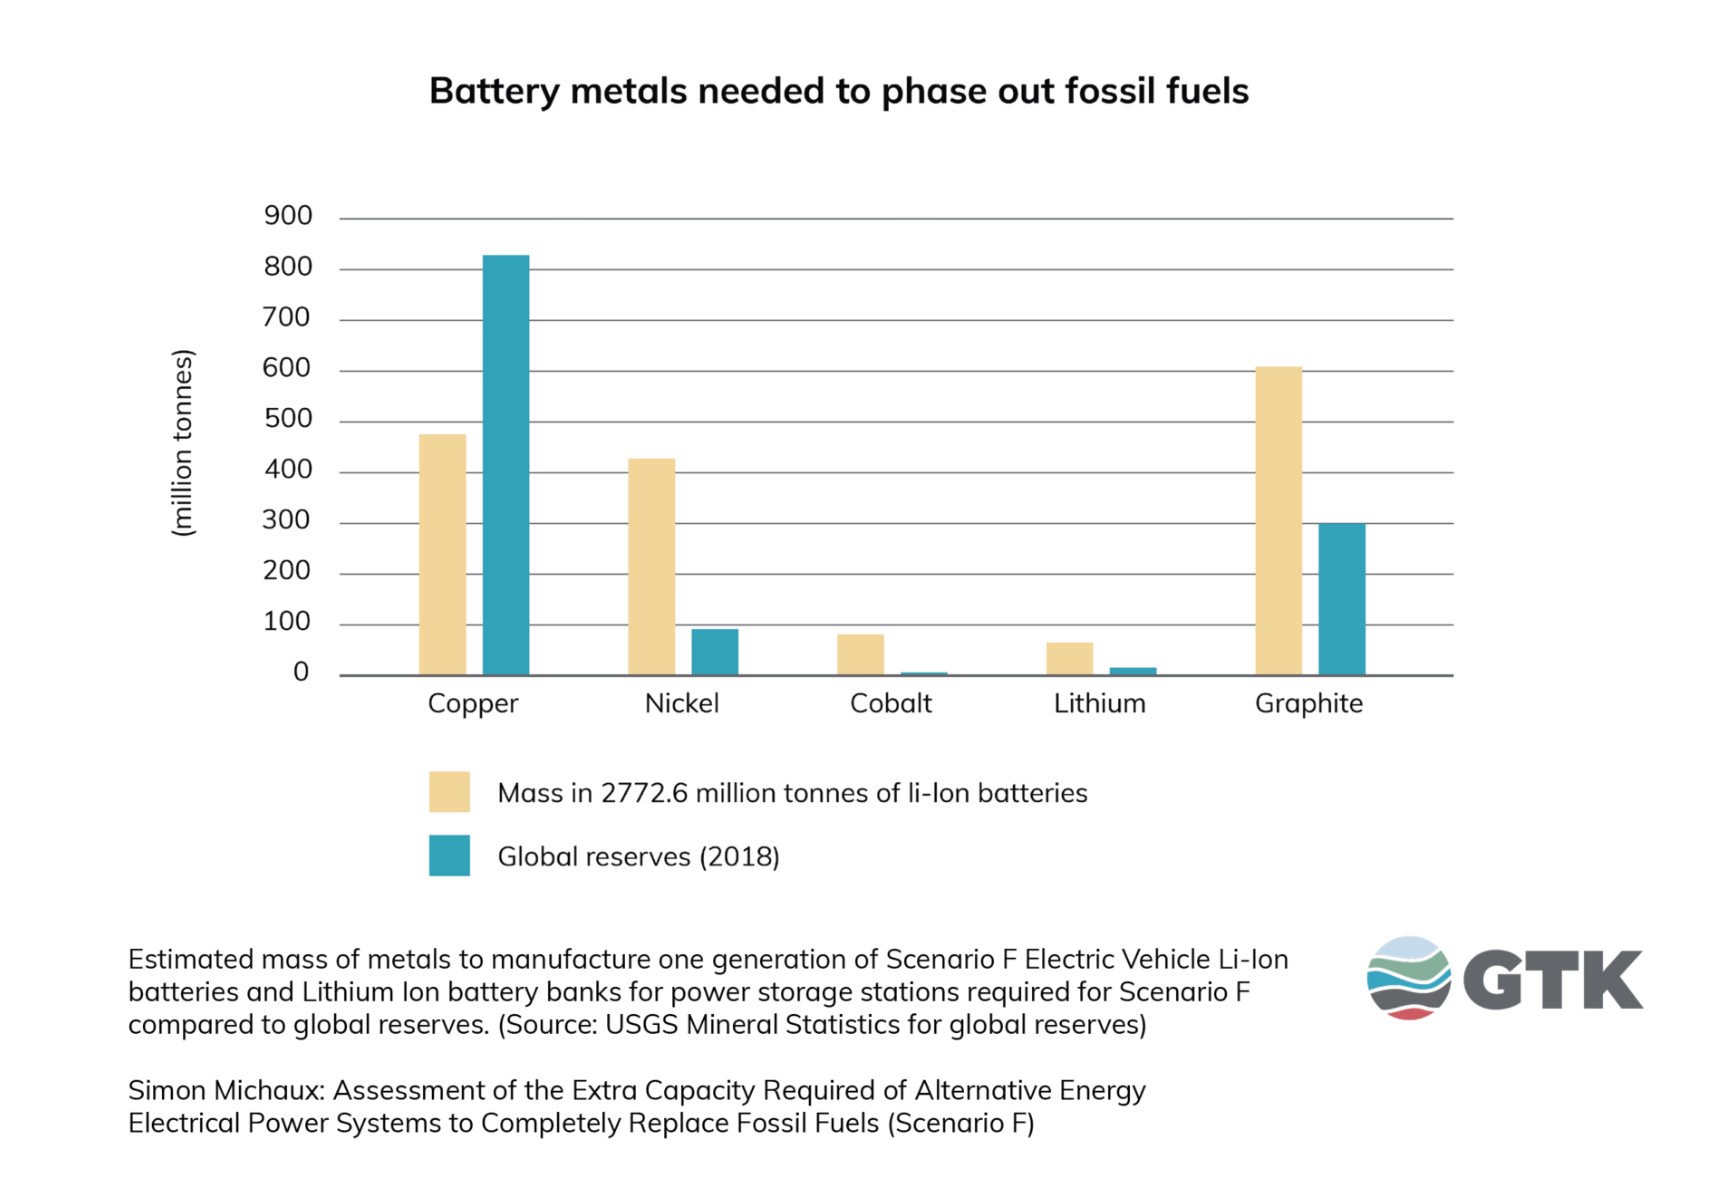

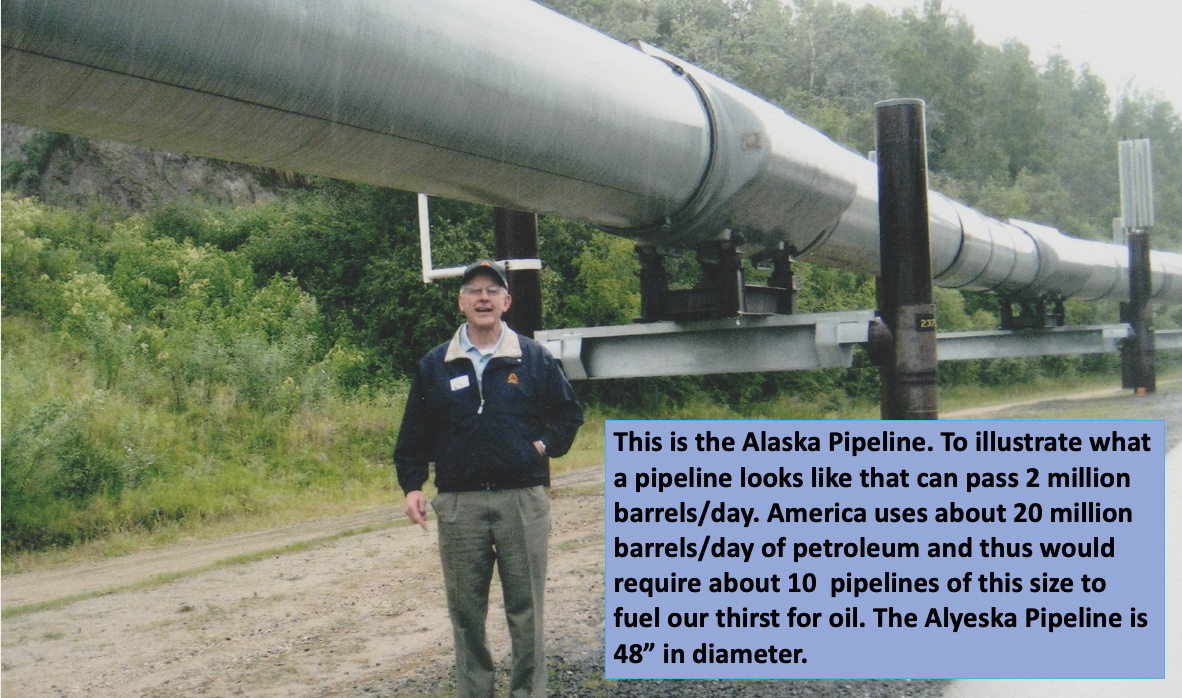


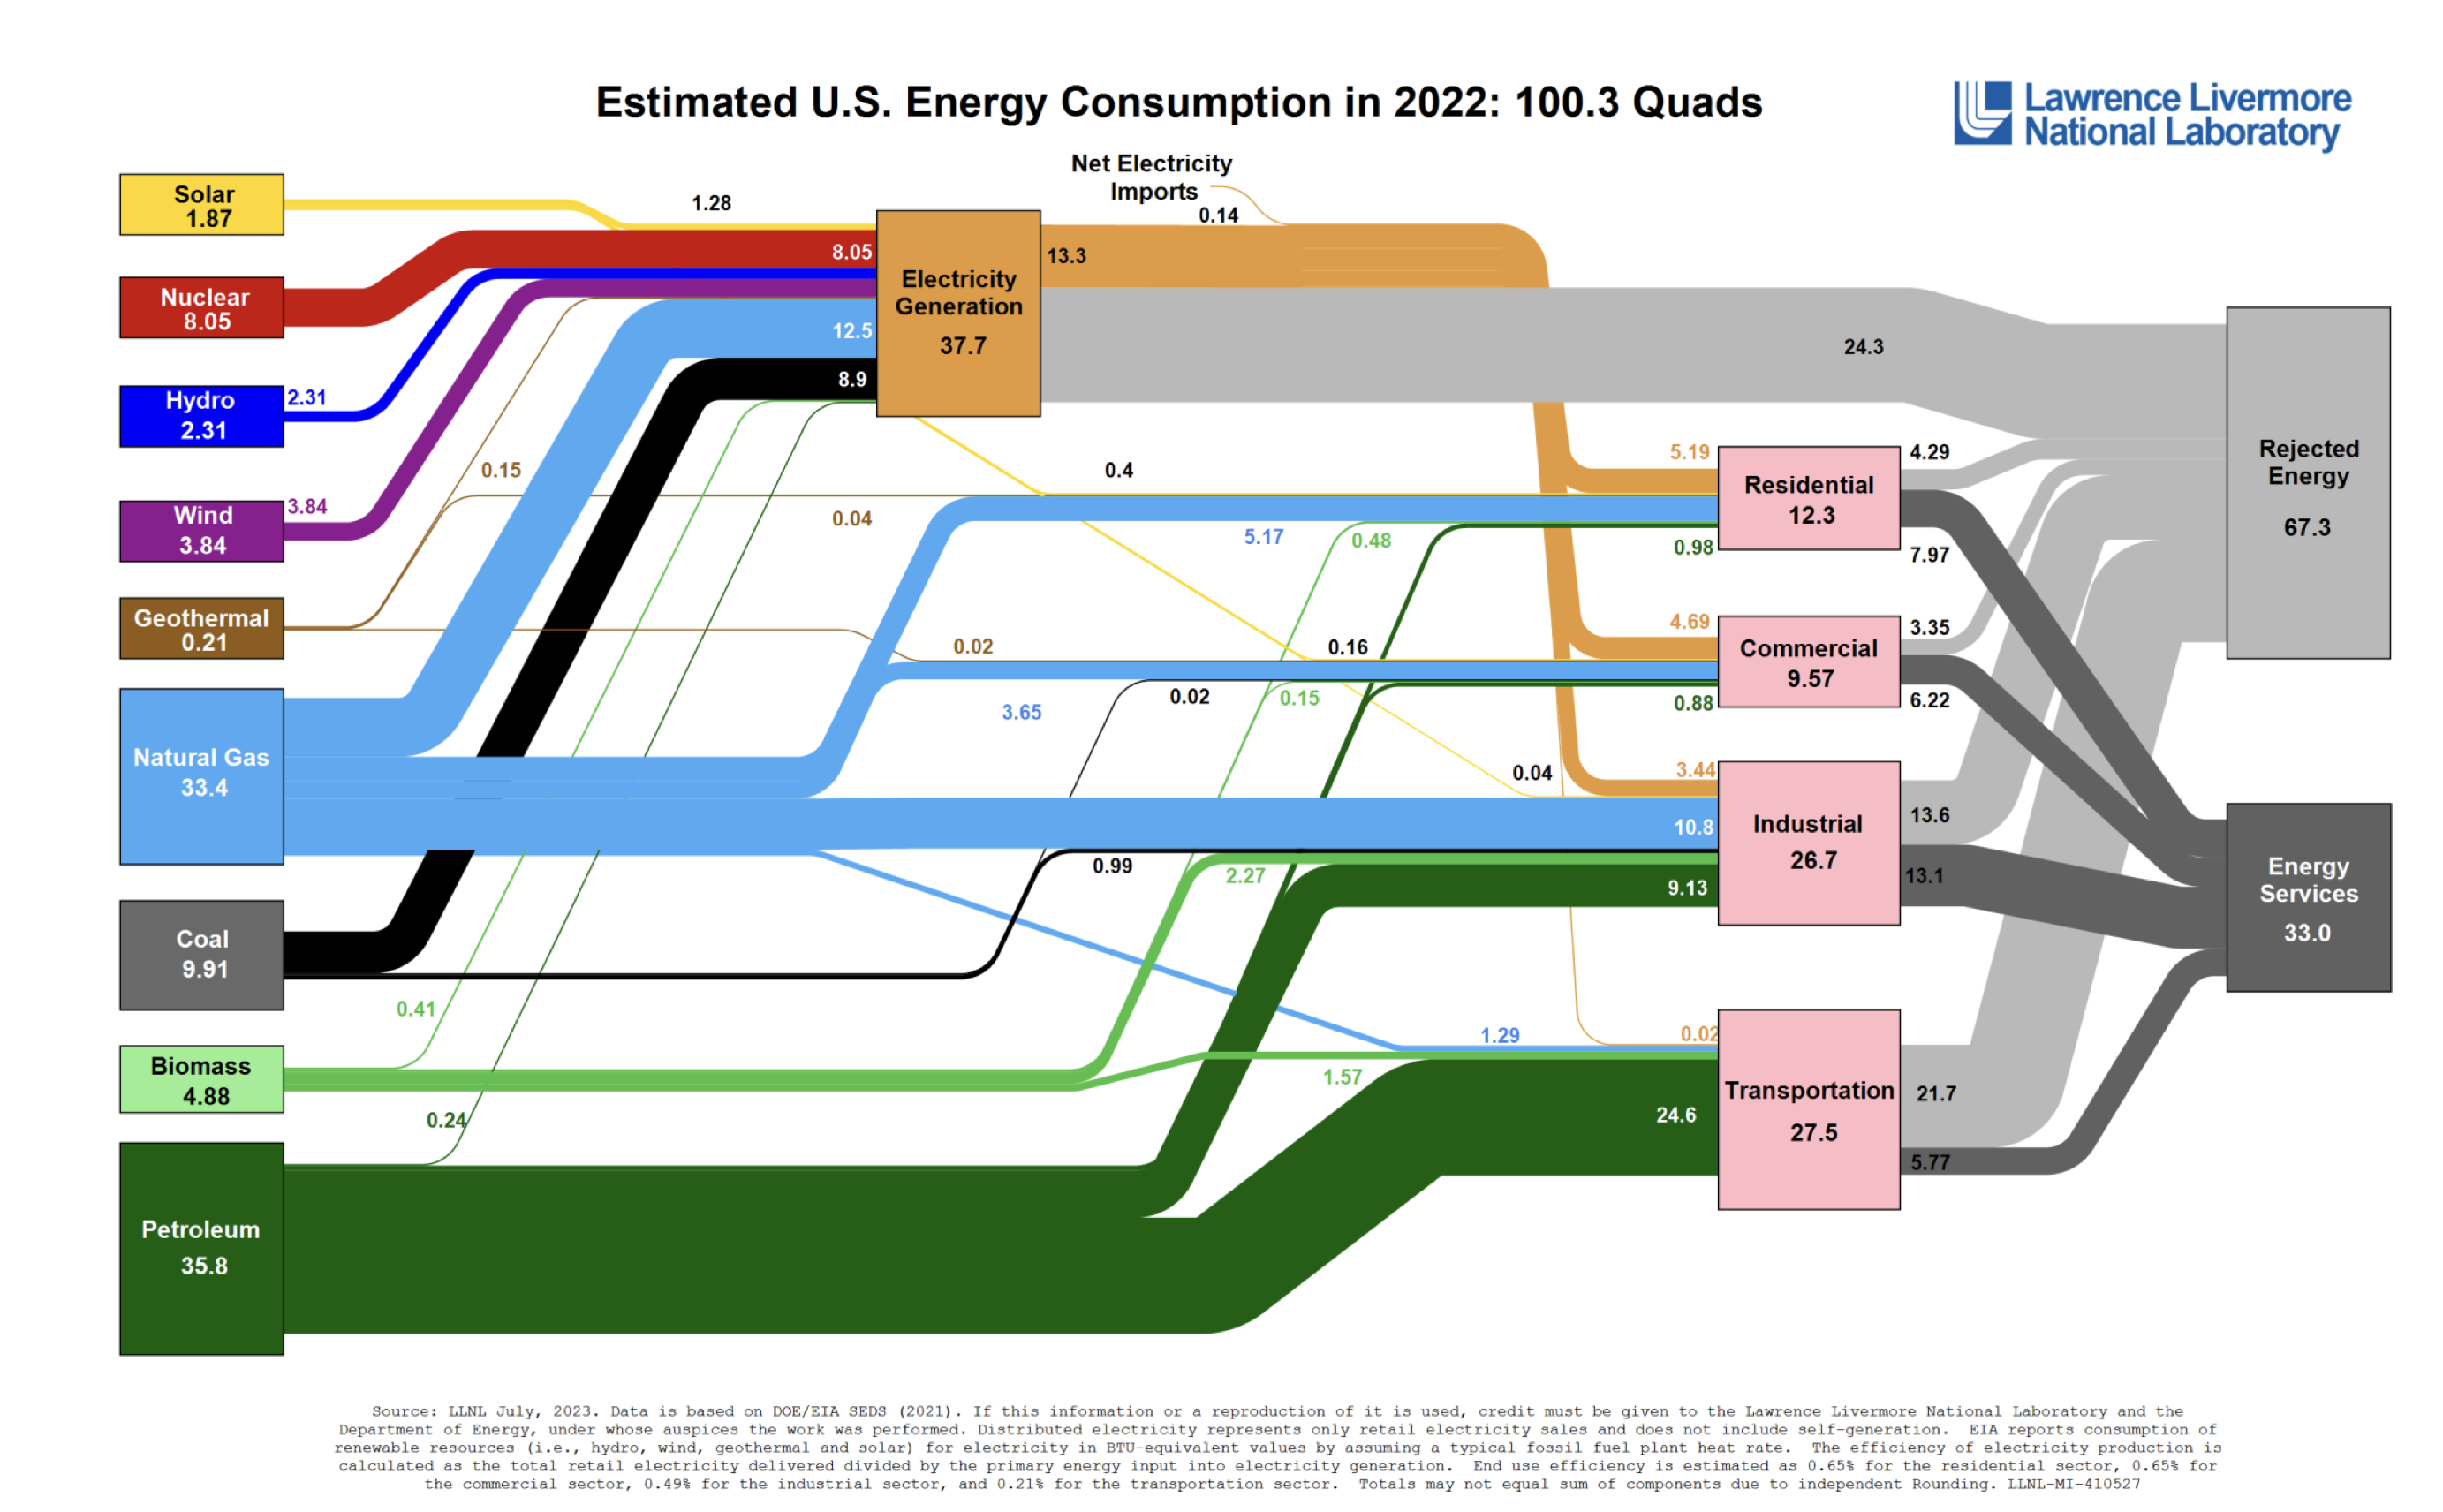
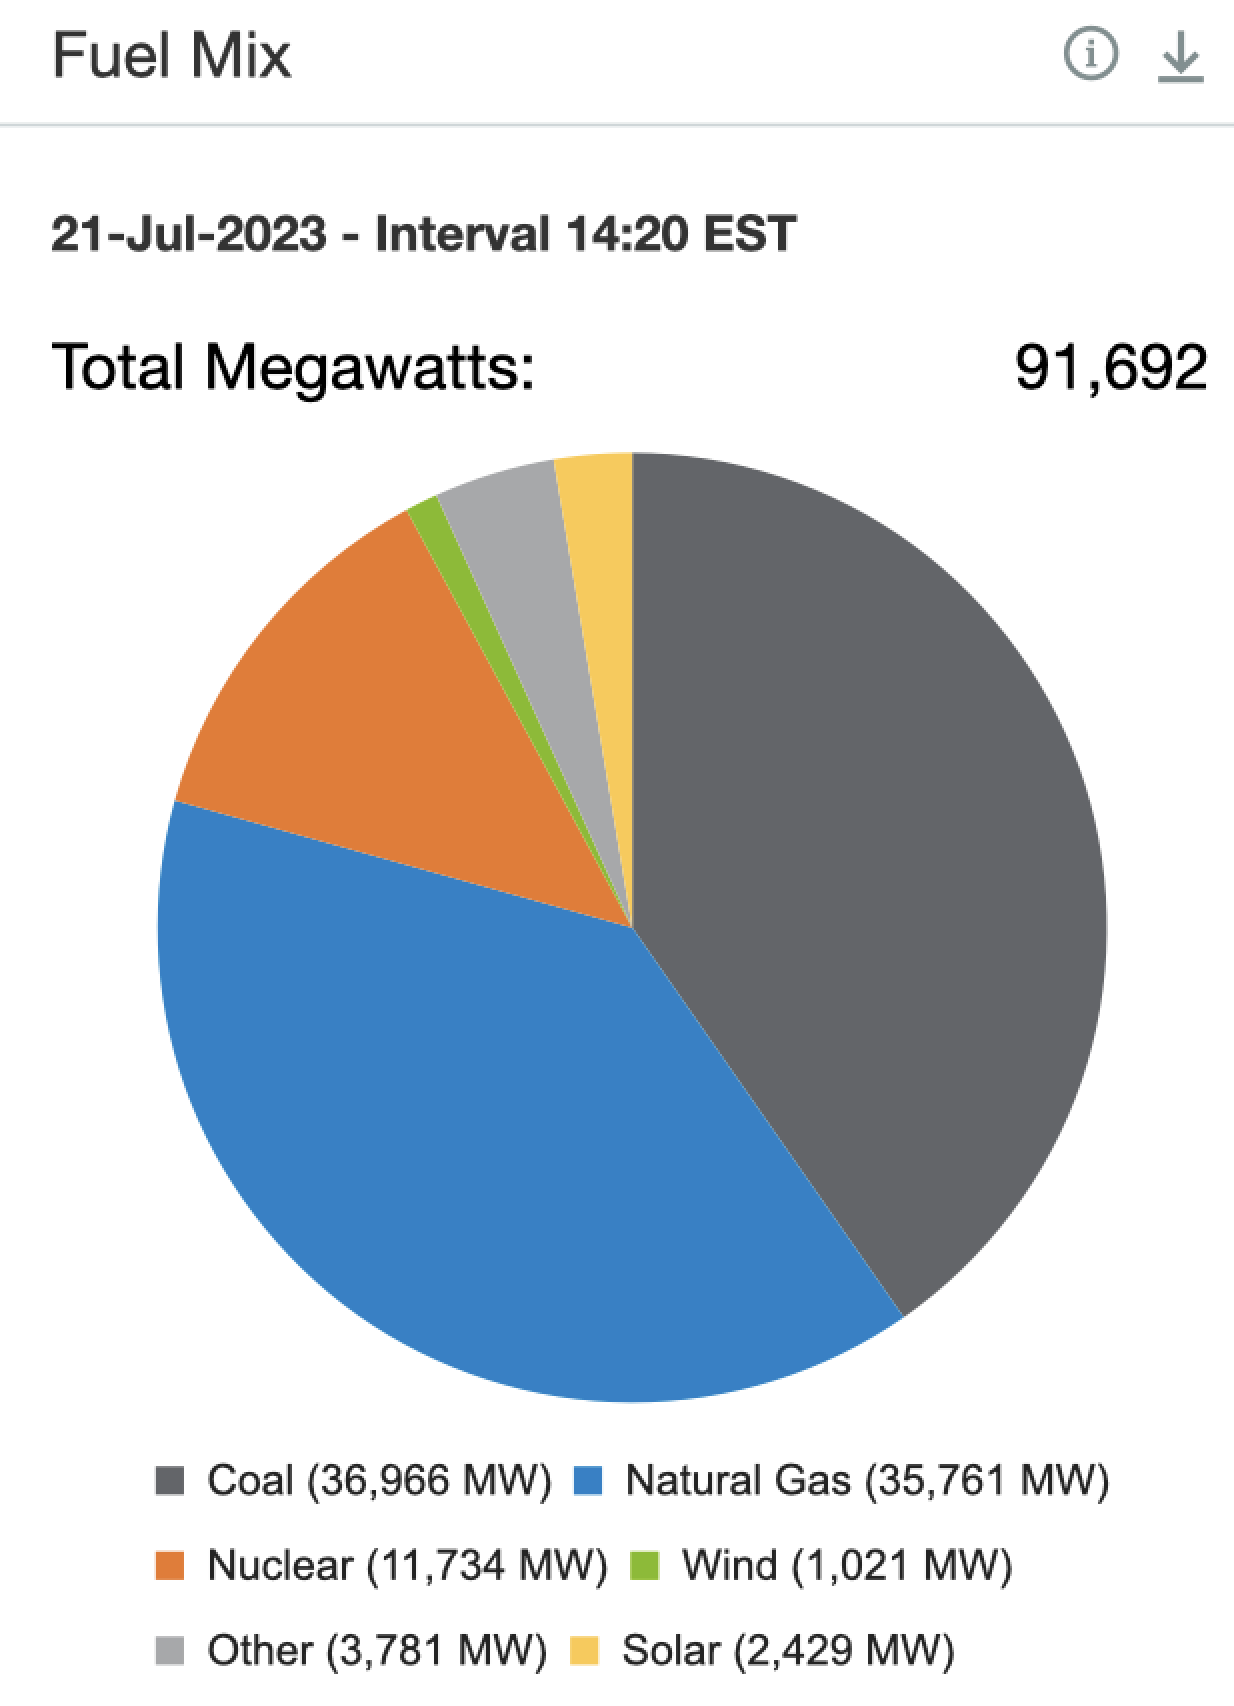
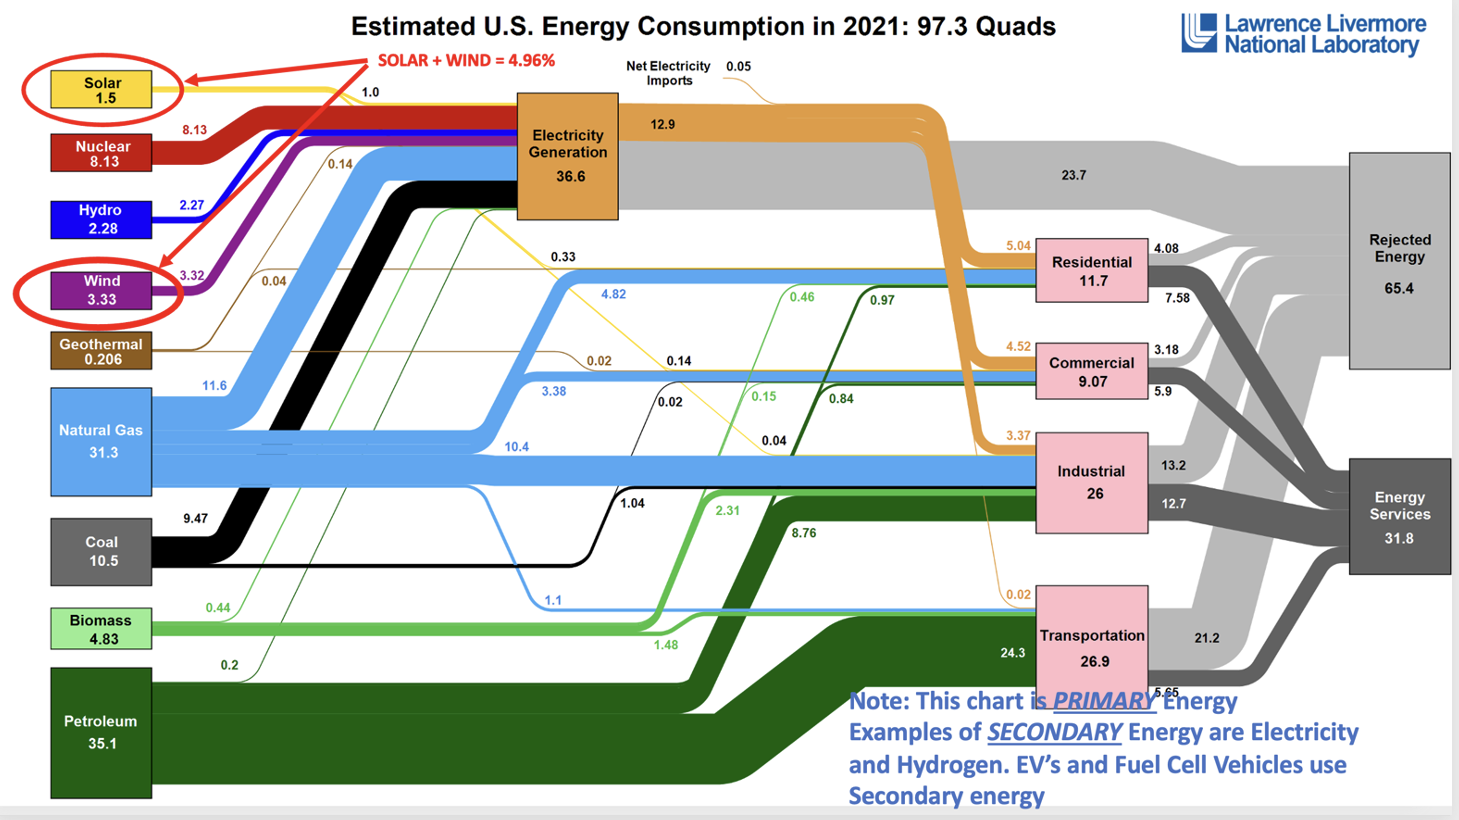


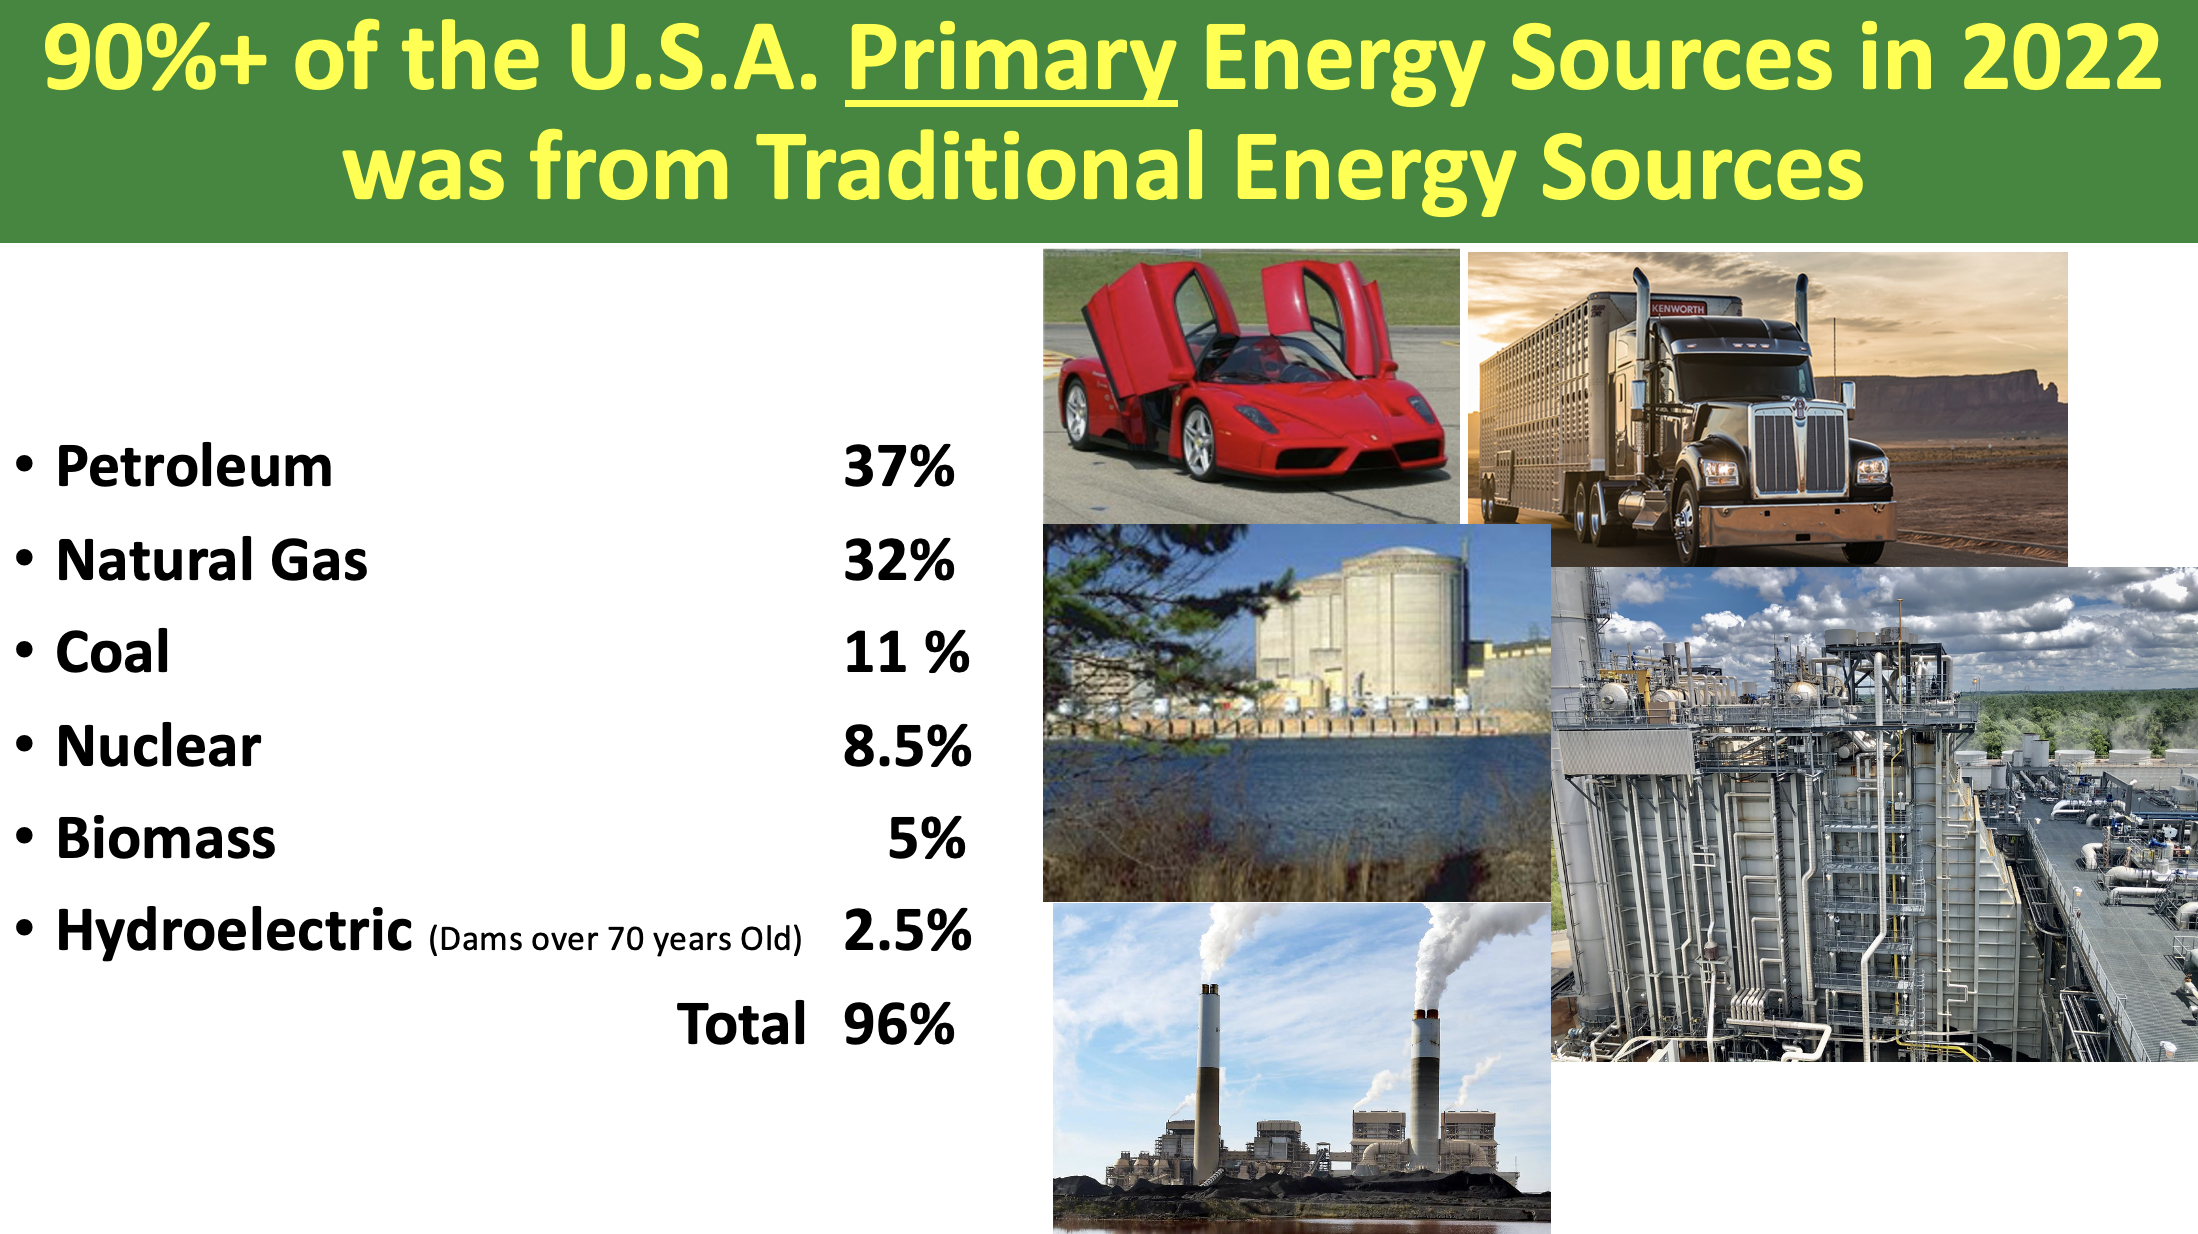


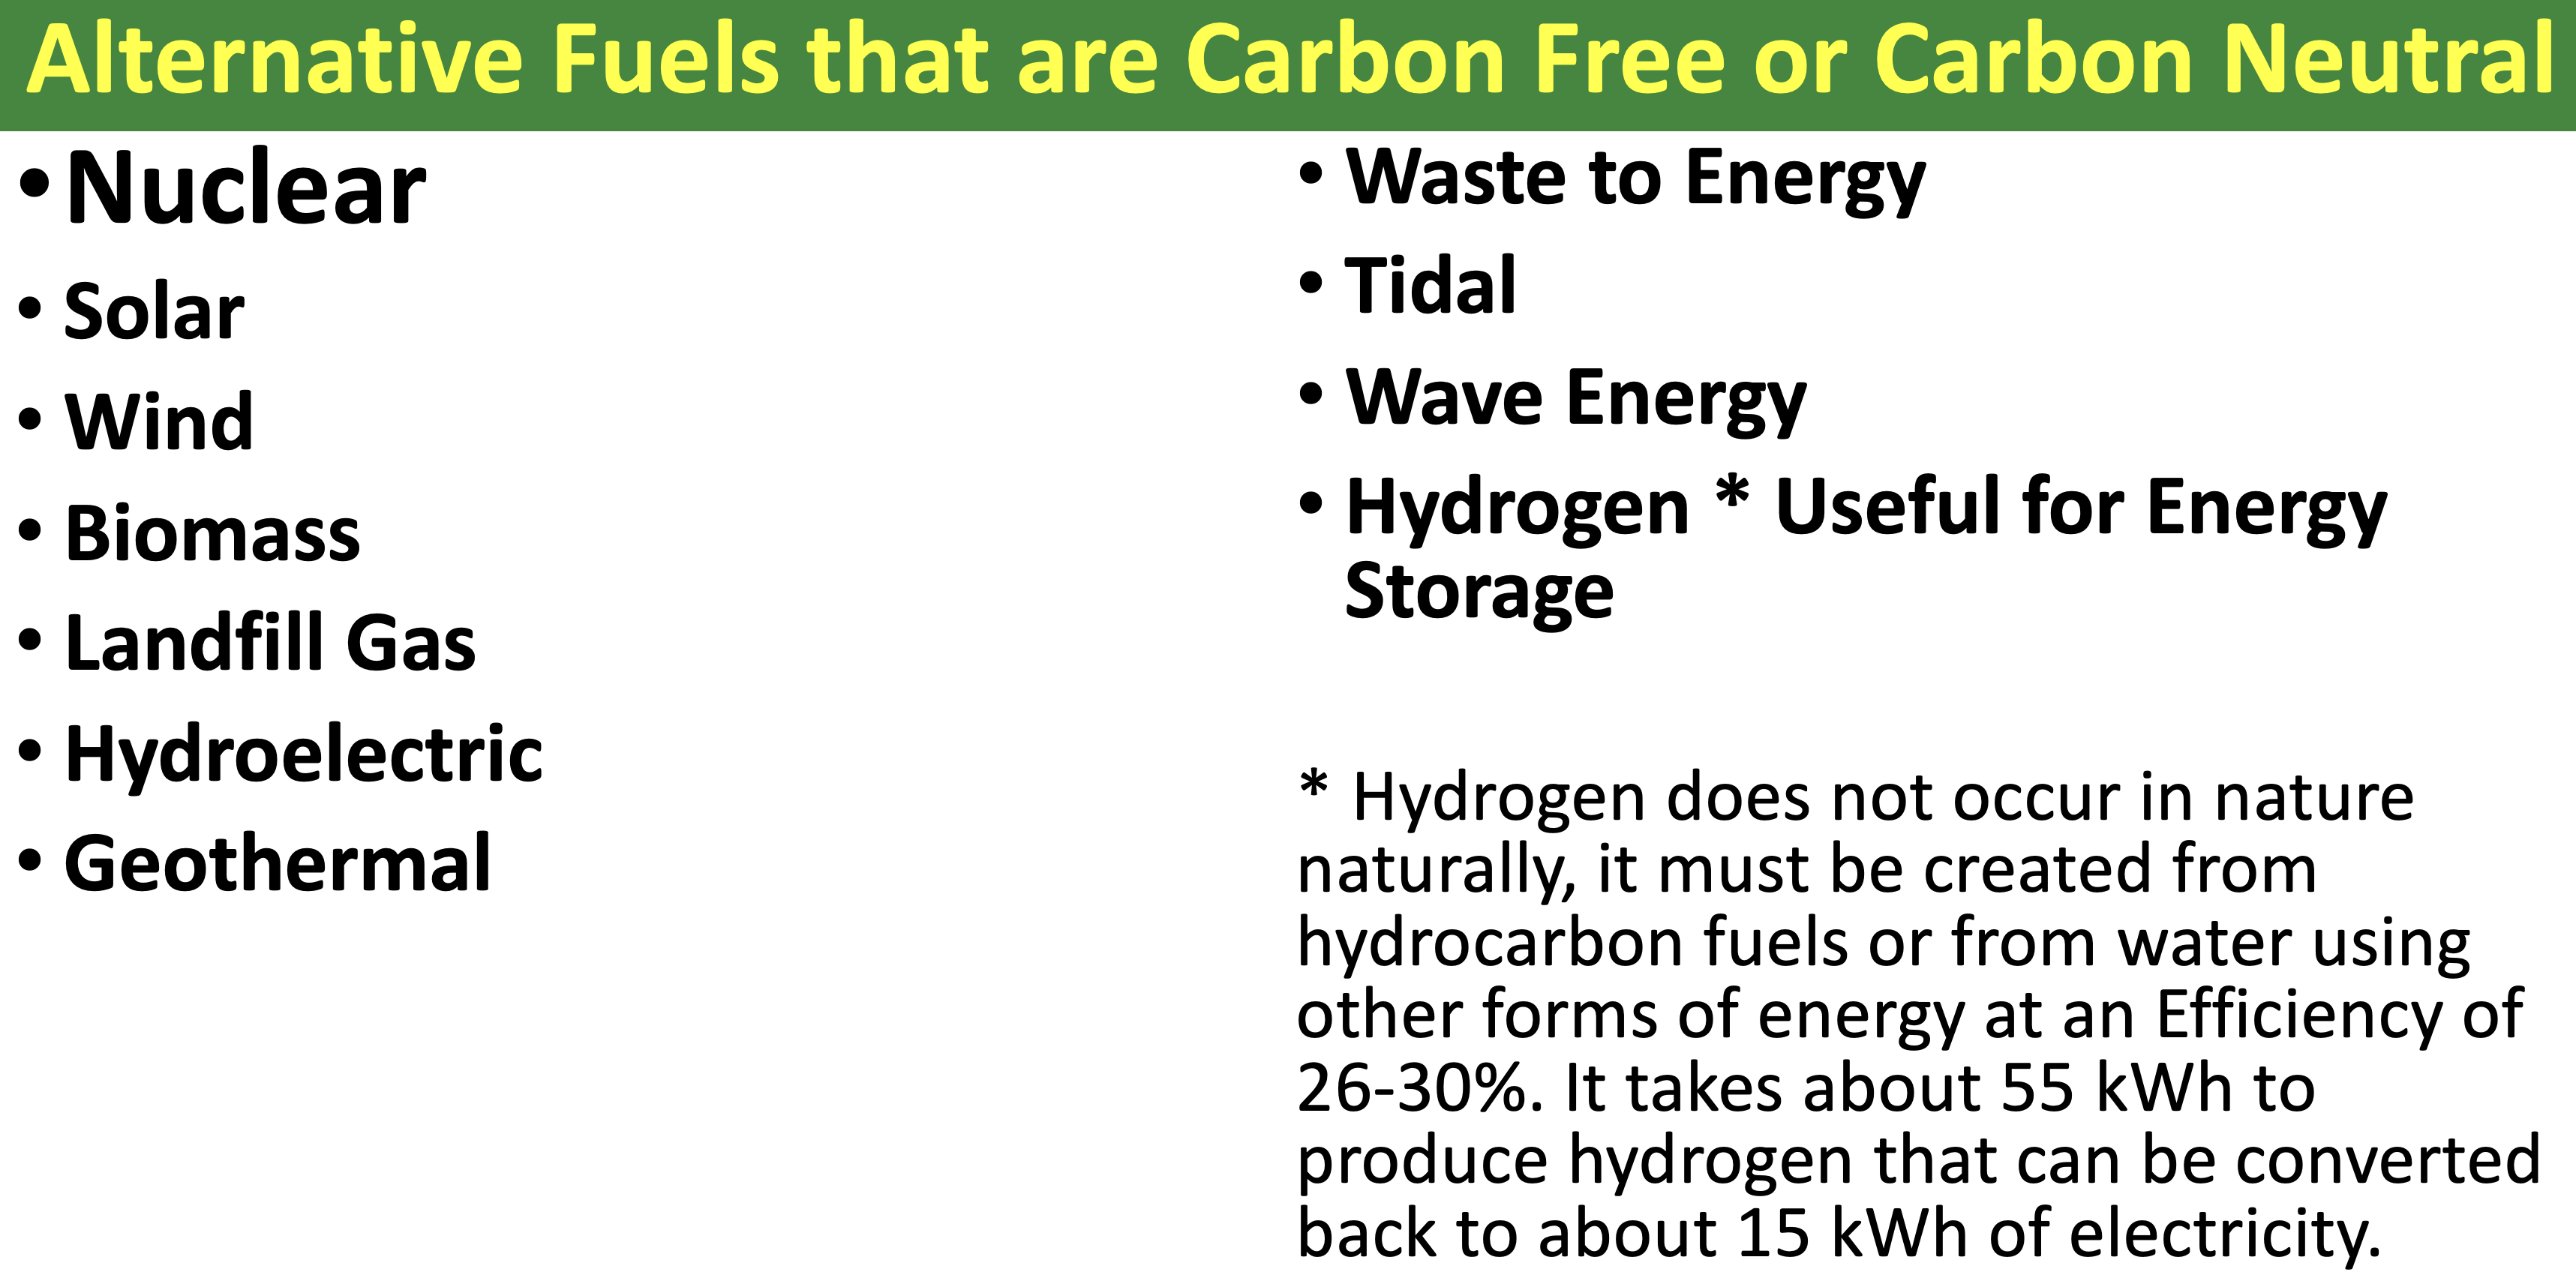
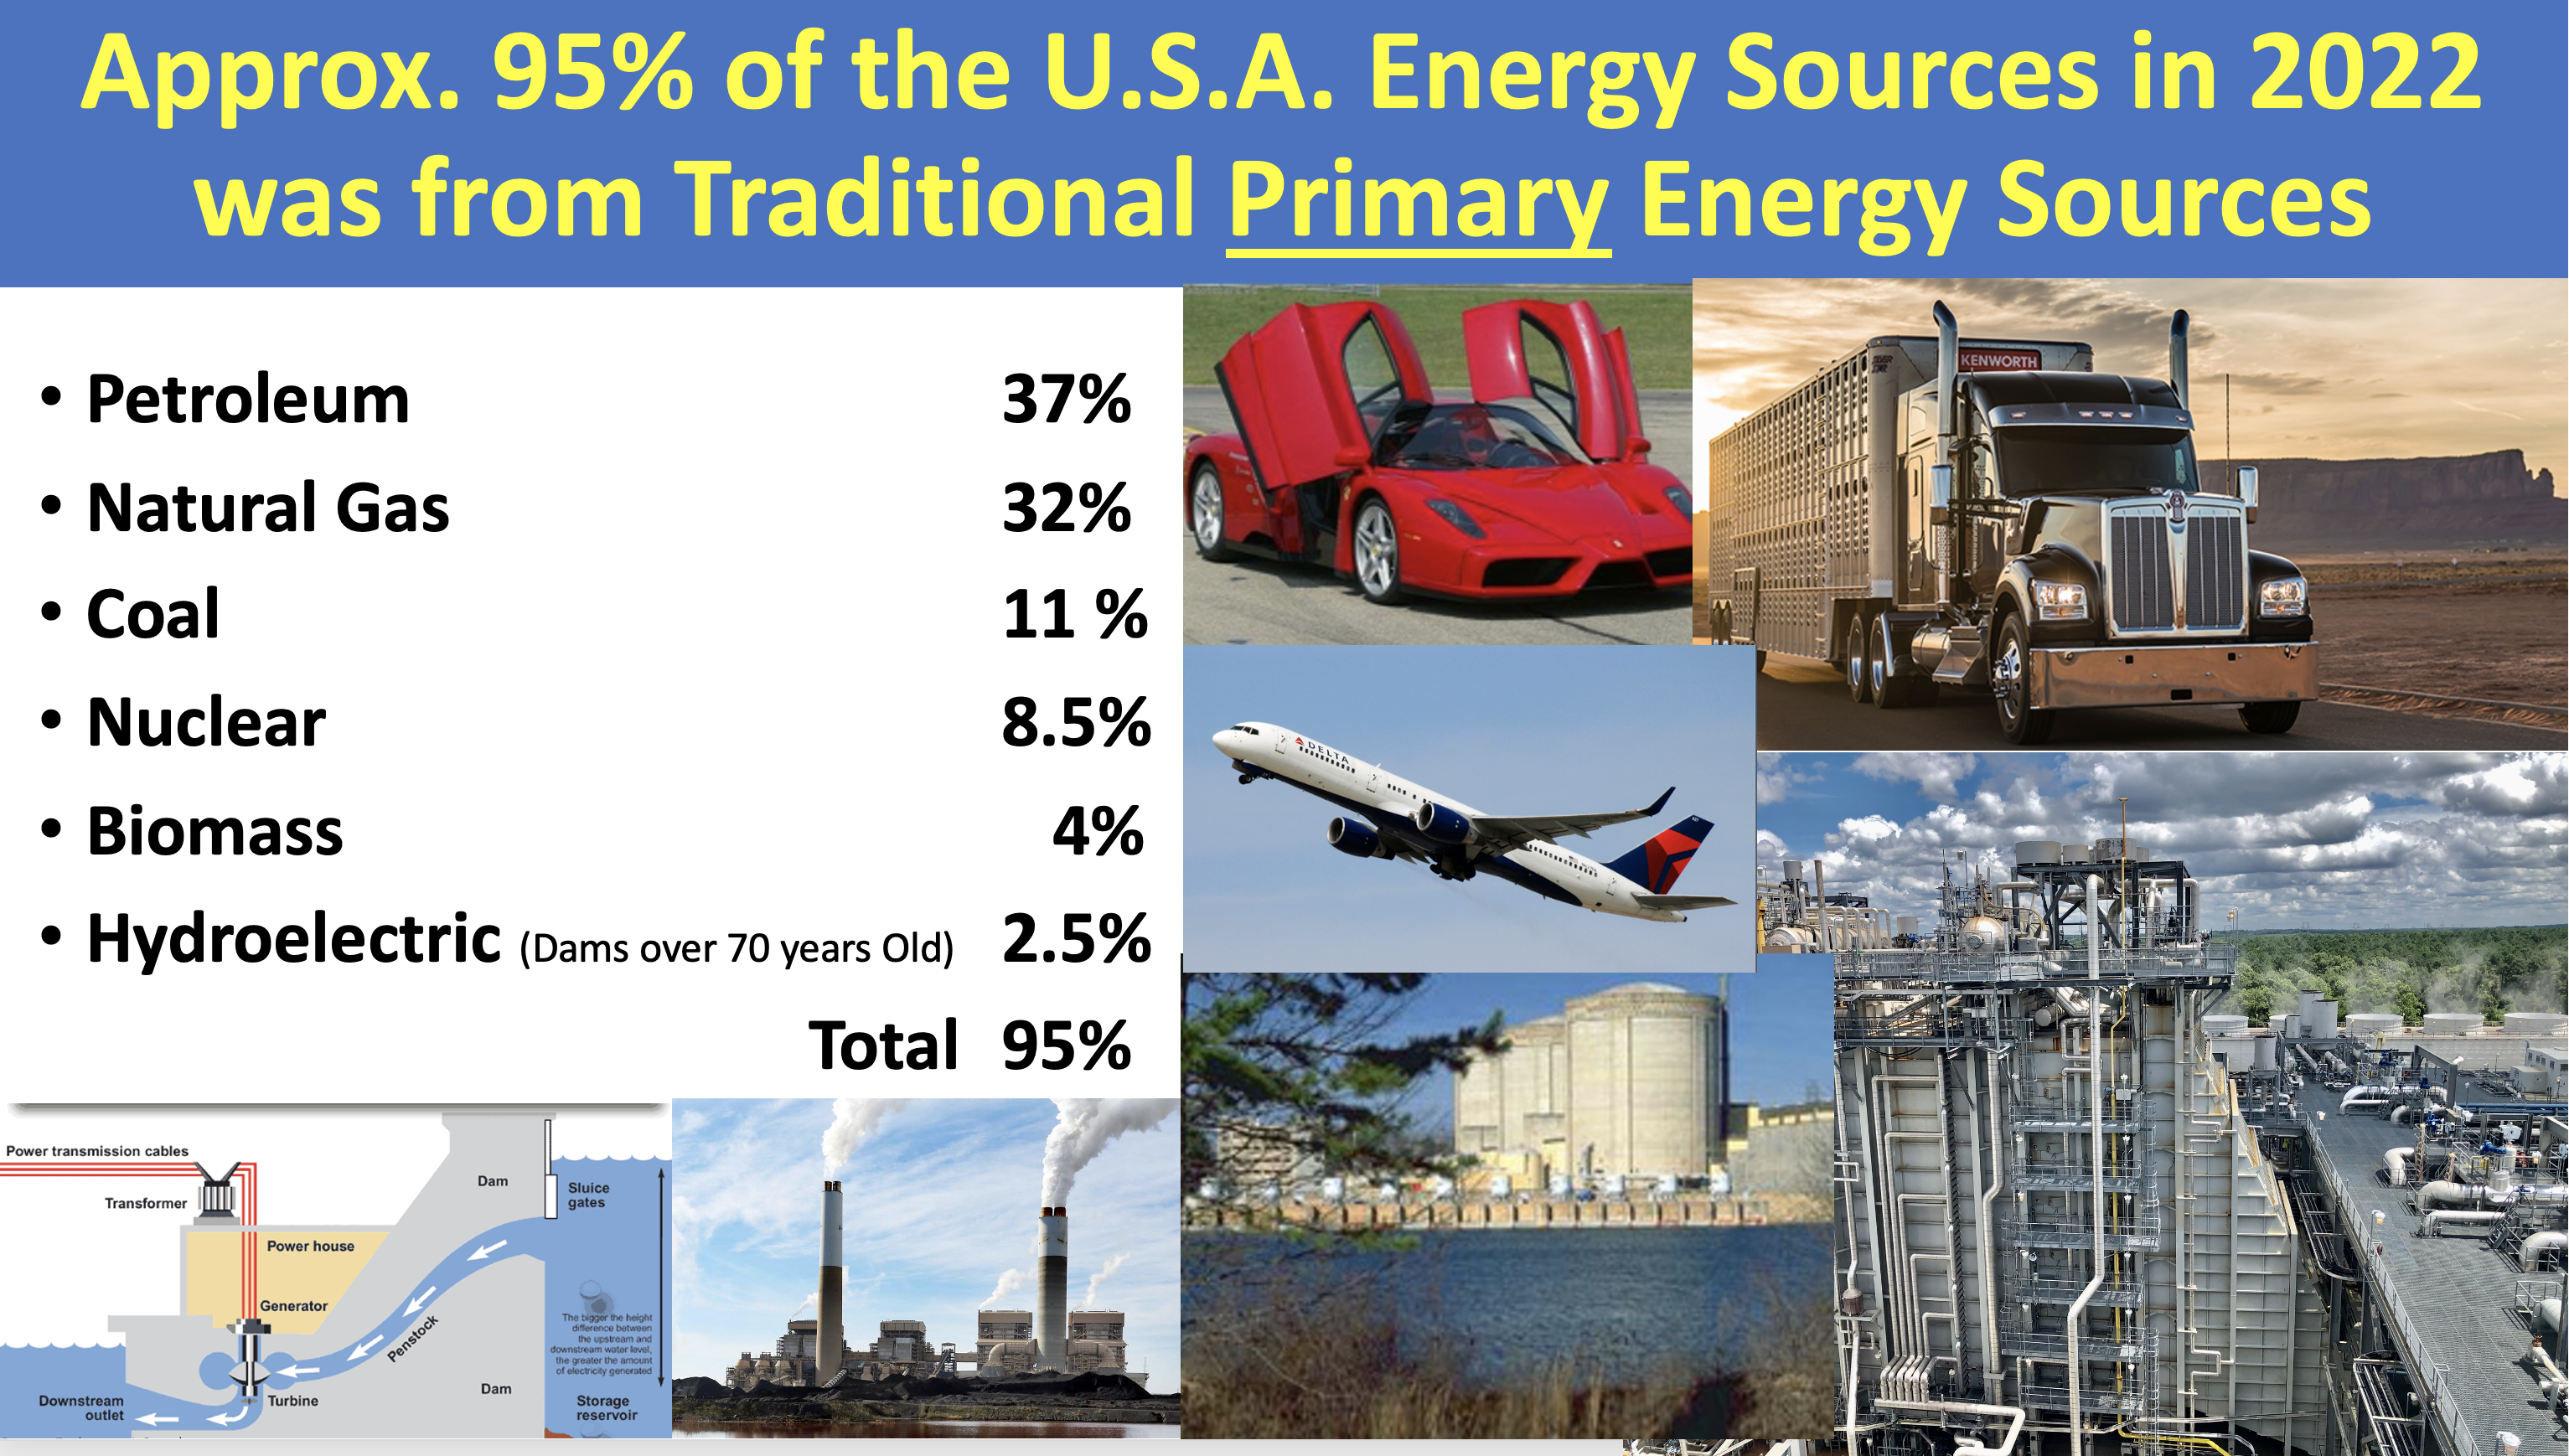


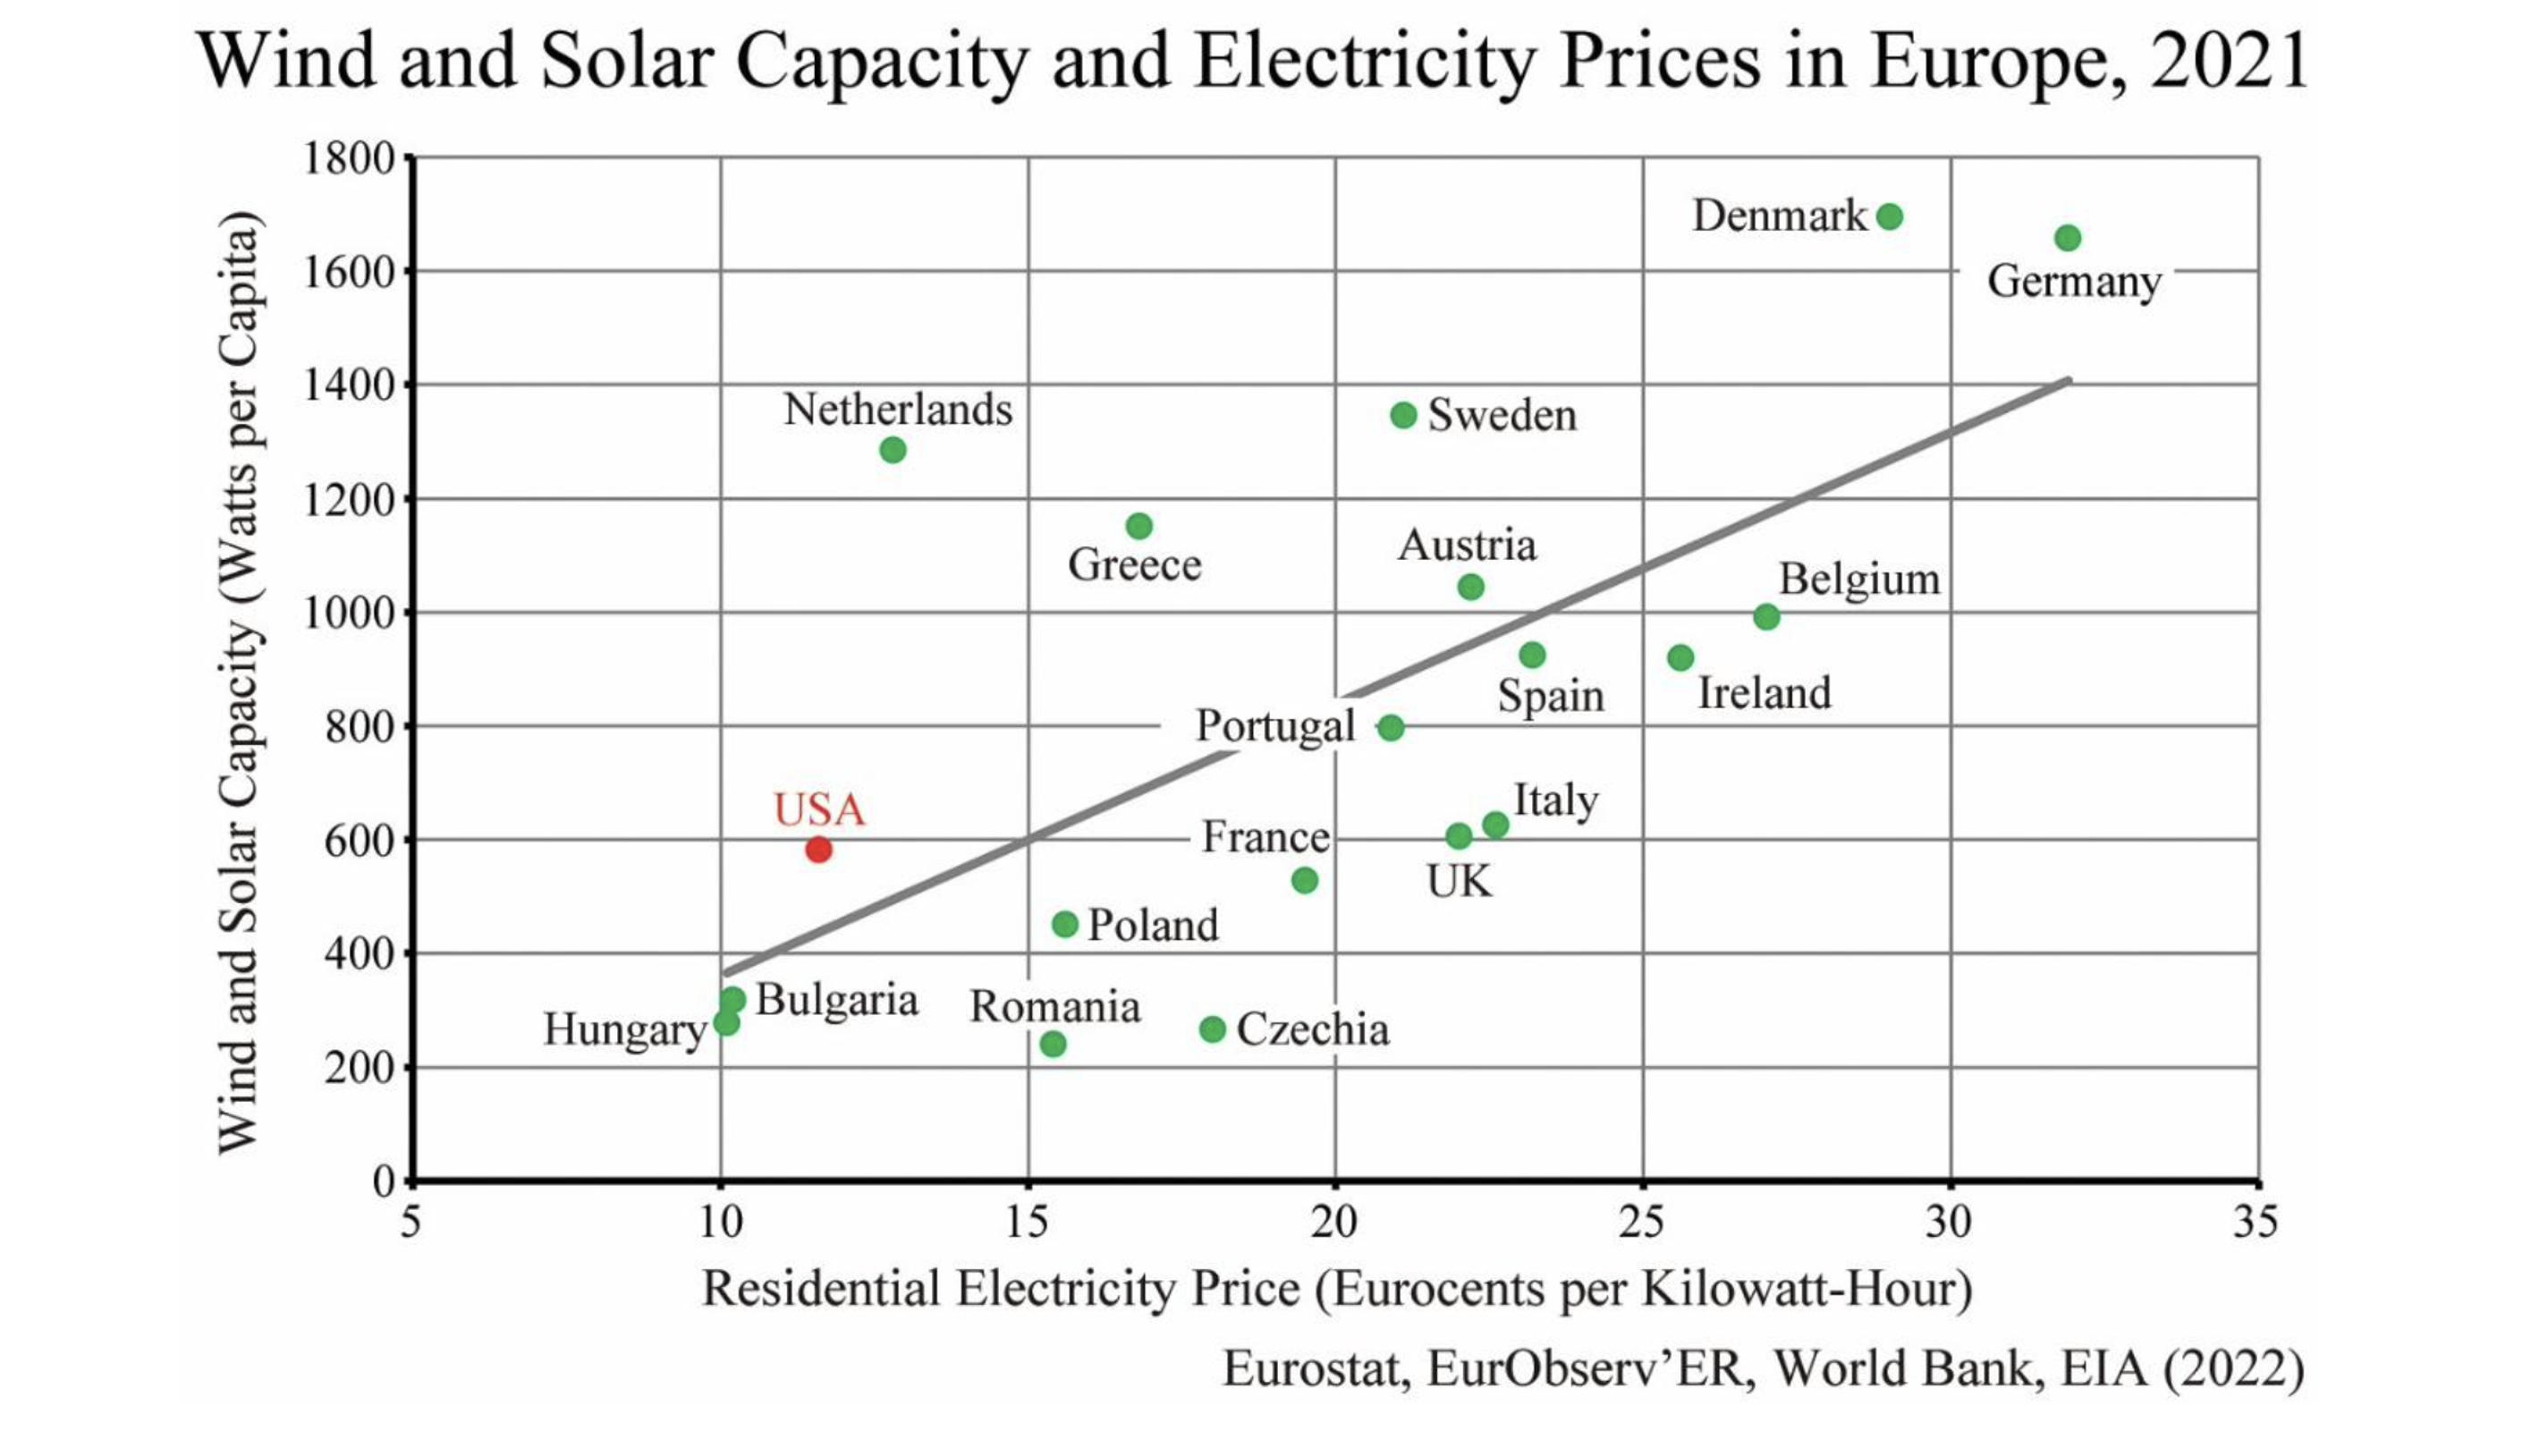


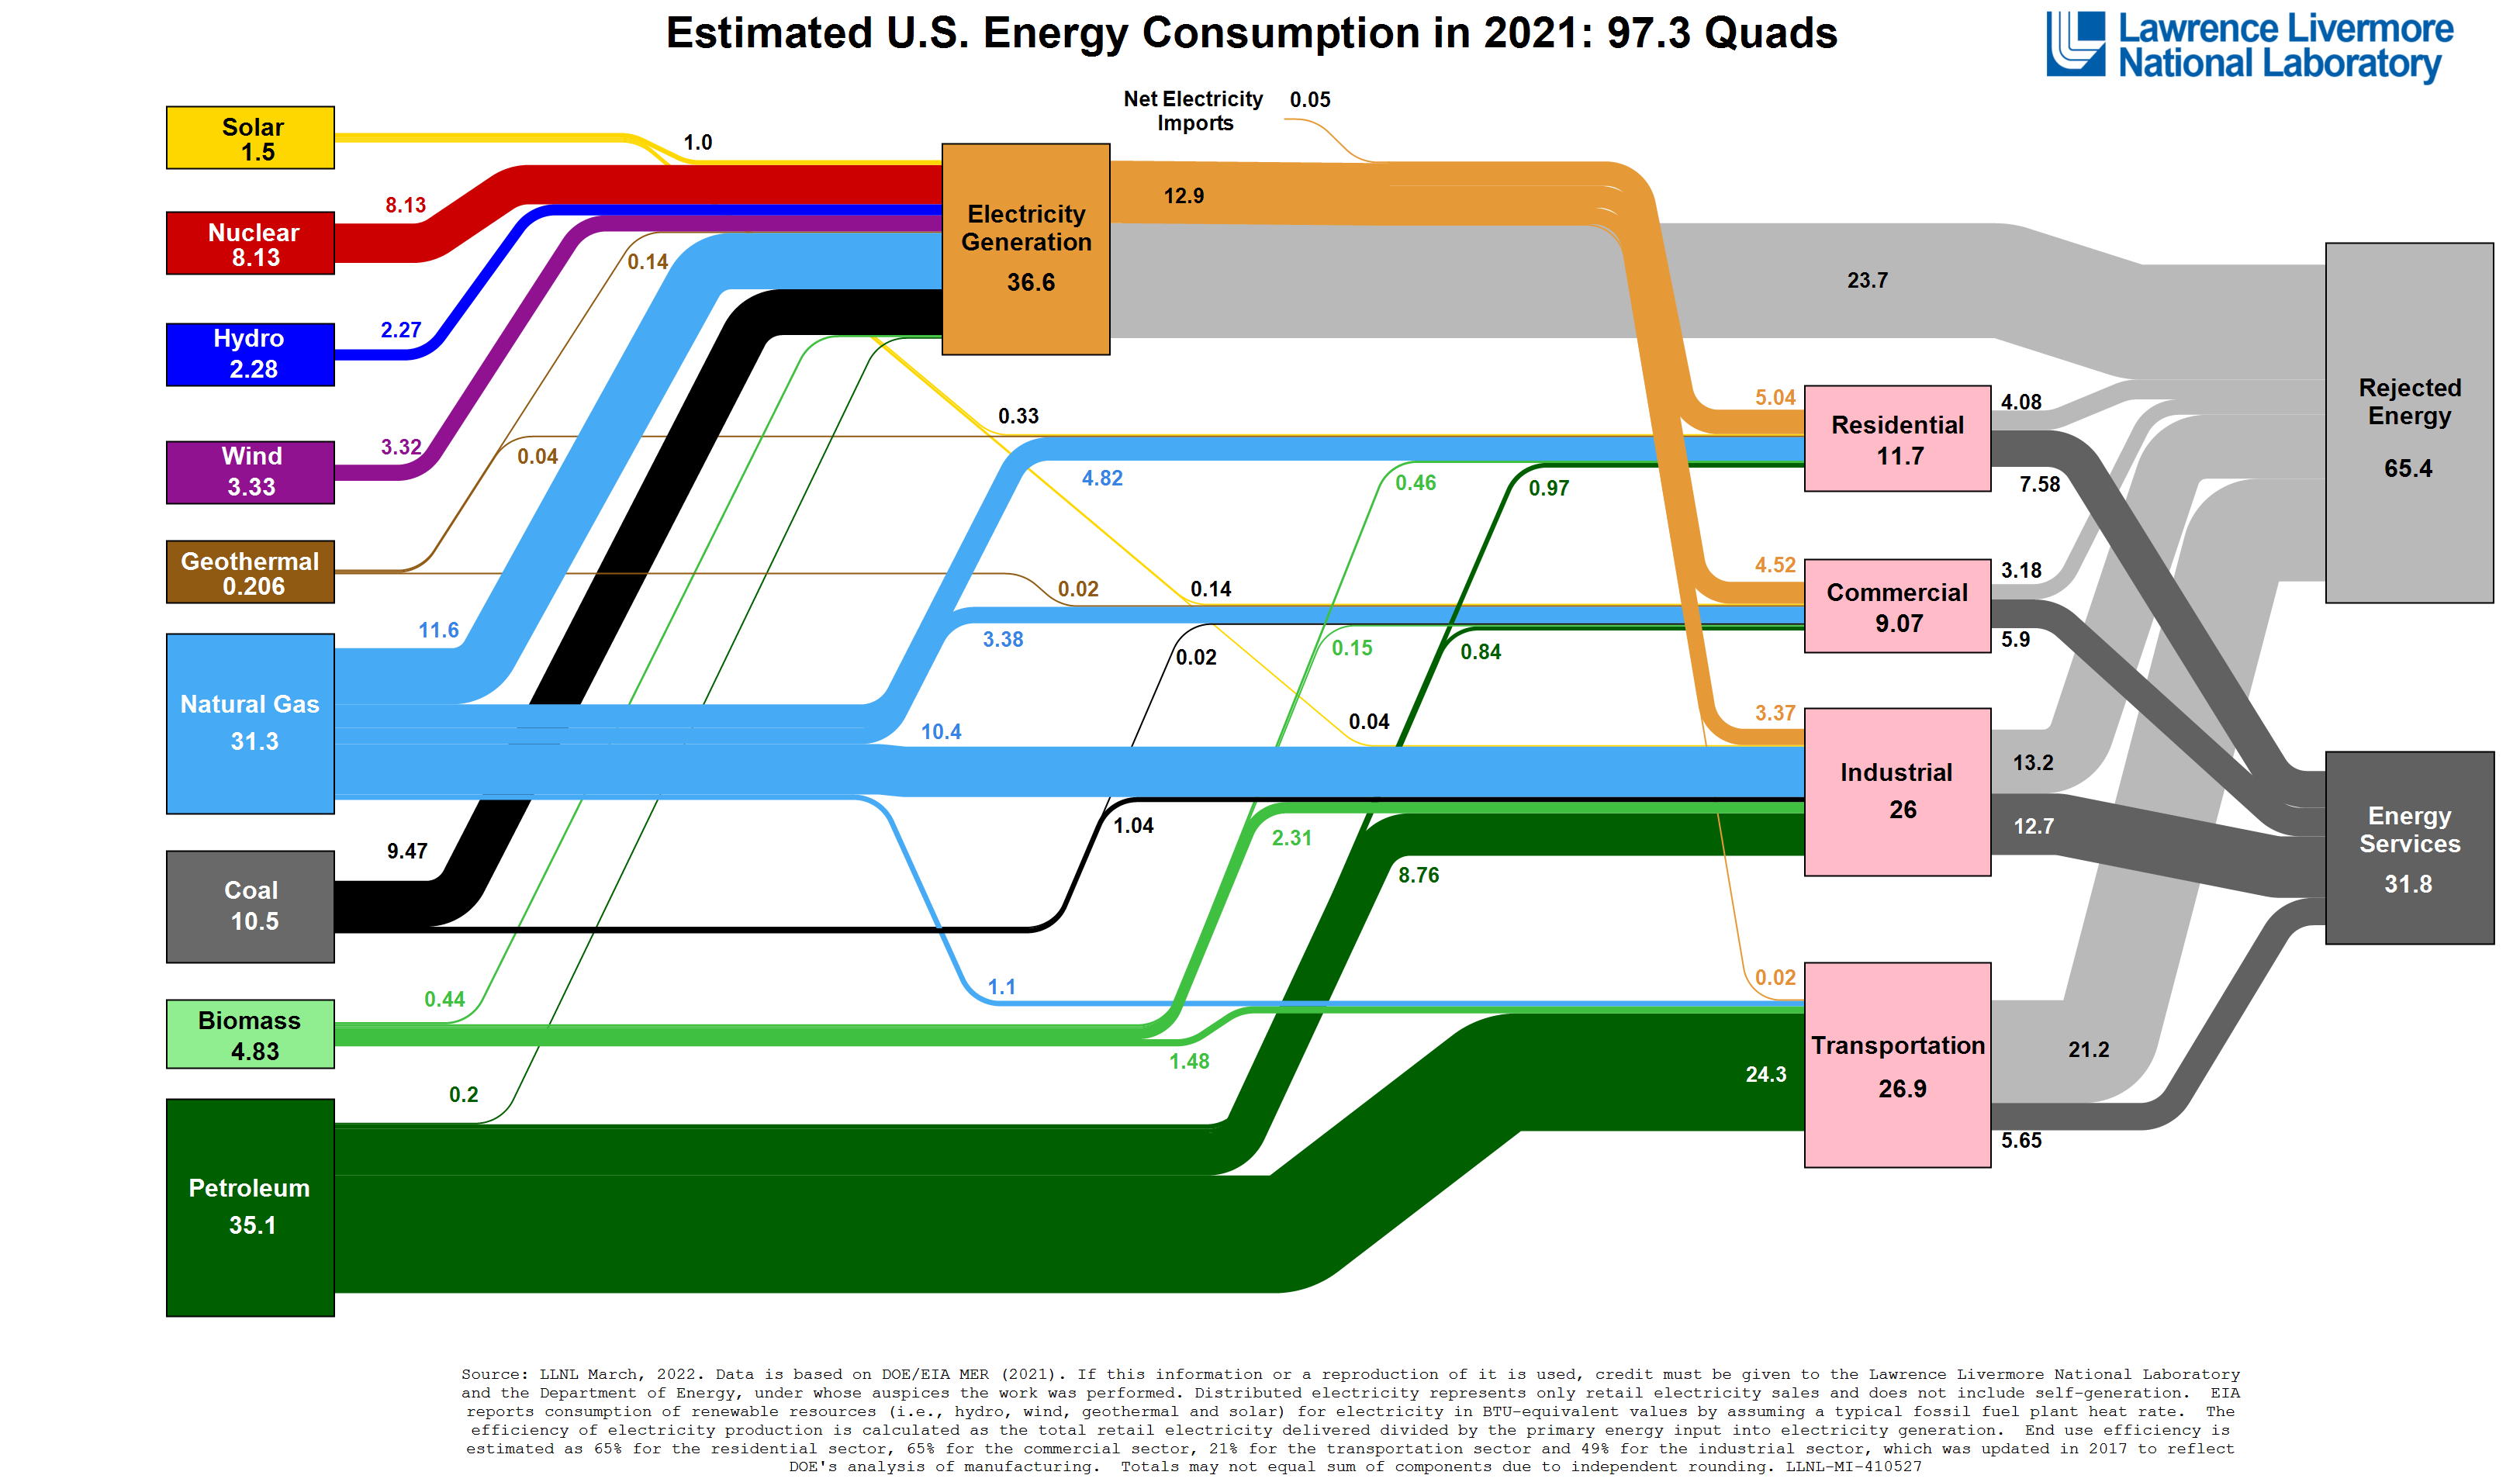