How many products have you bought lately that have a “Made in America” label on them? This article is to provide some background on the importance of conventional fossil fuels to provide the fuel for over 53,000 ocean transport ships. The MV Dali collision with the Francis Scott Key Bridge in Baltimore provides a wakeup call regarding the immensity of world trade. The MV Dali is reported to have a fuel capacity of 1.8 million gallons of fuel. Its engine is an MAN-B&W Diesel rated at 41,480 MW or 55,6260 Horsepower.(2)There are thousands of other large ocean transport ships like her that we depend on each day to distribute raw materials and products to the people of the world, 99% are powered by fossil fuels.
Sometimes, it takes a tragedy to stir the public’s attention. Before the Dali collision and subsequent collapse of the Francis Scott Key Bridge, many folks may not have given much thought to the number of huge ships like this that are delivering raw materials and manufactured products throughout the world.
My main point is, the motive force to propel these ships through the water represents a lot of primary energy. According to the IEA, about 8.7 Exajoules (8.2 Quadrillion BTUs).About 25% of the world’s total energy consumption is used for transportation, when all ships, trains, motor vehicles and aircraft are considered.
How Much Fuel Does one Large Ship Consume?
One of the largest container ships to call on the U.S., the CMA CGM Benjamin Franklin, carries approximately 4.5 million gallons of fuel oil. The smaller Dali about 1.8 million gallons.
The CMA CGM Benjamin Franklin is considered an ultra-large container ship, as it can carry the equivalent of 18,000 twenty-foot equivalent units (TEUs) in containers. Ultra-large container ships are more frequently used to bring goods from Asia to Europe.
Container ships that can go through the old Panama Canal locks are called Panamax ships and can generally hold up to 5,000 TEUs. Those vessels typically hold between 1.5 million and 2 million gallons of fuel. (The Dali was carrying 4,680 containers when it struck the Key Bridge)
Many container ships that call on the U.S. now are considered post-Panamax or New Panamax, named so because they are larger and can go through the newer, larger locks on the Panama Canal. Those ships are generally in the 8,000- to 14,000-TEU range. Ships in that size range can carry between 2.5 million and 4.5 million gallons of fuel.
The amount of fuel actually to be used on a trip depends primarily on the ship’s speed. Most ship engines have been designed for top speeds ranging between 20 and 25 knots per hour, which is between 23 and 28 miles per hour. A Panamax container ship can consume 63,000 gallons of marine fuel per day at that speed. This is a lot of fuel however, when expressed as fuel per ton mile, ocean transport is more efficient and uses less fuel/ton of cargo than any other method of shipping.
How Many Ships?
There are over 53,000 merchant ships registered to sail the oceans. This according to “Info Maritime” (1) The top 15 countries for numbers of vessels is shown on the chart below.
Closing Summary
Ocean transport is important to supply the people of the world with the products, food and raw materials needed to live sustainable lives. (Sustainable to me means, living the high quality of life that we enjoy now)
I should mention that this article was inspired by Ron Stein’s article in “America Out Loud”, which made mention of petroleum products making possible 6,000 products, 50,000 military aircraft, 50,000 ships and 20,000 commercial airplanes that the people of the world all depend.(7)
Fossil Fuels in the U.S.A.
Fossil Fuels used in the U.S.A. are shown below by the EIA for the year 2023. The world use of maritime fuel was stated by the IEA at 8.2 Quadrillion BTUs. The U.S. portion uses 26.1 Quadrillion BTUs of petroleum products for all transportation (34% of total fossil fuels), as shown below by the EIA chart. (If Exajoules and Quadrillion BTUs seem abstract, then think “Billions of gallons”.)
Conclusions
Ocean transport is important to sustain our quality of life. Including transport of food. Billions of gallons of Fossil fuels are used for shipping and this reasonable cost and abundant fuel is extremely important to keep international shipping costs reasonable.
The marine industry is under pressure to Decarbonize.(9) This is not only ludicrous but also it will be very expensive. The large and truly magnificent reciprocating internal combustion engines, a couple examples are discussed above are versatile and with some modifications, can be converted to use hydrogen, Methanol or ammonia. However, the production of hydrogen as a fuel requires much more energy, up to four times as much for production as is provided by the burning of the resulting hydrogen as fuel. Therefore a quick back of the envelope calculation would indicate that changing to hydrogen fuel will cost 4 times as much as current marine Diesel or Bunker fuel. Have you bought any hydrogen lately?
Large reciprocating engines similar to those used for ocean transport have been successfully used on land in stationary power generation power plants. They have the operations flexibility for fast starting and a quick shut down.(10, 11, 12) Operational flexibility that is ideal for backing up intermittent renewable solar and wind. The next article will feature these derivatives of large marine engines that are used for backup of Variable electricity generation renewables.
The 20th century began with much farm work, transportation, heating and home chores being done with muscle power and wood burning. As coal, petroleum, natural gas and later nuclear energy were applied to replace muscle power, our country experienced rapid growth in industrial production, food production, shipping, travel and a growing economy. Also, comforts and conveniences at home and work such as air conditioning, refrigeration, cooking, dishwashers, automatic washers, and more. A previous article on the history of energy is here. That 105 year period 1850-1955 yielded incredible growth in both industrial output and economic growth. The strength of the U.S. grew and expanded for the U.S. to become the Greatest country in the world, with the largest economy in the world. This was made possible by many factors, including; the Judeo-Christian work ethic of the people, Liberty, Capitalism, Free Markets, creativity, inventiveness, innovation and the abundance of God’s given treasure of Domestic energy resources. Including the richest deposits of coal in the world, natural gas and petroleum. America, the Saudi Arabia of Coal!
An important point, not often discussed. Wherever there is coal, so is there oil and gas. In 2023, the U.S. produced more crude oil than any other country.(24) This in spite of excessive Federal regulations and an out of control EPA.
Reasonable cost and abundant energy was essential for America’s success, just as energy is essential for any other country’s success. America’s energy use is reported in British Thermal Units (BTU) and the U.S. uses about 100 Quadrillion BTUs each year. The Energy Institute and the International Energy Administration reports world energy use in Exajoules (EJ) and the world uses about 620 Exajoules per year. (0.947817 x 620 EJ= 587.6 Quadrillion BTU)
Why Horsepower?
I have written on this before and had some feedback from readers and friends that “The general public doesn’t understand it when they are told they use about 850,000 BTUs of energy each day or the U.S. used 100 Quadrillion BTUs in a year”. Therefore, for this two part essay I thought I would express electricity energy in “Horsepower”. Rather than BTUs, kWH, Joules or Foot-Pounds, this article expresses energy production in Horsepower because, especially my family and friends, horsepower is a term most folks look at when buying a new car or truck, whether it is a 250 Hp Diesel fueled Ford F-150 or a 1020 Hp Tesla Model S. The fuel for each must first be provided by Primary Energy used to create either motive force or electricity.
Primary Energy
About 92% of the Primary energy used in America is used in Heat-Engines to power our high quality of life. About a third of the primary energy used in the U.S. is used to generate electricity. This article is intended to be a primer on the massive Heat-Engines that keep our Grid energized. Part 2 will include smaller heat-engines used for electric power generation and those used for transportation. It is my goal to keep the Thermodynamics simple so that non technically trained people can understand the importance of the 92% conventional Primary energy that we depend on. Past articles that I have written attempted to explain the differences of Primary Energy and Secondary Energy.Here, Here and Here. Primary energy flows in the U.S. for the year 2022 is shown on the LLNL chart here. The World use of Primary energy is shown by the Energy Institute here.
Common Large Heat-Engines
Definition of a Heat-Engine: A heat engine is a system that converts heat to usable energy, particularly mechanical energy, which can then be used to do mechanical work. Such as a Steam Turbine which converts the heat energy of steam into rotational force to spin a generator to produce electricity.
Also, a gas turbine or turbo-jet engine that uses heat energy to create rotational force to a shaft. A portion of the heat energy is exhausted as waste. The difference of the heat content of the steam or hot gas at the inlet and at the exhaust is the net work that has been extracted for useful purposes. In this article steam and gas turbines will be discussed. In a power plant the steam turbine or gas turbine is sometimes referred to as the Prime Mover. A previous article touches on Heat-Engines. The illustration below is a graphical description of the conversion of coal fuel to provide heat used to generate steam. The steam is then used to spin a turbine providing the motive force creating shaft horsepower to spin a generator and ultimately generating electric power. The heat source to produce steam can be coal, nuclear, natural gas, oil, biomass or municipal waste. The basic steam cycle remains the same, referred to in our industry as the “Rankine Steam Cycle”.
From Storm Technologies Large Electric Utility Boiler Combustion & Performance Optimization Course
Thermal Power is important for everything we do!
One pre-requisite to understanding Heat-Engines, is to understand the difference between Primary Energy and Secondary Energy. Covered in previous articles, here, here and here.
Types of Heat-Engines
Let’s start with one of the largest first. Here is a photo of the Zimmer Coal Plant. This plant shut down in 2022 but when started up in 1991 it was amongst the largest single unit power plants in the world with 1351 MW capacity, Dispatchable 24/7, rain or shine, summer or winter. This plant was one of my favorites and in my opinion, it is an example of one of the most magnificent heat engines ever built.
The photo above is just part of the power plant, showing the Low Pressure Turbine and generator. There is also a High Pressure turbine and separate generator. The entire Zimmer “Heat-Engine” comprises the entire power plant shown below in an aerial photo. Although I have been in the power generation business for over 50 years, it still amazes me that so much of the equipment involved in the total electrical energy production starting with a coal conveyer moving 500 tons per hour of coal can be pulverized and burned, produce steam to the turbines and generate electricity to the Grid (the equivalent of 1.8 million Hp) through three skinny high voltage wires that are smaller than 2″ in diameter and 1.8 million horsepower of energy.
Photo from Cincinnati Newspaper about 1994
The Zimmer Coal Plant when operating at full capacity of 1350 MW’s is equivalent to about 1,800,000 Horsepower. To generate this much power about one million pounds of 11,000 BTU/# coal would be pulverized and burned in suspension in the furnace each hour. That is one reason why I refer to this power plant as a Magnificent Heat Engine. The million pounds per hour (Imagine five 100 ton coal cars/hour) of coal is converted into electricity that flows through three high voltage conductors to the transmission lines feeding the Grid. The water flow to the steam generator is equivalent to about 20,000 gallons per minute. An Olympic swimming pool holds about 600,000 gallons. At maximum capacity the Zimmer steam generator will evaporate the equivalent of two Olympic swimming pools full of water each hour and heat that water to steam at over 3,845 pounds per square inch and 1,000 degrees F. The single turbine driven boiler feed water pump is powered by a 50 MW (67,000 Hp) steam turbine which is about as powerful as all the power consumed on a hot summer day in my old town (about 20,000 people) in Albemarle, NC. Fifty Megawatts is the power to drive just the feed water pump.
These are a few reasons why I consider Zimmer to be a magnificent Heat Engine. An excerpt from the POWER Magazine 1993 feature article is copied below.
Nuclear Power Generation
The Oconee Nuclear Plant is another example of Thermal power generation. Allow me to also call this a heat engine. Three units with a total capacity of 2,554 MW. The illustration below is from the Duke Energy Fact Sheet.
This three unit nuclear powered “Heat-Engine” is about twice as large in total output as the Zimmer Coal Plant discussed above. Expressed as Horsepower, the three units together represent the equivalent of over 3.3 million horsepower.
Both the Zimmer and Oconee plants utilize the Rankine Steam Cycle.
Natural Gas Turbines
Modern gas turbines used for power generation are referred to as “Aeroderivative” Why? Because the gas turbine technology used is derived from jet engine designs. I wrote on the history of power generation in a previous article here. Two engineers, one German and one British are credited with the invention of the jet engine which came to be in the mid 1930’s. The first gas turbine application to power generation is generally thought to be by General Electric at the Belle Isle Station in Oklahoma, about 1949. The simple Gas Turbine single cycle is called the “Brayton Cycle”. An illustration of a modern Gas Turbine is shown below.
The generator is not shown in the above illustration but it will be similar to the generator shown above at the Zimmer coal plant. The point is that heat energy is used in each example thus far. For Zimmer coal is used to generate steam supply to power steam turbines as prime movers. Oconee uses nuclear fission to provide the heat to generate steam for the steam turbines there. Both use the Rankine steam cycle. The gas turbine shown above utilizes the Brayton cycle to create hot gases that flow through the gas turbine as the prime mover for the generator shaft.
Gas Turbine Combined Cycle Plants (GTCC)
One of the major advancements in the last twenty years or so has been the commercial application of gas turbines and steam turbine cycles working together. That is using both gas turbines with a shaft connected to a generator and then exhaust heat recovery of the gas turbine in a boiler to generate steam to provide a steam supply to a steam turbine which is the prime mover of a second generator.
By combining the gas turbine and steam turbine cycles, a much greater overall efficiency can be achieved. Modern GTCC plants achieve up to 65% thermal efficiency.
The plant below is 697 MW capacity. Fueled by natural gas.
The GTCC plant electrical output of 697 MW is equivalent to 927,000 Horsepower.
Summary
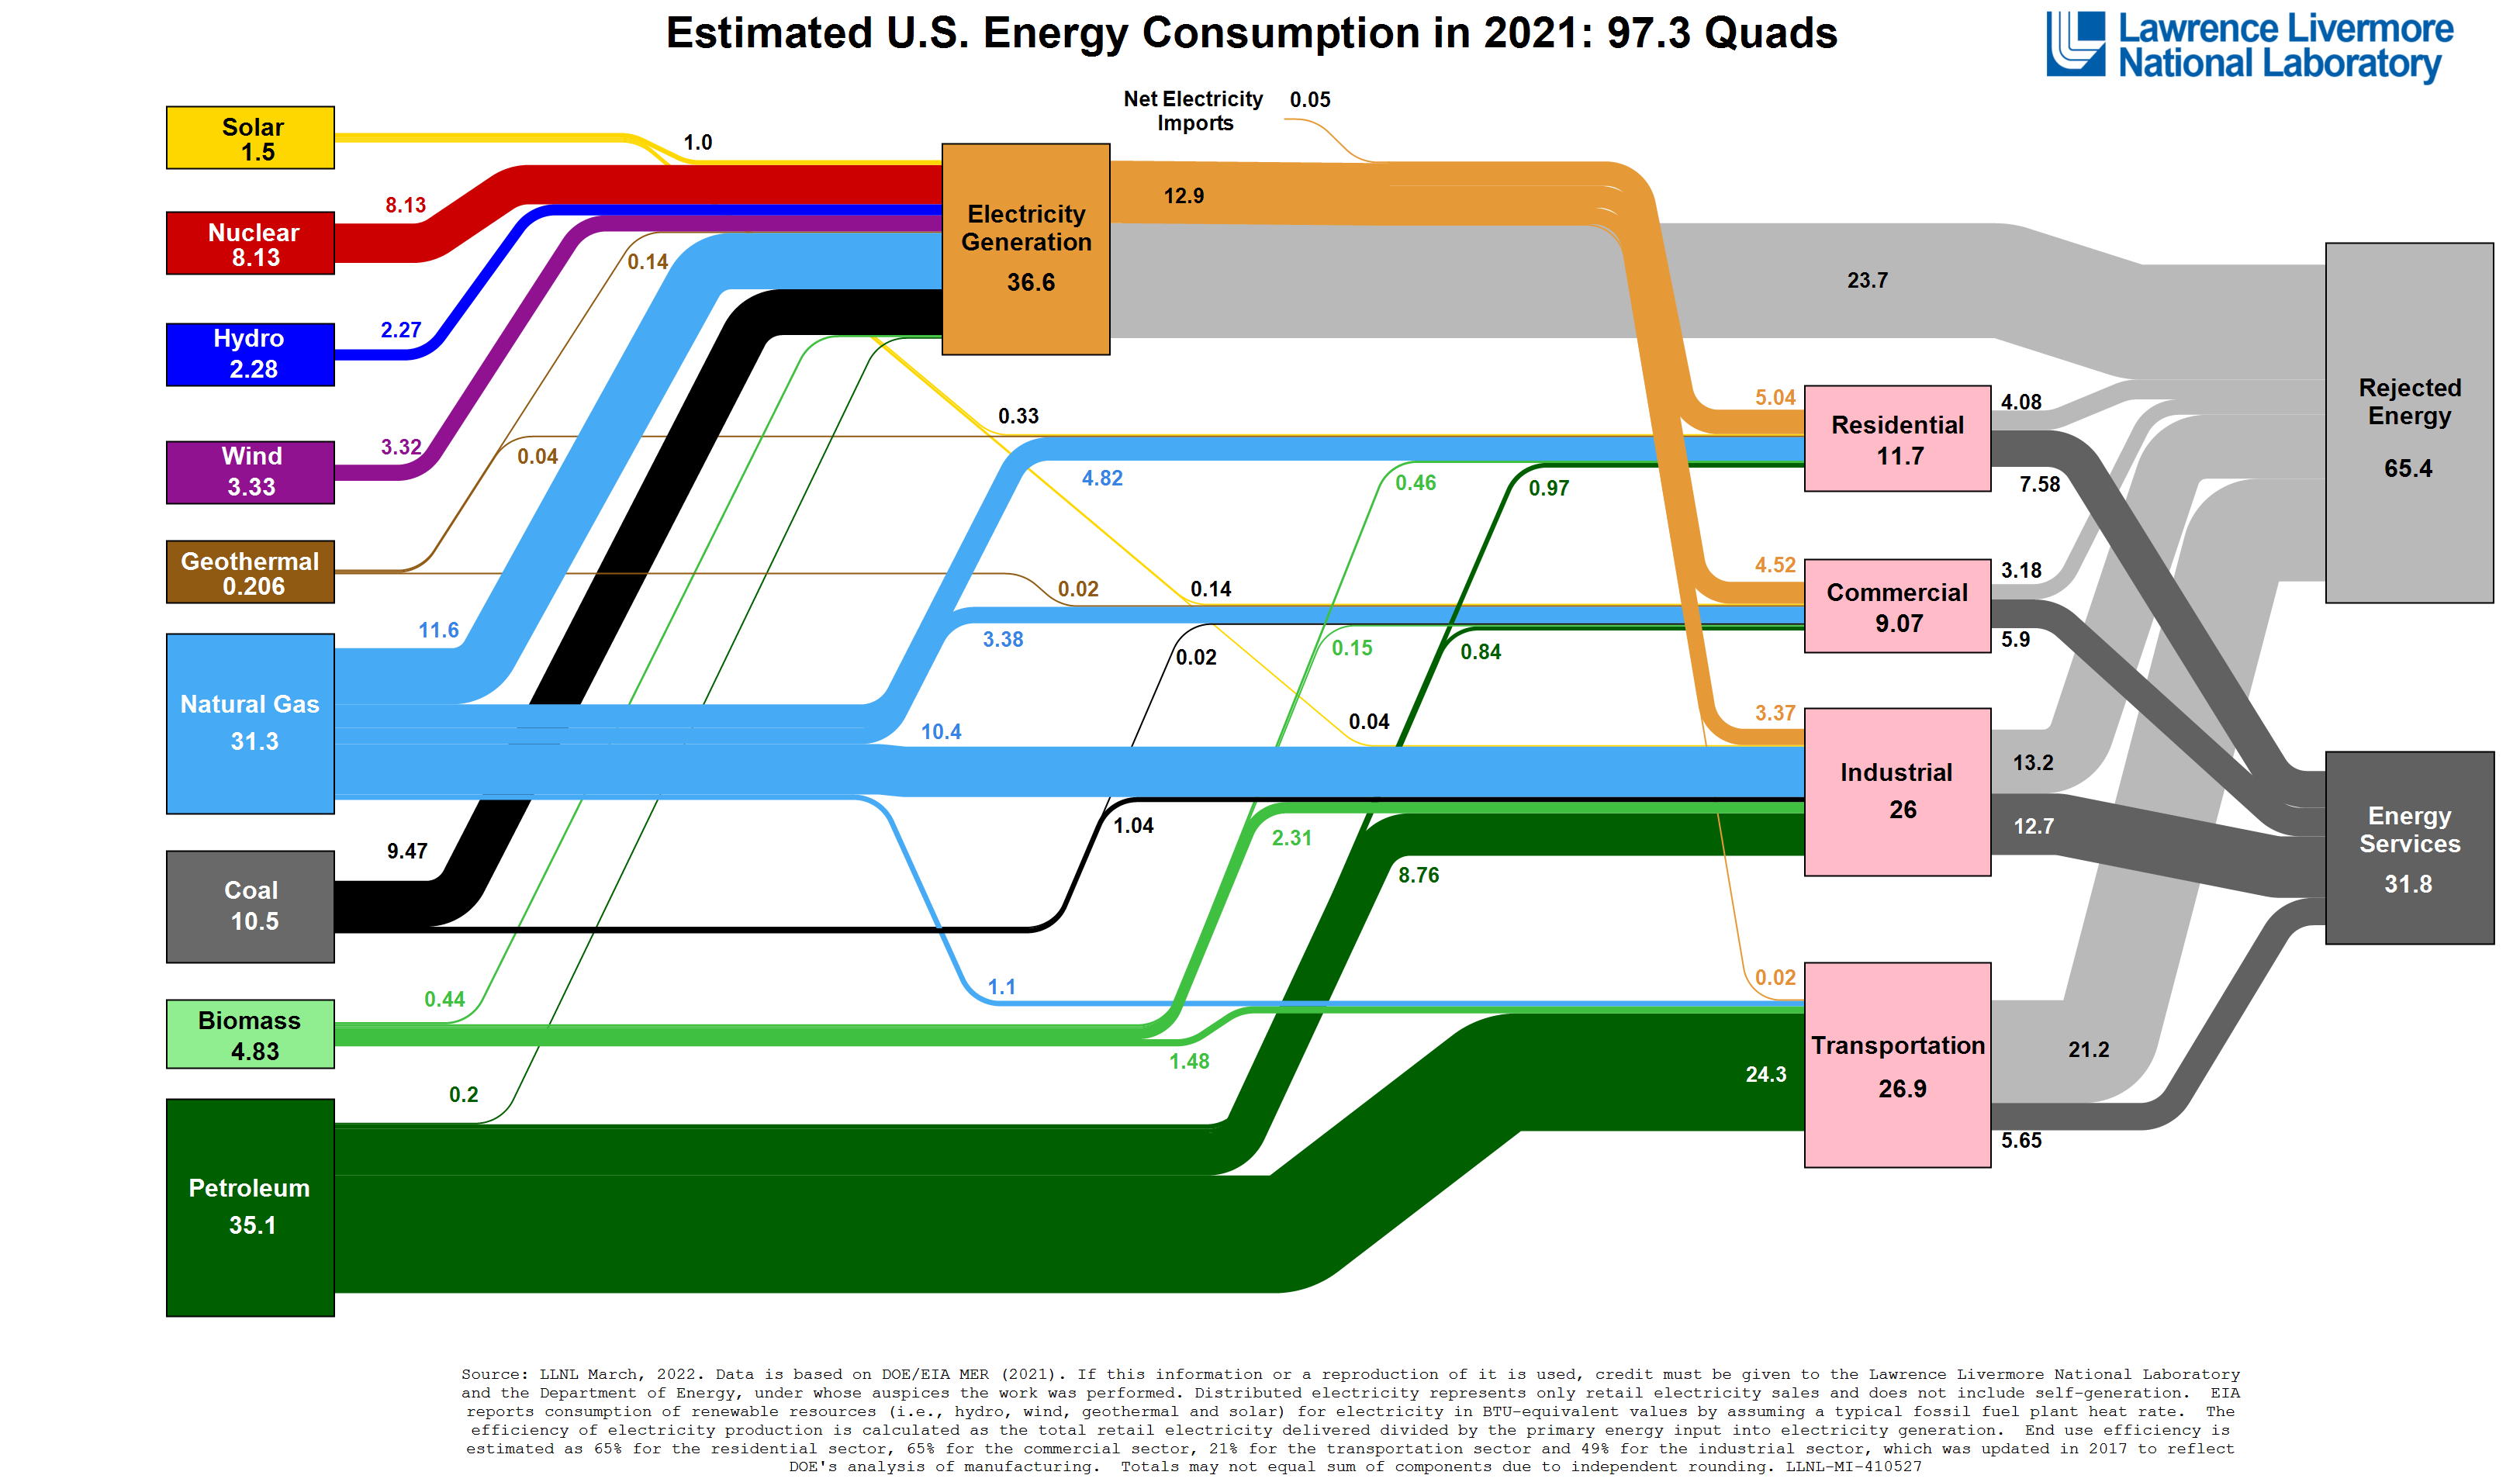
Heat engines power our lives and very little is stated in the Main Stream Media about the importance of conventional energy. Especially, Thermal Energy. In fact, if anything is written or discussed on TV, the MSM demonizes carbon and thermal power. This article is an attempt to explain the immensity of electric power generation systems on which we depend. There is a war to abolish fossil fuels which provide about 80% of the fuel needed to power our lives. This is best shown on the LLNL Energy Flow Chart below. Yes, it is expressed in BTU’s (British Thermal Units) and each BTU is equivalent to 778 foot pounds of work which may have been accomplished by muscle power 150 years ago, but now many politicians and leaders seem to have forgotten what conventional energy has made possible. The Zimmer plant and many other fine coal plants are being decommissioned and most demolished, without replacement of similar reliable, affordable generation capacity. I wrote on this before, here,here and here. So have many other people and respected organizations that understand generation by conventional fuels. Some references of these others are included below.
The 2023 LLNL Energy Flow Chart is not yet available. The most recent is for year 2022, shown below. Yes, 100.2 Quadrillion BTUs and only 4.96% of this Primary Energy was provided by wind and solar. This after decades of subsidies. Anyone that thinks wind and solar can replace the 92% conventional energy sources by 2030 or even 2050 are delusional. I wrote a previous article to discuss the “Impossibility of Achieving Net-Zero Carbon”. Then the Hawaii early adoption of the “Green New Deal” became public information. Hawaii is an “Energy Island” situated geographically with plenty of sunshine and wind. Their experiences with renewables has been very expensive and at reduced reliability. You can read more on the Hawaii experiences with renewable power here. Why? Hawaii is the perfect experiment to “Transition” to renewables with no Grid connection. Therefore, the availability, affordability and practicality is a perfect science experiment. Does anyone think electricity costs of over $0.40/kWH will improve the lives of Americans? Improve our economy and world competitiveness of manufacturing? I think not. EIA electricity costs by state here.
Americans use between 833,000 and 1,000,000 BTUs of energy each day to sustain our quality of life. There are some misguided leaders and politicians that are on a path to destroy the magnificent prime movers that power our lives.
Do you remember this poem from 1948?
First They Came, by Pastor Martin Niemoller
First they came for the Communists And I did not speak out Because I was not a Communist Then they came for the Socialists And I did not speak out Because I was not a Socialist Then they came for the trade unionists And I did not speak out Because I was not a trade unionist Then they came for the Jews And I did not speak out Because I was not a Jew Then they came for me And there was no one left To speak out for me.
The environmental activists and Democrats in the U.S. have an anti-Carbon policy that has nothing to do with protecting human health or the environment. It is an agenda for one world government and control of our lives. We could paraphrase Martin Niemoller’s poem with the words….“First they came for Coal”. Trust me friends, the Biden-Harris and Democrat Party Climate Policies are NOT based on protecting your health. The (D’s) hate fossil fuels, including natural gas. The U.S. is on a path this year, to depend on about 50% (interruptible pipeline supplied) Natural gas fuel for power generation. I do not think this is wise. The Zimmer coal plant is an example of true “Energy Storage”. A coal pile plus, Coal barges tied up adjacent to the plant can provide weeks or months of Primary Energy storage. Pipelines are vulnerable to harm, whether accidental or malicious. Battery storage systems are for hours at best. Think about Grid Security and the many threats, within our country from Deep State Regulators (EPA, BLM and more) and Politicians, as well as from criminal minded foreigners. There are many threats to the energy supply to the country we love. Threats to your conventional energy powered lifestyle…..Please, THINK before you vote.
On enemies, Sun Tzu said “Know the enemy and know yourself in a hundred battles you will never be in peril. When you are ignorant of the enemy but know yourself, your chances of winning or losing are equal. If ignorant both of your enemy and of yourself, you are certain in every battle to be in peril”.(1)
Most of the American people have no idea of who the enemies of coal are. In fact, I worked in the coal power industry for about thirty years before I became aware of some of them. The true facts are, that there are multiple entities and organizations that are enemies. Let’s call them “Carbon Hating Tribes”. These Tribes include rogue Bureaucrats (alphabet agencies of the U.S. Federal Gov’t) politicians, Well funded NGO’s, Public education K-12 plus many Universities, Public Broadcasting, Billionaires who do not understand the importance of Domestically produced Primary energy, U.S. elected politicians, the United Nations, the World Economic Forum, the MSM, the Entertainment Industry, celebrities and foreign participants that wish to weaken the U.S.A. I tried to capture some of the prominent anti Carbon Tribes in one meme which I have used in my public presentations. Most of the leaders and the members of these anti-coal Tribes, are NOT elected by the U.S. citizens . I have written several previous commentaries naming some of the individuals and organizations. (6, 207, 208) A Congressional report also outlined the escalation of the war on coal during the McCarthy years at EPA in the Obama Administration. (10)
More on the influencers of Net-Zero Carbon before. Here,here and here. After years of observations from the industry and research, I am of the strong opinion that the priorities and goals of “Climate Policies” are really not about improving human health or saving the planet. Thomas Shepstone captured my thoughts in his Substack entitled, “Energy Matters If You Value the Life You Now Have and Don’t Want to Live Under Socialism” (210)
Those of us that understand energy and electricity generation are a small minority that I estimate at 3% of the population. The “Good Guys” that understand energy and electricity generation are vastly outnumbered and out shouted. The enemies of coal are also the enemies of Liberty, Freedom and Capitalism.
Are You Worried About the Future of the U.S.A.?
This excerpt from my previous blog post and it is worth repeating. This is from my commentary entitled, “Are You Worried about the Future of the U.S.A.?” I posted this the day after inauguration day, January 21, 2021.
“The November 2020 Presidential Election to put it politely did not end with the best interests of America as a priority. President Biden disingenuously said at the inauguration, that he wants to unite the country. Then he went to the Whitehouse to sign Executive Orders to Cancel the foundation of our economic growth during President Trump’s four years. He is in the highest office of the world and he has plans to use the power of that office to do as much harm as possible to America. I don’t know why the Democrat Party, Liberals & the Mainstream Media can be so hateful of America. But they are.
Their Goals seem to be to Dismantle America’s #1 Position in the world as a Beacon of freedom and to harm or kill the largest Economy on the planet. Biden’s first step to weaken the U.S.A. is to reduce Domestic Energy Production. Reasonable cost energy is a huge component of world manufacturing competitiveness. Abundant production of reasonable cost energy also creates and sustains “Jobs” too! To put it into in a four letter word Mr. Biden may understand.
I will be perfectly honest, I am concerned for the future of America. Here are some of the reasons why I am concerned…...”Continue reading on blog post here
Background of The War on Coal
I have followed the war on coal since the 1990’s and the enemies of coal have gained strength and political power. Now with a rogue, out of control EPA and Biden as President, they have near Totalitarian Control over the entire government. In fact, Biden’s #1 Priority is/are the bogus, “Climate Policies” which have weaponized all of the government swamp Bureaucrats and all alphabet soup agencies including the EPA, BLM, SEC, Dept. of Defense, DOJ and more. This is a War on the American people and America’s productive capacity. This is a war that we must win. I have completed presentations to groups and written on the beginnings of the war on coal since about 1995 when it first dawned on me that these people in the EPA are trying to kill coal. Yes, it started during the Bill Clinton Presidency when Carol Browner was EPA Chief, and was escalated with Obama. (See the 2015 Congressional report on the Obama Carbon Mandate(10) , Here. ) Up to about 2012 about 50% of our electricity was generated by coal fueled power plants and I thought it was inexplicable and not possible that the government would wage a continuing war on the American Treasure of coal. Since 2012 over 102,000 MW’s of reliable, affordable, Dispatchable coal power generation capacity has been shut down. I presented this at the ENERUM energy Forum in Columbus, OH in 2022. (215) A modern, new clean coal plant has not been built since 2013, yet hundreds have been shut down and Demolished. (11, 12, 13, 14, 215) The two photos below are typical of how U.S. Utilities dispose of coal plants. This one is Genoa #3 of Dairyland Power, near Lacrosse, Wisconsin. Yes, it was old, but it should have been replaced with a new coal plant. The other is the Duke Sutton #3 which I was the manufacturer’s lead startup engineer in 1972.
The U.S. Government is Choosing Euthanasia for our Energy & Electricity Generation Infrastructure. Why?
I saw a bizarre story in the “Free Press” about a perfectly healthy young woman that has decided to end her life. The article title: “I’m 28. And I’m Scheduled to Die in May.“I did not make this up, read it here in the Free Press. After a dozen years of watching Obama, Biden, Swamp Bureaucrats, NGO’s, the MSM, Entertainment and energy ignorant but wealthy celebrities demonize coal….the planned death of Zoraya ter Beek seems similar. The big difference is, Zoraya Ter Beek has made her decision by herself. The American people are having Euthanasia of our energy and electricity infrastructure forced on us and likely to cause economic harm, pain, suffering and deaths of our American citizens. Being done in plain sight, eyes wide open and the perpetrators have about 50% of the voters support. Wake up America!
So much for “We the People” having a say into policies that impact all of us and all that we do. (Note the meme above of energy policy influences, none were elected by the people of the U.S.)Think about loss of power, loss of gasoline availability and cancellation of public transportation. Loss of heating, HVAC, refrigeration and just about everything we depend on, including food production and distribution. Dr. Robert Hargraves wrote an excellent article on “Energy IS the Economy“. It is here in Grid Brief, Nov. 2022. I live in Hilton Head, SC. The last time I remember losing power and having gasoline shortages was Hurricane Mathew in 2016. It has been very easy for many residents to forget what loss of power meant for just a few days. In February 2021, Texas suffered a massive statewide Blackout. That was in winter and cold kills more people than summer heat. The Texas Blackout killed a minimum of 246 people. I predict that, If the EPA and the Biden Administration is not reined in, more people will die in the near future. Why? Because of Bureaucratically enacted and foolish Climate Policies. Keep in mind electricity supply is comfortably easy to sustain during the spring and fall months. The challenge is PEAK Demand periods in the summer and winter. Perhaps that is one reason the EPA and the administration release these excessively restrictive rules in the spring and fall? I wrote my commentary on “Threats to the Grid” last month. It is here. An excerpt of that commentary listing the ten largest threats to Grid Reliability follow. These are based on my experience and my opinion:
The top 10 “Threats” are ranked, with the greatest risks first. All of these risks could be mitigated if energy and environmental policies were in effect the same as they were in 2012 when the U.S. had amongst the cleanest air in the industrialized and Developed world. There is a lot of blame to be spread around, but these policies are threats to Grid reliability.
Government Agency Climate Policies, EPA at the top, SEC, BLM, DOD, DOJ and all of government is wrongly applying “Climate First” policies rather than the Best policies for America and younger Americans to experience the “American Dream” as my generation did
Creation of RTO’s that absolved most utilities from planning for future electric generation growth, ie, plants can be shut down without a Utility being required to replace it with like, Dispatchable generation
Environmental Extremist/Activists that use enormous wealth to demonize carbon (and support (D) politicians against the Best interests of the U.S.A.
Wealthy Business people who fund NGO’s to Decarbonize the western world
The United Nations IPCC, Agenda 21, Agenda 30 and other so called “Climate Policies”
The World Economic Forum and the members who under the guise of saving the planet are forcing policies of De-Growth, De-Industrialization and Energy Poverty on all of the people of the western world, but not the BRICS, and other countries aligned with Russia and China
“Woke” or “Politically Correct” companies including electric Utilities and Co-Operatives that espouse solar and wind power as being capable of replacing coal, oil, gas and nuclear energy
Public Education, K-12 and Universities that promote climate scare tactics to sway public opinion toward accepting higher energy costs and reduced reliability of energy and electricity
World Bank, IMF, Large Banking and Investment companies that determine which infrastructure projects to finance
Terrorists or criminal acts of sabotage When I first wrote this commentary, I placed terrorsists as last in the hierarchy of risks. Now, with millions of illegal immigrants from dozens of countries, some that are enemies of the U.S. Perhaps the priority should be higher. It is in fact, a risk to Grid reliability and Green Policies have made the Grid more vulnerable to attack.
If you are interested, here are three previous blog posts on the beginning of the War on Coal and the some of the individuals and groups that have been involved. Here,hereand here. The IER has prepared an excellent report which enumerates on the vast energy resources within America’s borders. (6)
The American Coal Council Letter to Elected Officials-May 17, 2024
Emily Arthun, President of the American Coal Council prepared a letter for supporters to sign and submit to Congress. The letter is copied below and I support Ms. Arthun’s comments 100%! I have submitted to my elected officials:
“Dear Senator Graham, Senator Scott and Congresswoman Mace,
As you know, the Environmental Protection Agency (EPA) recently issued a number of new regulations, such as the Clean Power Plan 2.0 (CPP 2.0), the Mercury and Air Toxics Standards (MATS), new rules around coal combustion residuals (CCR), and others that will have direct and detrimental impact on coal-fired power plants and the people that depend on them for reliable and affordable power. I urge you to hold agencies accountable for overreach and careless rulemaking which is intended to force coal plant closures and endangers the reliability of our electric grid.
Coal supplies affordable power when other sources cannot. It plays a critical role during times of intense demand, such as during cold snaps and heat waves, ensuring that the lights stay on and the grid remains reliable. According to recent reports, electric utilities have nearly doubled their forecasts of how much additional power they’ll need by 2028 given the torrid pace of data center development and other manufacturing demands that are putting new pressures on the grid. Despite the promise of renewable energy technologies, coal remains a critical energy source that must remain in use to prevent crippling energy costs to low-income families and to ensure energy shortages do not put unmanageable pressures on the grid.
The EPA has crafted a suite of rules specifically designed to force the closure of reliable and efficiently operating coal plants. These plants are the primary source of power generation in many states, and a significant source of grid-saving baseload power across the country. Further, the EPA issued these rules while conducting zero analysis of the collective impact of the new rules on grid reliability. EPA’s rules fail to account for the fact that electricity prices are increasing above the rate of inflation, demand is expanding, grid experts are already issuing warnings concerning plant closures, and there is no adequate replacement ready for the sorely needed, dispatchable generating capacity coal provides. Further shuttering coal generation will have a devastating impact to communities and our economy.
Thank you for considering my concerns, and I hope you will take swift action to support reliable and affordable energy for United States citizens and industry.”
I hope each reader will send a similar letter to your elected officials. The EPA and extremists are at War with the American People. We the People MUST win this final battle.
America is Blessed With Enormous Natural Resources of Critical Minerals and Including Coal, Uranium, Oil and Natural Gas. We Should Use them All!
Why would “We the People”...Not use the God given natural resources that America is Blessed with? A good question. My previous commentaries have expounded on the individuals, NGO’s, and others that have created the insane Net-Zero Carbon policies. Because I have written so much on this, I will not repeat my concerns and some would say, my rant. However, if you are interested, here are fourteen blog posts that attempt to show who and how the anti-American Climate Policies have come to be. The Biden Climate Policies must be reversed to win the War on America’s Productive capacity and the Best interests for the American People;
Remember the poem by Martin Niemoller to describe events leading up to the Holocaust? We could paraphrase and say: First they came for coal…..
FIRST THEY CAME
First they came for the Communists And I did not speak out Because I was not a Communist Then they came for the Socialists And I did not speak outBecause I was not a Socialist Then they came for the trade unionists And I did not speak out Because I was not a trade unionist Then they came for the Jews And I did not speak out Because I was not a Jew Then they came for me And there was no one left To speak out for me.
There is a parallel strategy by the enemies of coal. Today it is a war on coal, later they will (actually, they already are) attack natural gas and oil, your freedom of transportation, what you eat, how you cook and more.. Even worse, the forces against coal are also against the one zero carbon source of carbon-free dependable, Dispatchable Bulk Power, nuclear. The Sierra Club and other extremist NGO’s have been opposed to nuclear power. So, if it is not protecting human health or the environment, then what is their motive? My friend Thomas J. Shepstone has an answer in a Substack post we corroborated on titled, “Energy Matters If You Value the Life You Now Have and Don’t Want to Live Under Socialism“
Please Consider…..
Do yourself and all Americans a favor. If you already understand energy and electricity generation, help teach those that are not well informed. My estimate is that only about 3% of the American population really understands Primary energy, electricity generation and energy economics. Here are some examples of my attempts.(23, 30, 31)
If you are one of the 97% that does not understand energy and electricity generation, (or have been indoctrinated to demonize carbon) please ask me or anyone else who does understand energy to please take time to explain how government policies and cultural indoctrination has placed America on a path of self destruction.
Yours very truly,
Dick Storm, May 18, 2024
If you are interested in digging down for more research, then here are hundreds of references to support my claim that the EPA and Environmental Zealots have America on a Net Zero Path to Destruction:
The Great State of South Carolina is usually thought of as a “Conservative” state. However, when it comes to applying destructive “Climate Policies”, South Carolina is no more conservative than is California or New York. So, I thought I would repost my comments on the Santee-Cooper IRP.
It is my understanding that the major Utilities providing electricity to S.C. (Dominion Energy and Santee-Cooper) are planning to build a major natural gas fueled power plant at the site of the old Canadys Coal Plant, near Walterboro. I posted my thoughts on this on LinkedIn, here. Also, Thomas Shepstone created a Blog post on substack based on my LI post, entitled, “”A Balanced Energy Portfolio is Critical but South Carolina Doesn’t Seem Get It” . It is here. Thank you Tom!
Since this article was first published, announcements of new Data Centers and increasing EV charging has caused alarm that more generating capacity will be required than what was thought a year or two ago. Imagine that, when policies to “Electrify Everything” are applied, electricity Demand grows…..(23, 25 )
This is an update on my comments to the IRP development for my local Regional Utility, Santee-Cooper. The last draft IRP has been published for comment and the figure below shows the expected load growth up to 2042. This Figure is from page 28 of the IRP presentation updated in April 2023. Shockingly, there is serious planning to shut down all coal plants by 2034 without having a Balanced Portfolio of replacement Bulk Power Supply that is Dispatchable, affordable and of reliable supply. Some energy news/issues authors, when discussing energy policy, speak metaphorically of “Falling off the Cliff” The illustration of projected load growth for Santee-Cooper is an example of planning to “Fall off the Cliff” by (NOT) Balancing Bulk Power Supply & load Demand. (The graph reminds me of the old saying, “Failing to Plan is a Plan for Failure”. How? By not providing adequate new generation capacity as older, reliable, dependable and Dispatchable coal units are retired. This is typical all across the U.S. and the western free world(6,10,14,15,15,17,18,19,20,21,22,23,24,25,27)
I had hoped that the more conservative, level headed General Assembly of S.C. would have better sense than to follow the “Woke policy” of the U.S. government and other states. There is still time to wake up to reality. (5,8)
The slide below is from my ENERUM presentation, August 2022. Data and chart are from the July 2022 NERC Report.(10) This shows 102 GW of Dispatchable & Reliable coal and nuclear plants shut down since 2011. This is shown to illustrate the fact that Santee-Cooper seems to be following the same destructive path as other utilities in the U.S.
Can a Great 80+ Year Record of Reliability and Affordability be Sustained While Retiring Coal Plants? Is S.C. Self Sabotaging our Great Record of Reasonable Cost, Reliable Bulk Power Supply? Why? Can the Legislature Stop the Madness?
It is my understanding, that the management of Santee-Cooper has been directed to formulate a plan to achieve Net Zero Carbon by 2050. Anyone that knows me, knows that I do not agree with this plan and my posts on this blog and my public presentations have clearly shown my analysis of the madness of Net Zero Carbon & the War on Coal. I have written letters to Santee-Cooper, the Governor, Congressional representatives and my S.C. Senator. Most of these have been made public. Myself and others that have knowledge of energy and electricity generation know that the path to Net Zero carbon is not possible by 2050.(4,5,6,7,8)Not without severe disruption of our way of life, our economy, industrial output, controlling inflation and national security. It is important for our state to generate electricity reliably, with high quality frequency and voltage control, from Dispatchable generators to meet customer Demand and do this 24/7 affordably under all weather conditions…..This has been done by Santee-Cooper for almost 90 years. Thanks to the reliability of coal, nuclear, natural gas generation and hydro-electric. Why would the Legislature force this fine Utility to sabotage its great record? The chart below is from the 2020 IRP. This lists the Dispatchable, Reliable, Affordable generating assets that have created and continue to provide a great record. In essence, the apparent path of the IRP update is to replace 61% of the reliable coal generation with “Intermittent” solar and wind generation.
Path to Jeopardizing S.C. Bulk Power Affordability, Reliability and Dispatchability
The S.C. Legislature has directed Santee-Cooper through “Act 90” to meet a net zero carbon goal by 2050.
The slide above is copied from the Santee-Cooper IRP presentation. My understanding is, that this is the direction ordered by the legislature. A plan to achieve Net Zero Carbon by 2050. (22)
There is active planning to not only shut down the 1,150 MW Winyah coal plant in 2028 but also to shut down the 2,350 MW Cross Coal plant about five years later so that in 2034 all coal plants will be shut down. This is shown on the slides below. Shutting down all coal plants by 2034, in my opinion, will jeopardize the very favorable record of reasonable cost, reliable and Dispatchable electricity Bulk Power Supply that has become associated with Santee-Cooper’s great reputation. Even more importantly, South Carolina’s excellent record of attracting and keeping a thriving industrial base within this region. Electricity intensive industries such as aluminum and steel manufacturers/Recyclers have thrived here as manufacturers in other states have ended operations and ceded U.S. manufactured steel and aluminum capacity to China.
Let me digress and quote Vaclav Smil’s statement on decarbonization. From Professor Smil’s book, “How the World Really Works” This applies to S.C. Too!
“The real wrench in the works: we are a fossil-fueled civilization whose technical and scientific advances, quality of life, and prosperity rest on the combustion of huge quantities of fossil carbon, and we cannot simply walk away from this critical determinant of our fortunes in a few decades, never mind years. Complete decarbonization of the global economy by 2050 is now conceivable only at the cost of unthinkable global economic retreat, or as a result of extraordinarily rapid transformations relying on near-miraculous technical advances.” Smil continues….
But who is going, willingly, to engineer decarbonization while we are still lacking any convincing, practical, affordable global strategy and technical means to pursue the latter? What will actually happen? The gap between wishful thinking and reality is vast, but in a democratic society no contest of ideas and proposals can proceed in rational ways without all sides sharing at least a modicum of relevant information about the real world, rather than trotting out their biases and advancing claims disconnected from physical possibilities.”
I have written other posts on this Blog to express my thoughts on competition with China and the importance for America to reshore U.S. manufacturing. This my friends, is in our backyard, our neighborhood, our state. This is a fact as stated above10). Premature retirements of reliable coal plants has been occurring at an alarming rate all across the U.S. Do we have to follow the same foolish self sabotaging policies of NY, Hawaii, Germany, the UK and Texas? I hope not. (12,13,14,15,)
Future Bulk Power Generation Capacity, The Apparent Plan to Self Sabotage Reliable Bulk Power Supply
Expected Outcome of Adding Over 4,250 MW of Non Dispatchable, Intermittent Bulk Power Supply
If all of the coal plants are retired and the portfolio shown above is used. Her are my predictions, based on the experiences of Hawaii, California, Texas, Germany, Denmark and the UK.
California is thought by some in government to be a model for the U.S. with regard to renewable energy policy. I do not agree. Here is a recent post by the CEO of the Electric Power Research Institute on how the California electric load (as reported by CAISO) has morphed from a “Duck Curve to a Canyon Curve”. Here is a screenshot of Dr. Mansoor’s post:
The “Canyon” curve represents high renewable generation during the peak sunshine of the day where California has bragging rights to sourcing almost all of their electricity from solar collectors. This is great until folks come home from work, mom starts dinner in her totally electric home and Dad plugs in his EV for charging. By early evening, electricity demand skyrockets out of the Canyon and must, for the sake of reliability, be generated to meet demand from Dispatchable sources.
Battery storage is not Bulk Power Supply. Batteries store electricity they do not generate electricity. Batteries are capable, depending on the size of the installation, of providing minutes or hours of backup. The largest battery storage in the U.S. is the Vistra Energy, Moss Landing facility in CA. The CAISO load for April 27 is expected to be about 30,000 MW. Note the largest battery storage facility in the world, Moss Landing, is 1600 MW which is about 5% of the Demand and only capable of providing minutes or hours of stored electricity.
Here is another post from another energy expert on LinkedIn. This graphic shows the electric generation through the day which includes battery storage.
The Moss Landing Storage facility is rated at 400/1600 MW and is capable of storing excess renewable generation for hours so that it can be used as the sun sets and kick in as the “Canyon Curve” and CA power supply and Demand Curves above become reality of demand. Emphasis should be on “Hours” it is not capable of backup during a days long cold severe winter storm, such as NC and SC experienced over Christmas week, 2022. Another example is the 150 MW Battery storage designed for Queensland, Australia and an artists depiction below. This is from an essay reviewing the NY electricity future written on the Blog, Watts Up With That.
Battery storage such as shown above is very costly. For example, the 150 MW facility above is projected to cost $250/kWh. Therefore for 12 hours of storage for 450 MW, the cost would be about $1.35 Billion dollars. Keep in mind, this is for 12 hours storage of only 450 MW of power. Winter storms such as the Christmas 2022 storm lasted longer than 12 hours and even very conservative, steeped in energy expertise Duke Energy, also with a great reputation for reliable electric service, had rolling Blackouts. Ditto for TVA(18,19,20,21,22,23).
When the sun is not shining and the wind not blowing, then the generation must be purchased from neighboring Utilities or generated with Dispatchable natural gas generation. The plan shown above includes 4,316 MW of natural gas generation. This combined with the 322 MW of Summer Unit #1 nuclear power totals 4,638 MW. The wind generators, though intermittent, could generate another 400 MW to total 5,038 MW. The projections of up to 9,000 MW Demand in 2050 (according to Santee-Cooper projections) then will require additional Dispatchable generation which is likely to be natural gas CT’s or Combined Cycle facilities. Think for example of the uncertain growth of Electric Vehicles. If much of transportation is “Electrified”, then the high range projections of about 9,000 MW peaks can be expected in 2050 or before. So, why would we kill the coal plants that have served South Carolinians so well?
This reminds me of my experiences working for CP&L in the 1970’s when the manager of Fossil Plant Engineering pointed to an oil fueled CT and proclaimed to me, then a young engineer, “That young man is a monument to poor planning”. Yes, as CP&L (That was before CP&L merged with Florida Progress and was later absorbed by Duke Energy). I see history repeating here as so much faith in renewables today is somewhat like the high expectations of nuclear being “Too Cheap to Meter” beliefs of the 1970’s. However, nuclear power eventually delivered. Wind and solar are not capable of replacing coal, nuclear and gas fueled Bulk Power Generation. In the 1970’s the Bulk Power Supply gaps were made up with quickly installed, oil fueled CT’s. Today, thanks to reliable, affordable natural gas, the backup generation, when solar and wind cannot deliver, is gas fueled CT’s or Combined Cycle plants. This is doable and satisfactory… providing that pipelines are of adequate capacity and natural gas remains affordable and Federal Regulations on drilling, Hydraulic Fracturing, pipelines and fuel supply infra-structure is expanded as needed, when it is needed. The Federal Government is wrong on their war on carbon and the natural gas resources just may not be as abundant in 2040 or 2050 as they are now. Because, the Federal Government currently highly regulates exploration, drilling, production and transport of any fossil fuels. The uncertainty of future primary energy supply is why a Balanced Generation Portfolio is important. A Balanced Energy Portfolio will include nuclear, coal, gas and renewables.
Have the Importance of Reserves Been Forgotten?
Santee-Cooper is a Regional Utility. In other states, such as PA, OH, WVA, NJ & DE many utilities the size of Santee-Cooper have joined RTO’s (Regional Transmission Operators) such as the PJM Interconnection. In the Midwest it is MISO (Midwestern Independent System Operator) With RTO’s, the electricity generation is shared across state lines and with different utilities with separation of the ownership of the generating plants and the transmission and distribution of the Bulk Power. This has eliminated accountability for individual utilities such as Philadelphia Electric, Potomac Electric Power Company, Public Service of NJ, PP&L and others to plan for Reserve Generation capacity. Therefore, there is no accountability for lack of reserves. I presented examples in my ENERUM talk slides(6) . There is some talk of Santee-Cooper joining a similar RTO with the Southeast Electric Exchange. In my strong opinion and based on the references listed below and my experiences, Santee-Cooper should plan for their own (Our own) reserves. Reserve generation from others states was depended on Christmas week 2022 by TVA and Duke Energy. Two fine utilities, also with great records from the past. But, the reserves from neighboring states were not available due to Demand exceeding supply. Reserves of 15-20% have always been important for reliability and to keep generation costs reasonable by not requiring the startup of backup power generation using high cost fuels such as Diesel or spot market gas. Donn Dears has written several books on this. Here is a graph from the book, “Clean Energy Crisis”, on the Reserve generation that was planned in 2018. However, Texas Blackouts in 2021 killed over 200 people. The ERCOT planners in 2018 had performed due diligence as Santee-Cooper is doing now with well respected consulting services to perform computer analyses of planned reserve margins. Do we need to learn the hard way as Texans did in 2021?
Facts to be Consider regarding Electricity and South Carolina’s High Quality of Life
The experiences of other states and other countries should be considered. I cited the examples of California, Texas and Hawaii above. Much analysis has been put into the planning by some very smart engineers and planners. However, computer modeling of the “Future” weather, fuel prices, EV use, population growth, industrial growth and other uncertainties, will likely create a need for other sources than wind and solar renewables. Just as Texas learned in 2021 after performing similar planning.
Primary Energy and Secondary Energy
Each S.C. resident on average uses about 300 million Btus per year in Primary Energy. If the trend to “Electrify Everything” continues, then more of the energy use currently provided at reasonble prices for transportation and our high quality of life, will be substituted for by (Secondary Energy) electricity or hydrogen. Such as more EV’s as the government is forcing us to use. Therefore, the growth of electricity demand may be much greater than expected. Thus, my title which relates to potential 9,000 MW Demand in 2050.
Over 50% of South Carolina’s electricity has been provided by nuclear power for decades. SC is rated as #3 in the nation in nuclear power generation. Nuclear power has served SC citizens and industry well. Safe, affordable, Base load capable at 90+% capacity factor and proven. However, the great record and importance of nuclear is not discussed by politicians or even utilities. For example, Palmetto Electric promotes the use of “Green Power” when in fact, it is a small contributor to the total portfolio of power generation. Here is an example of “Green indoctrination” by a bill insert that misleadingly leads citizens to believe that most of their power is from renewables:
The reality of our future electricity generation is that nuclear is the most important and least carbon intensive fuel for electricity generation. The plan to expand the Summer nuclear plant with two additional units was a very good idea. However, it was not to be because of poor management, limited trained talent and failure by Bankruptcy of Westinghouse, the primary contractor. The planned new Pee Dee coal plant near Florence was also a good idea and provided for natural growth of generating capacity to meet Demand. Pee Dee, (600 MW coal plant) in my understanding, was killed because of outside influence of Environmental Extremists. Had the Summer Units 2 & 3 and the 600 MW Pee Dee Clean Coal Plant been built as planned, then together these three units would have provided 2,800 MW of Base Load plus reliable, affordable and clean, Dispatchable Bulk Power. Including some reserve generation capacity.
Is the Great State of South Carolina going to sabotage our future just because other countries and states are doing so? I hope not.
Conclusions
The“War on Carbon” is based on politics and corrupted science. It is about Socialism and not about protecting the environment. The South Carolina Legislature seems to be just as gullible of the green myth as the current Federal government leaders.
The UN-IPCC is also Politically Driven and Not based on protection of the environment or to provide for the best interests of the people of the world. The Paris Climate Agreement is not in the best interests of America, the free western world or even for protection of the environment. It is politically motivated.
The path to Net Zero Carbon is steadily weakening our country. It will eventually destroy America’s productive capacity, lower our standard of living and place national security at risk. It will hasten the decline of America and the Rise of China.
America requires 100 Quadrillion BTUs of energy each year to sustain our quality of life. This is about 300 million BTUs per person, per year. Currently, after decades of subsidies, wind and solar provide about 5% of the total PRIMARY energy we use. Wind and solar cannot replace the other 95% of energy we need.
A Balanced Portfolio of Generating Capacity as is currently installed at Santee-Cooper generating plants, is the best path forward to sustain our high quality of life and economic prosperity. Reserve generation from dynamic generators is needed. Battery backup does not provide the same system voltage and frequency control as spinning reserve generator rotors do.
Electric generation planning in the 1970’s and 1980’s was better than today. There is no Energy Policy in America, there is only a decarbonization plan(4,5,6,7), there is no well thought out plan to replace the reliable and dispatchable generating capacity that is being shut down across the country. As during the 1970’s when nuclear units were late coming into service, the quickest available generating capacity was to install gas turbines. This is likely here in SC if the coal plants are retired before Dispatchable or Base Load replacement generation is installed.
Recommendations
Initiate a comprehensive Energy and Electricity Education program to provide 1. public education on energy, 2. Public School education on energy and electricity generation and 3. Public Technical/Trade School education to prepare youth for the construction workforce. Energy Education is recommendation #1 of the path forward. Public education is needed to reverse the myth that wind and solar can replace coal, gas and nuclear power generation. This is priority #1 because so many people are “Green Energy” indoctrinated.
Plan and continue to provide adequate Operations and maintenance funds for repairs and component replacements of the boilers, pumps, turbines and all of the equipment installed at the Cross Coal Plant. Keep the full 2,350 MW capacity so that it can be used until replacement generation is built and proven.
Construct the two unit 1,200 MW Pee Dee Coal plant that the components were purchased for in 2009, but never constructed.
Plan and begin construction on at least 2,000 MW of nuclear capacity. (as was planned for the Summer Units 2 & 3). Please re-read recommendation #1 above.
Plan and construct at least 1,750 MW of combined cycle gas plants
The coal, nuclear and gas plants 2,3 & 4 could replace the existing Cross coal plant capacity, thus continuing a “Balanced Generation Portfolio”
Summary
South Carolina can be an example of applied Common Sense Energy policies that can be a model for the U.S.A. and for the world. The current reasonable cost electricity in SC is amongst the lowest cost in the nation. Over 50% is generated from 4 nuclear plants with seven units. Four of these 7 nuclear units started up in the 1970’s. These four units operating licenses will expire in the 2030’s. They may be extended for another 20 or 30 years by the NRC but, plans should be made to construct new nuclear units for replacement of carbon free, Dispatchable, reasonable cost electricity.
Every time I present a course on energy and electricity generation the comments come back, “You did not discuss Climate Change and Decarbonization”. My response is, I am not an atmospheric scientist. I am an experienced power engineer. My beef with the current path toward Net Zero Carbon is, there is not an organized plan to replace the vitally important electric generation that has kept our country strong. If the politicians were really serious about reducing carbon dioxide emissions and “Sustaining” our high quality of living, then nuclear plants would be on a fast track to construction. After the Summer 2 & 3 failure, SC politicians are rightfully concerned about the financial risks. Plant Vogtle in GA is an example of a major budget overrun. Last cost estimate that I saw shows that Vogtle will cost $34 Billion and the original planned cost was less than half the ultimate cost. Also, it took ten years to just get one of the units running.
In my opinion and research, I feel the war on carbon is a plan initiated by the U.N. (including competitors/enemies of the U.S.A.) and Socialists that have an agenda other than clean power generation. If we wish to “Sustain our high quality of life“, then we need a reasonable cost, abundant and reliable electricity supply. Nuclear is the most accepted approach to achieving that goal. Three examples of applying a Balanced Energy Portfolio with a high percentage of nuclear are S.C. (1970-2030), Sweden and Finland. For research into why I believe the “War on Carbon” is political, not environmentally driven, I have included dozens of references below. My concern for Santee-Cooper and for America is to keep our Bulk Power Supply safe, secure, reliable and affordable. Also, sourced from a U.S. Supply-Chain.
The Supply-Chain of all of the future generation equipment, in an ideal scenario, would be from U.S. sources. Including manufacturing and construction talent. The workforce education is a weakness that I believe had part in the $9 Billion dollar Summer 2 & 3 construction debacle. We should learn from the past 50 years of electric generating history. The successes and the failures.
Respectfully submitted,
Dick Storm
References: (there are two sets of references below, SC Specific are second set)
Arshad Mansoor, CEO of EPRI (Electric Power Research Institute) LinkedIn post, April 25, 2023 on the CAISO System. EPRI Post on the CAISO “Duck Curve changed to Canyon Curve” of Electric Load: https://www.linkedin.com/posts/activity-7056612841755181056-SCPK?utm_source=share&utm_medium=member_desktop
In My opinion and research, the Path to Net Zero Carbon is Based on Corrupted Science and Political Ploys to Promote Socialism and One World Government, Not to Save the Planet or to Improve the Environment. Therefore, to substantiate this claim the following references are provided:
Conventional fuels, including coal provide most of the power needed to sustain our high quality of life. During 2022 coal use in the world reached a new high and provides the fuel for about 35.4% of the world’s electricity generation. Asia’s electricity generation was 82% from coal fuel in 2022(40, 41)
Meanwhile, the current U.S. government policy, green religion, renewable energy policies and crushing regulations are geared toward electrifying everything. Including transportation. The emphasis on phasing out internal combustion engines for autos is well publicized. This outlawing without Congressional action of internal combustion engines in spite of the majority of Americans desire to keep gasoline and Diesel powered vehicles seems unlawful to me? Then, on Good Friday Biden’s EPA issued new rules on electrifying heavy trucks. The EPA is out of touch, not only with their purpose of protecting human health, but also with Physics, Thermodynamics and Reality. The Demand for electricity is increasing because of increased use by Data Centers, EV’s and the natural organic growth of electricity as people of the world are lifted from poverty.(60) The surge in EV Demand has not really been felt yet because EV’s are still a small percentage of the total U.S. vehicle fleet.
The EPA is on a mission to kill coal plants regardless of the harm to our country, it is a rogue government agency, staffed by extremists, guided by extremists in the Biden Administration that are using the regulations as a weapon against the Best interests of America and the citizens. (1, 2, 3, 4, 5, 6) America needs to use all fuels which are within our borders and including coal. America is the Saudi Arabia of coal and has the highest quality & richest coal deposits on planet earth. We should use this God given Primary Energy Treasure to keep America strong.
The lure of billions of dollars in tax subsidies has made otherwise well run organizations and corporations to become “Woke & Green Biased”. It is extreme fantasy to believe that wind and solar can power the economies of Developed Countries. Yet, policies of many otherwise well run companies and organizations, even when they employ well trained and experienced engineers that know better, promote the “Green narrative. One example of this green wokeness is the “PowerGen” Conference. This conference was one of my favorites and I have been a presenter for decades since the 1980’s. In January I was asked by a Utility engineer friend, Mark Barton, along with two other senior power engineers, Frank Mitchell and John Grusha, to serve on a panel. The title of the Panel: “Legacy Perspective of 100 Years of Power Generation Experience”. I wrote my take aways here. (35) Frank Mitchell, retired from AEP and now active as an independent consultant also has published many technical papers on power generation. One entitled, “Analysis of Variable Renewable Energy and Reserve Margins” is available from the ASME. (36) Suffice it to say, the panelists involved do not agree with the Net-Zero Carbon path our country is on. We are not alone.
Also hard to understand is the well respected POWER Magazine embracement of renewable power to “Electrify Everything”. Here is an excerpt from this month’s POWER Magazine. This is written by Matt Helgeson, head of Sustainabilityfor Siemens USA.(8) He also should know better.
“The “electrification of everything” is
underway to not only decarbonize,
but also support optimized, safer and
more resilient processes and systems.
This concept means that we are replacing
our fossil fuel economy with wind,
solar, hydro, electric vehicles (EVs), heat
pumps, and more. This transformation
will be made possible—at scale—with
the application of digital technologies.
However, the challenge arises to electrify
everything before the grid is fully “green”
if we are going to appropriately and effectively
address climate change.
From electrifying buildings and vehicles,
and navigating the impact to the
grid, the technology to accomplish a fully
electric transformation is available today.
And now’s the time to utilize these technologies
to ensure that everything that
can be connected to the grid is electrified.
We’re running parallel races to transition
power generation to renewable sources,
improve the grid to manage those sources,
and replace infrastructure that’s ready
to use the power delivered to it.
Electrification of Transportation
An exciting and rapidly advancing industry
transformation is the electrification of transport.
According to Car and Driver, 2024 is
expected to set a new record for EVs sold
and their share of the total market. Further,
the EV market is projected to have a compound
annual growth rate of about 10%
projected through 2028, leading to more
than $900 billion in sales that year.
As the need to reduce carbon emissions
has become clear, we’re seeing
unprecedented support and funding from
the federal government to deploy EV infrastructure.
State and local governments”
Dick Storm’s Love of Power, Articles and Commentary in POWER Magazine….
POWER Magazine has been my favorite power generation magazine since 1959 when I was a teen and just beginning preparation for a career I loved in power generation. I was inspired by Steve Elonka’s fictional character “Marmaduke Surfaceblow” who was a “Globe Trotting Consulting Engineer” that solved power engineering problems around the world. I wanted to become an engineer like Marmaduke Surfaceblow. I pretty much succeeded in that goal. Thank you POWER for the inspiration! Later in my career I was a contributing editor to POWER Magazine where I shared the Storm Technology team’s experiences in improving combustion and efficiency. As recent as 2021, my commentary was published in POWER, which I still believe and stand behind. (9) Linked Here and it is a contrast with the Siemens commentary this month. A few other POWER articles I contributed are listed below in the references. (9, 10, 11, 12, 13, 14, 15, 16) I remain very proud of what I did to make a small contribution of helping generate reliable, efficient and clean coal power. Yes, I remain a friend of coal! And so should all Americans embrace coal, oil, gas and uranium use, all are fuels that are capable of being produced in the quantities we need from within our borders. More later on the need for 833,000-1,000,000 Btus per day/person to power our economy and our lives.
Reminder of the vast coal reserves in the U.S. and on the planet.
Getting back to the reality of Primary Energy and the sources of Primary energy that can meet our needs:
Meet Energy Reality
America uses right at 100 Quadrillion Btus of energy each year. This is likely to increase, that is if we maintain our high quality of life, over time. The IEA believes that with increased Data Center consumption, electricity growth will likely be over 3.4%/year. (67) Also, with more electrification, large new Data Centers, more EV’s and a growing population, Demand for electricity will grow. The entire world uses about 600 Quadrillion Btus of energy. These amounts of U.S. and world energy use are reported by numerous references. Amongst them, the IEA, EIA, Our World in Data and the Energy Institute. Most of the rest of the world is using coal. The greatest amount of coal ever used in history was the year 2023.
I have written on the 100 Quadrillion Btus that the US uses on a previous blog posts Here, Here,Here Here and Here(17, 18, 19, 20)
The “Count on Coal” Blog article quoting a conversation with worldwide energy expert, Daniel Yergin, sums up the energy transition very accurately. (27) Yergin’s comments are supported by the “Our World in Data” world energy use chart above and numerous other references included at the end. An excerpt from the Count on Coal Blog is copied below. The bold font and underlining is my emphasis:
“Renowned energy analyst and historian Dan Yergin recently observed that the world isn’t just using more coal than ever before but three times what it did in the 1960s. While Yergin recognizes significant changes in the global energy mix, he said, “I’m sick of the energy transition discussion. It sometimes loses touch with economic history and reality. If you look at the history of energy transitions, they all last for over a century. To try and make change happen in 25 years, or even half of that time is highly unlikely.”
For Yergin – and energy analysts the world over – the coal age has miles to run. The International Energy Agency (IEA) expects coal consumption in India and Southeast Asia to in fact “grow significantly.”
By 2026, the IEA expects just China and India together to account for 70% of global coal demand. Those two nations and Indonesia opened 59 gigawatts of new coal generating capacity last year. India has 85 GW of new coal generating capacity already under construction with more expected.
Both China and India are rapidly adding renewable energy but see coal as essential to helping meet rising power demand and view it as an energy security and reliability backstop. China is on track to add 200 GW of new coal capacity by 2030. For comparison, that’s more new capacity than the entire existing U.S. coal fleet.
As Dan Yergin observed, we need a better energy transition discussion. Globally, we remain firmly in an era of energy addition. Just ask China and India. “
Energy provides life as we know it
China and India are rising as economically prosperous nations and they are doing so powered by all available sources of energy, including coal.(33, 34, 65) We in America should do likewise. The last new highly efficient and clean coal plants built in America started up in 2013. We have not built a major coal plant in the U.S. in over twelve years. However, hundreds have been shut down without replacing the reliable, affordable and dispatchable generation capacity in kind. (28,29, 30, 68)
Electrifying Everything is Not Possible
To say Electrifying Everything is possible, is a ludicrous fantasy and a lie. More politely, but factually it simply is not possible. (25) For example: Ammonia, Food production, Steel, Plastics, Aluminum and Concrete all are dependent on vast amounts of Primary Energy for production. It is not an exaggeration to say Energy = Life.(25)
Further, for all of the talk on the news about inflation and the rising cost of living, this inflation, in my opinion, is based largely on the government climate policies (more correctly described as a war on carbon) that are making it harder to produce Primary energy from conventional sources and also, forcing more expensive, less reliable, variable, intermittent, renewable energy on all of us. The so called, “Energy Transition” is not a transition, it is only a “War on Carbon and Conventional Forms of Energy” Daniel Yergin said it and so did I in previous Blog posts and presentations. (28, 29, 30, 31, 32, 68) A previous article I wrote used Hawaii as an example. The Islands of Hawaii are an excellent case study in applying green only power generation. Why? Because Hawaii has plenty of sunlight and wind and it is separated from the U.S. Grid. Therefore, as the green only generation is built, with Diesel fuel backup, then the natural and high cost of intermittent green power is experienced by more use of expensive Diesel fuel. Hawaii is an ideal “Science Experiment” in using Green Power. (38)
833,000-1,000,000 Btus of Primary Energy/Day/Person
This is how much primary energy we have become accustomed to having available and at a reasonable cost. Replacing this quantity of reasonable cost, reliable and abundantly available conventional energy with renewables as stated before, is impossible. To attempt to decarbonize America will contribute to the decline of our quality of life and even worse, contribute to the decline of America. Here below is the U.S. Energy Flow Chart for Primary Energy. Prepared by the Lawrence Livermore National Laboratory.
The primary energy flow chart shows the energy flows from all of the sources of energy and how they are used. This is done in BTU equivalents to include non-thermal sources such as Hydroelectric, solar and wind. As shown on the chart, for 2022 Americans used a total of 100.3 Quadrillion BTUs of energy.
A reminder: one BTU is equivalent to 778 foot pounds of work at 100% efficiency. One kWh of electricity is equivalent to 3,412.6 BTUs.
After decades of tax subsidies the quantity of primary energy provided by wind and solar is less than 6%. The fact is, over 90% of our primary energy was in 2022 and remains in 2024, provided by conventional forms of energy: Oil, gas, coal, nuclear, Biomass and old hydroelectric dams. Remember the key words “Primary Energy” when you are told we should “Electrify Everything“. Electricity and Hydrogen are Secondary Energy that must be produced using Primary Energy.
Reality of Bulk Power Supply
Most authors refer to the Grid, (aka Largest Machine Ever Built).(59, 60) I chose to use the term, “Bulk Power Supply” because the term “Bulk Power” better describes generation from conventional power stations. When I reported for work to Carolina Power & Light Company in 1973, the sign on the office door in the central general office stated, “Bulk Power Supply”. I thought it a curious term and wondered why it was not called the “Electric Generating Department”. Apparently, many others have found the term “Bulk Power Supply” awkward too because I do not see references to “Bulk Power Supply” much anymore. However, after all of these years, I think it is the right term to describe Bulk Power Generation when discussing “Megawatt or Gigawatt Hours” not kilowatts of generation.
Let’s take a look at (Bulk Power Supply) electricity generation, by fuels over the last few years during peak summer and winter Demand periods. These are screen shots of actual data. The first is PJM on June 30, 2018. Note that about a third of the generation is by coal fuel.
Since de-regulation of electricity markets in the 1990’s, the U.S. has been divided up into Regional Transmission Operator or RTO’s and Independent System Operators or ISO’s. Here is a map to show what PJM, MISO, ERCOT, etc.
FERC.gov
First, let’s look at PJM on a high Demand day: Notice the importance of coal generation? In this example, coal power provides about a third of the total generation.
The next example is the 48 state Grid for the week January 28-Feb. 4th 2023. Note the generation by fuels. Coal is providing about 22% of the total 544,000 MWh generation on Feb. 1.
Next, let’s look at Duke Energy Carolinas for the first week of September 2023. Duke has a very balanced generation portfolio including a lot of nuclear, gas and coal generation capacity. At the moment shown, coal was providing 21% of total generation.
The neighboring Utility in SC, Santee-Cooper. A much smaller Utility than Duke, with much more dependence on coal fuel. In this example, about two thirds coal power generation is from coal. The lead photo at the top is the 2390 MW Cross Generating Station. This is a very important generating plant for my area of S.C.
The Midcontinent System Operations (MISO) is shown below for a summer day in 2022. Coal is delivering about 42% of the electricity generation at that moment. (68)
From Dick Storm Presentation to ENERUM, Columbus, Ohio, August 2022 Data from MISOENERGY.org
These illustrations are taken from past presentations I have given to show the importance of coal generated power.(68) As this is written, it is spring time and what we in the power plant maintenance business used to call “Outage Season”. Why, because power demand in the spring and fall is the lowest due to mild weather and it is the time to perform major maintenance overhauls. Typical demand curves for different seasons are shown below. From these you can imagine the risk of coming Blackouts is not in the spring and fall, but in the high demand summer or winter months. Remember Texas in Feb. 2021 with over 240 people killed by cold and power shortages?
The PJM load profile shows peak demand in the summer with high air conditioning loads. In the south many states electricity demand peaks in the winter (South Carolina as an example).
Blackouts are forecasted and warnings have been loud and clear. However, the EPA and the government continue their “War on Carbon”. This is intentionally weakening America.
Planning for Blackouts
The illustration below is from the Santee-Cooper IRP. It shows how the forecast of increasing load Demand that is greater than the installed, Dispatchable generation capacity. Some more history of failed S.C. Energy policy is on LI here. (69)
North of Santee-Cooper’s service territory is Duke Energy Carolinas. Their IRP shows a similar gap of Demand and installed capacity. Why? Because the Legislatures in both states have pressured the Utilities to stop using coal. Much of the Duke Energy Coal Plants have been demolished and they plan to completely exit coal use by 2036. The chart below is from one of the Duke Energy IRP’s and it shows an actual deficit of required generation capacity as the coal plants are shut down.
Stopping the use of coal is unnecessary. The Climate Policies are, in my analysis, not to protect the environment or human health. The Climate Policies that have been cooked up to scare the public are all about “One World Government”, Socialism and control of the citizens. Have you noticed that these Climate Policies are only being applied in the Free Western World? Yet, Asia burns over 75% of the world’s coal. Americans need to wake up and here below are some books and references to shed some more light on Climate Policies and sustaining our high quality of life.
Excellent books that forecasted the future of Electric Power shortages and the worldwide misinformation on climate science.
We Have Been Warned!
I am one of many who have warned of coming Blackouts. That’s right, I am not the first skeptic. Let me give credit to Mr. Donn Dears for being one of the first that published books on these harmful policies. Then, after over 100,000 MW of reliable coal plants have been shut down, FERC and NERC and other reputable organizations finally started to chime in. At this time, Blackouts during peak extreme weather in the summer or winter periods are expected. My previous article discussed what I consider to be the largest threats to energy and electricity generation reliability.(64)
FERC, NERC, America’s Power and many others have provided warnings. (43, 44, 45, 46, 47, 48, 49, 50, 51, 52, 53, 54, 68)
Yet, the government agencies, especially the EPA continues the same misguided path toward Net Zero Carbon. My friend, I am sad to say, my late friend, Donn Dears wrote about a dozen books to highlight foolish and un-American energy policies. Four of his books are correctly titled: “Nothing to Fear-A Bright Future for Fossil Fuels”, “Looming Energy Crisis”, “Net-zero Carbon: The Climate Policy Destroying America” and “Clean Energy Crisis”. Donn was a solid American Patriot; Navy Veteran and he had a long career as an executive engineer at General Electric. This was back when G-E was a world leader in conventional power generation equipment. Donn was truly an energy expert’s Expert! Donn’s books are available on Amazon. Worth the read, each is only about 100 pages and they are packed with facts. Donn did his best to save America, even in the last days of his life he was contributing articles and posts on his web site, “POWER for the USA” and communicating with me (and others) to review articles or presentations I prepared and then asked for his advice and review. What a wonderful man and engineer Donn was. RIP my friend, we miss you.
Donn Dears was the one that inspired me to start this Blog. I offer my experiences and my knowledge in all humility, and in memory and respect for my friend, Donn Dears. I miss his friendship and shared wisdom.
America is heading for an energy crisis and it will be hard to correct the harm that has been self inflicted by alphabet government agencies and a rogue, energy ignorant administration.
Please wake up American’s! Please do some research into the importance of energy and reasonable cost, reliable and Dispatchable electricity. Then, pass on the information to your friends and family. Do this for Donn, your own good and for your grandchildren. In my opinion, only about 3% of Americans really understand energy and electricity generation. The Marxist Left has done an effective job of indoctrinating the public with green misinformation. All of us that understand energy and electricity generation need to get involved in preaching the true facts on the unachievable “Net-Zero Carbon and Electrify Everything” nonsensical path of U.S. energy policy.
“Clean Energy Crisis”, Book by Donn Dears, 2023. An excellently written, short and concise review of the energy crisis we are facing. Available on Amazon.
It has now become noticed by the mainstream news that much of the U.S. will suffer Blackouts and electricity shortages as a result of insufficient reliable, dispatchable, affordable generation being built to replace the coal plants that are currently out of favor by government Regulations and climate policy. I have been predicting this and preaching for common sense energy policies for years. Now, even the MSM has acknowledged this unfortunate truth. There is insufficient new electricity generation 24/7 capacity to replace the reliable, affordable and Dispatchable coal plants that have been shut down and many demolished. No one likes an “I Told You So”, but, I did start warning folks with paid energy advertisements in the newspaper, published presentations and energy fact minutes (my friend Matt Smith and me called them EFM’s) on the local radio station WSPC. This was between the years 2008-2015 when then President Obama escalated the “War on Carbon”. It was Obama that mandated Electric vehicles during his second term in office. Then codified by the Pelosi led, Democrat controlled House to force the “Green New Deal” on us, as the so called, Inflation Reduction Act”. Now we are on a dangerous path of Net-Zero Carbon. Yes, decarbonizing our energy industries will cause Blackouts and worse if not reversed.
Here are my thoughts on the ranking, in my opinion, of some of the threats to America’s Lifeblood of electricity from the “Largest Machine Ever Built”, the U.S. Electric Grid. Credit the Smithsonian Institute for coining the name, “Largest Machine Ever Built”. (1) It took over a 100 years to build and the Green’s want to destroy it in a decade or less. So, who are these anti-American organizations?
Threats to Grid Reliability
The top 11 are ranked in my opinion, with the greatest risks first. Most are policy actions of “Self-Sabotage”.
Government Agency Climate Policies, EPA at the top, SEC, BLM, DOD, DOJ and all of government is wrongly applying “Climate First” policies rather than the Best policies for America and younger Americans to experience the “American Dream” as my generation did
Creation of RTO’s that absolved most utilities from planning for future electric generation growth
Environmental Extremist/Activists that use enormous wealth against the Best interests of the U.S.A.
Wealthy Business people who fund NGO’s to Decarbonize the western world
The United Nations IPCC, Agenda 21, Agenda 30 and other so called “Climate Policies”
The World Economic Forum and the members who under the guise of saving the planet are forcing policies of De-Growth, De-Industrialization and Energy Poverty on all of the people of the western world, but not the BRICS, and other countries aligned with Russia and China
“Woke” or “Politically Correct” companies including electric Utilities and Co-Operatives that espouse solar and wind power as being capable of replacing coal, oil, gas and nuclear energy
Public Education, K-12 and Universities that promote climate scare tactics to sway public opinion toward accepting higher energy costs and reduced reliability of energy and electricity
World Bank, IMF, Large Banking and Investment companies that determine which infrastructure projects to finance
Foreign adversary to sabotage transformers or controls of the Grid. Due to the reporting of China influence of embedding chips or other devices into inverters and possibly large transformers, this needs to be included. (32-44)
Physical Damage Vulnerability
Extreme weather has created rare but occasional Blackouts, such as Texas in Feb. 2021. That Blackout and winter storm killed over 240 people.
Then there is another concern, I have thought about for years. That is, criminal and terrorist acts on our Grid and quite honestly, I did not want to write about it because I was concerned that it would give ideas to criminal minded individuals or groups to use for nefarious purposes. But then in checking for references on Grid vulnerability, I easily found over a dozen references including the widely watched CBS-60 Minutes TV show done in February 2023, Technical Society organizations and Congressional Research Service reports for Congress. So, what I am about to say should be no surprise to anyone in the industry. As for protecting America, we have a massive government agency with 260,000 employees in Homeland Security. Certainly, they are aware and are engaged in protecting the Grid. At least, that is what they are supposed to be doing as their name implies?
What Could Happen?
The open border of the U.S. is a concern for all of us. Maybe not a concern for President Biden or the Political Science trained Democrats in Congress, but all of the rest of us are concerned. Let me paraphrase ex FERC Commissioner John Wellinghoff, in his statement on the Feb. 2023, 60 Minutes program. Wellinghoff was asked, “How many substations would need to be damaged to create a U.S. wide Blackout” His answer, less than 20. Take a look at the 60 Minutes video here. The “60 Minutes” nationally distributed TV program is not the only wake up call. There are six reports below in the references for confirmation of the risk. Including a IEEE report which states 9 major substations could create a nationwide Blackout.(5)
Isaac Orr shared his outstanding presentation to Dairyland Power. It is here. His conclusion is similar to mine and his slides on Substack are worth reviewing: (29)The EPA either does not know what they are doing or they are intentionally destroying the largest machine ever built by man, the American Electric Grid.
Back to Current Events and News
It has been widely documented that the open border has allowed many “Military Age Men” from 170 nations to enter the U.S. My concern for this article is, what if say a task force of 100 military and energy infrastructure trained individuals are in fact in a sleeper cell within our country? Waiting for the command to act. Let’s suppose that the 100 men disperse across the country and position themselves to coordinate attacks on crucial sub stations and transmission lines. Yes, it is unthinkable. So was 911.
Conclusion
America’s electric grid is vulnerable and at risk from not only wrongly imposed regulations for forcing renewable energy on us, but also from foreign actors that wish to harm our country. It is not just my warning. Kindly read the references and view the videos listed below. It is my belief that the 2020 election was heavily influenced by Covid and perhaps not by a lab accident half way around the planet. This is an election year and a very small group of trained individuals could create loss of critical electricity for nefarious reasons. The individuals could be surrogates for a nation state, a religious movement or a military act. I feel that the RTO’s and increasing interconnectivity of Utilities is playing into the hands of our enemies to make the Grid more vulnerable, not less.
Compounding the risk is the move towards more dependence on “Just in Time” pipeline supplied natural gas. This exacerbates the risk of Blackouts because so much backup power is provided by pipeline provided primary energy. See reference #4 below.
If I had two wishes, One would be that all of our Electric Utilities were once again independent, Regional Utilities in the model of Carolina Power & Light for eastern NC. Duke Power for western NC, SCE&G for portions of SC, Santee-Cooper for the east coast of SC, etc. The Regional Utility Model is more secure than connecting the Grid as many proponents of green energy wish to do, in my opinion.
My second wish would be that all of our electric generation was from a Balanced Portfolio of varied fuel supplies, with at least 75% coal and nuclear to provide the base load. Nuclear and Coal can store months or years of fuel on site. That is good for Grid Resilience, reliability, affordability and improved national security. That is how I see it.
Yours very truly,
Dick Storm, March 15, 2024, updated May 19, 2025
References and materials for further research to support my conclusions
“Clean Energy Crisis”, Book by Donn Dears, 2023. An excellently written, short and concise review of the energy crisis we are facing. Available on Amazon: https://ddears.com/2023/01/03/clean-energy-crisis/
Good Substack read on a take off of Obama’s quote, “Elections Have Consequences” modified by Pandreco to “Undermining (Grid Security)Electrons Have Consequences”. My note: The consequences are not helpful for a strong energy infrastructure : https://pandreco.substack.com/p/undermining-electrons-have-consequences
Ken Haapala is President of the organization, “Science and Environmental Policy Project. Ken has been publishing TWTW (The Week That Was) Newsletter since the 1990’s. His informative Newsletters can be found here. This week, Mr. Haapala’s quote of the week is apropos for the importance of energy in our lives.
“The cavemen had the same natural resources at their disposal as we have today, and the difference between their standard of living and ours is a difference between the knowledge they could bring to bear on those resources and the knowledge used today…..”
Thomas Sowell
I would continue from Sowell’s quote….
To produce sufficient energy that drives our economy, industry and nearly every comfort and convenience that we have come to enjoy since muscle power provided most of the energy for farming and transportation only 125 years ago….
The path to Net-Zero carbon is a path to Socialism, decarbonizing electricity and transportation energy will not improve human health or improve air quality. The so-called transition to reduced carbon dioxide production (aka Net-Zero or IRA) is disconnected from reality and there is no plan to keep an adequate energy supply for sustaining our current life styles, industrial production, freedom of travel and economic prosperity. The current government policies are Anti-American. The Institute for Energy Research has chronicled 200 actions by the Biden Administration which make it harder to produce oil and gas. Link here. Expansion of the government Regulations that are a large part of the “War on Coal” are detailed by Paul Driessen and PA Pundits, “Congress And The Courts Enable Climate And Energy Fantasies And Government Expansion” Here. Coal power restrictions and the likely electricity Blackouts in the future is chronicled by America’s Power, Here. Also, the author’s presentation to the ENERUM Energy Forum, stating “There is NO Energy Policy, only a policy of Decarbonization”, August 2022, Here. More recently, my takeaways of my PowerGen Panel discussion, here.
I used to think the Democrats and Swamp Bureaucrats in government were trained in, “Political Science”, and not real technical engineering science. At one time I thought they just did not understand the technical details of energy and electricity generation and were naive. However, the fact is, there are enough smart, technically trained engineers in the Bureaucracy (14,000 in the DOE & NETL plus 95,000 contractors and 18,000 in the EPA. with an almost $10 Billion Budget) Biden has the engineering talent resources to have become informed if he chose too. The Department of Energy, NETL, EPA, DOD all employ thousands of engineers. Now after observing the energy and electricity policies of the last three years of the Biden Administration I am of the strong opinion that the weakening of America through the “CCP Trojan Horse” Climate Policies…are in fact, all intentional. Many references are provided to support this conclusion in this and previous articles I have written. Links to these articles are provided below.
Eliminating or attempting to eliminate hydrocarbons from use in America is a movement toward de-growth, de-industrialization, food shortages, more inflation and restrictions on our freedoms. Simply stated: Over Regulated & Restrictive Big Government Socialism.
Net-Zero carbon is a path of the politicians to wield even more control over our lives. It is a political movement by unelected NGO’s to influence government officials. The “Swamp Bureaucrats” are out of touch with Reality and the current “Green New Deal” Climate Policies, are codified as the (mis-named) “Inflation Reduction Act“. This sadly, is the result of years of very well organized scare tactics and court actions intended to instill fear and used effectively to demonize the fuels that our society depends on. The war on carbon is not based on science. Net-Zero Carbon is a path to weaken the people of the free western world. This began with the Presidency of Bill Clinton and the ramping up of New Source Review lawsuits and then was further expanded by the revolving door of employment of radical extremists into high government positions during the Obama Administration. An informative report by the 114th Congress is here. My take on the beginning of the War on Carbon is here. My thoughts on the major U.S. Energy policy influencers, here.
Depending on 100% carbon free fuels (and continuing our high quality of life) by 2050 is delusional and impossible!
I have written much on the origins of the war on carbon and the destructive path of prematurely shutting down coal plants for reliable electricity generation. An Energy Forum presentation and three previous articles are here , here and here. In this article I will attempt to consolidate previous thoughts into one to discuss reality. Also a realistic approach to reducing carbon emissions while keeping America’s productive capacity and economy energized.
Energy is the Economy & Energy is the Sustainer of Our High Quality of Life.
We must be realistic about how fast we can reduce carbon emissions without destroying America as we know and love it. Energy powers life as we have come to enjoy it. Each American uses between 830,000 to 1,000,000 BTUs of energy each day. The energy we need and depend on each day is described in numerous articles, three of these previous articles are here, here and here.This quantity and reliability of energy from conventional sources cannot be replaced with wind and solar. Period. See my previous article on the enormity of the energy we depend on, Here. We have come to depend on this quantity of affordable, reliable energy of which 87% is sourced from gasoline, natural gas, Diesel, coal, Jet fuel and nuclear. The current government path is attempting to abolish fossil fuels which provide over 79% of our energy. The figure above showing 89%+ conventional fuels including nuclear and old hydroelectric plants. I consider these (Nuclear, Gas, Coal, Petroleum and Old Hydroelectric plants) all conventional forms of energy. America will continue to require a minimum of 100 Quadrillion BTUs of energy per year and grow to more than 100 Quads with population growth and more application of technology, such as Data Centers and AI. Read more about the increase in electricity growth, here, here and here. These new Data Centers use nearly as much power as aluminum smelting operations. Some over 250 MW each. It will take much more electricity generation to electrify vehicles and power data centers. Data centers today use about 4% of total electricity use. The future of “Electrifying Everything” suggests an increase in electricity use and instantaneous demand, not a decrease.
Reliable Primary Energy and Electricity = Continued and Sustainable High Quality of Life
Energy and affordable/reliable electricity generation is a pre-requisite to sustain our current quality of life and freedom. The sources for this energy beyond 2050, in my opinion, will be from conventional forms of energy: Natural Gas, Nuclear, Coal, Gasoline, Diesel, Jet Fuel and yes, including Coal
Furthermore, Crude oil, natural gas and coal provide the feedstock for production of thousands of products, and including food production. Energy is required for our high quality of life and including all basic essentials. Including Food, Steel, Cement, Plastics, Water Purification, Sewage Treatment and Fertilizer. When energy costs rise, they do in fact contribute to inflation. Why? Because energy is used for everything! From fertilizer for food production to the processing and transportation of ice cream. Primary metals, such as aluminum, copper & steel use enormous quantities of primary energy to produce. Much of that production has been shut down in the U.S. and moved to Asia.
Take aluminum as an example. This is from an article in the WSJ and a presentation I made in 2016. This shows how China climbed from nearly zero aluminum production in the year 2000 to becoming the major producer of over 50% of the world’s aluminum production by 2016. This rise of China’s economy is fueled by energy use. A reminder, it takes about 5 kWh’s of electricity to produce one pound of aluminum. (about 45,000 BTU’s to smelt one pound) This is for just smelting, and it does not include refining of Bauxite to Alumina, transportation or manufacturing energy to produce final products. China uses mostly coal fuel for their aluminum production. The rise of China’s energy and economy is covered by previous articles here and here.
From Dick Storm presentation to the Delaware County Bar Association, July 2016
The IEA report on energy costs impacting food report is here. The production cost component of most grains is about 50% energy related. The small red circles represent the energy cost component of production. Therefore, it is a fact that rising energy costs contribute to inflation.
From IEA Report, How Energy Crisis is Exacerbating the Food Crisis
A Realistic Approach to Electricity Generation with Reduced Carbon Dioxide Emissions
America has led the world in the reduction of the rate of carbon dioxide emissions since 2007. How? Largely due to the substitution of electric power generation using natural gas fuel for power generation. That is, replacing power generation once accomplished with coal fuel, with natural gas powered generation. Natural gas power generation in a modern combined cycle gas turbine plant produces about 50% of the CO2 emissions as produced by coal power generation. The U.S. total carbon dioxide emissions are shown on the chart below. CO2 emissions dropped from a high of about 6,000 million metric tons to about 4,600 million metric tons in 2020. The sharp drop 2019-2020 was due to Covid and shrinking economic activity. However, the reduction in U.S. emissions of carbon dioxide is almost 25%. As the economy recovers CO2 is expected to increase to about 5,000 million metric tons in 2023. This is still a 16 % reduction from 2007. The most effective path to further reductions in total carbon dioxide emissions is to use more nuclear power for power generation. However, due to supply-chain limits and restrictive Federal NRC Regulations, sufficient capacity of new nuclear plants to replace the over 102,000 MW of coal plants shut down since 2012 will take decades. See previous articles here and here.
Just to put the U.S. CO2 Emissions in perspective. Here is a chart from Our World in Data which shows the CO2 emissions of various countries. The U.S. produces about 16% of the world’s CO2 emissions. China produces about 26%. The comparisons of China and U.S. energy and manufacturing was discussed in a previous article.
Carbon dioxide emissions are primarily a matter of hydrocarbon chemistry. Both coal and gas fuels contain carbon and when combusted the products of combustion form CO2 . The creation of CO2 from combustion is impossible to change. Fuels that have fewer carbon atoms, such as methane, create less CO2 than coal. Coal fuel derives most of it’s energy from the combustion of the carbon molecules. Methane derives most of it’s energy from the combustion of the hydrogen molecules. The figure below shows the electric power production 2004 and 2019. The greater use of natural gas is due to the Hydraulic Fracturing Revolution which greatly increased U.S. natural gas production with a consequent reduction is natural gas pricing. Harold Hamm’s book, “Gamechanger” chronicles the Shale Gas Revolution. The increased supply of low cost natural gas kept electricity prices stable until current times.
The electric power generation from natural gas in 2024 is expected to be over 50%. Is This Good?
Why? Because of increased solar and wind generation facilities need to be backed up with reliable, dispatchable Bulk Power generation capacity. Also, reliable coal plants are being prematurely retired and demolished, which I discussed in a previous article here. Therefore natural gas generation has grown rapidly from both the shutdowns of coal plants and the increased CCGT (Combined Cycle Gas Turbine) plants built to provide power when the wind is not blowing and sun not shining.
Greater dependence on natural gas is good for the reduction of carbon dioxide emissions, as the U.S. has demonstrated since 2007. See chart below.
However, Dependence on “Just in Time” pipeline supplied natural gas is risky for a reliable electricity supply. Why is it risky? Because if pipelines are compromised whether by extreme weather, mechanical failure, government regulations, or by criminal sabotage, the fuel supply can be interrupted. With no fuel on site storage, a major highly efficient and state of the art, 600 MW CCGT power plant will reach zero power output in minutes when pipeline gas stops. However, Coal and nuclear plants can store sufficient primary energy for months and in the case of nuclear, years of generation. A Balanced generation portfolio of at least 75% Dispatchable nuclear and coal plants is preferred, in my experience.
Slide from Dick Storm USCB-OLLI Course, Energy and Electricity Generation 2021
One of the main reasons the total CO2 emissions of the U.S. dropped since 2007 is largely due to the increased use of natural gas to replace coal for power generation. Good, as long as a reliable gas supply is maintained. As mentioned above, and worth repeating, the U.S. will likely reach 50% + dependency on natural gas fueled power plants for fuel in 2024. I see this as an unbalanced and risky generation portfolio. But, then most of my career was as a coal power generation engineer.
Air Quality has Improved since 1970
The overall trend of improving air quality is shown on the chart from the EPA below. Yes, in 1970, the EPA was needed to clean our air. The six major pollutants of CO, Sulfur, Lead, Ozone, Particulates and Nitrogen Oxides have been drastically reduced to healthy levels, even as population, GDP and vehicle miles driven have increased.
Let’s get back to the fundamental chemistry of natural gas and why natural gas produces less carbon dioxide than coal for the same unit of power generation. Gas power generation produces about half the CO2 of a similar unit of electricity generation from coal. Why? Primarily because natural gas is over 95% methane. The chemical symbol of Methane is CH4 . That is four molecules of hydrogen and one molecule of carbon. This compared to coal which, depending on the coal rank, and on an ash and moisture free basis, derives about 95% of its heating value from carbon. This is the main reason of why and how America has led the world in carbon dioxide reductions since 2012. Substituting coal power generation with natural gas can provide the same primary energy as coal with about 50% of the carbon dioxide emissions, due mostly to the differences of carbon intensity of methane and coal. Another factor in power generation is, that “Combined Cycle Gas Turbine” (CCGT) plants are much more efficient than Rankine Cycle coal fueled steam plants. Modern gas fueled CCGT plants can achieve up to about 65% efficiency, Ultra-supercritical Steam plants up to about 42% efficiency.
Here are examples of coal and methane molecules to illustrate the different carbon intensity of coal and natural gas.
A molecule of methane gas has one central atom of carbon with a molecular weight of 12 surrounded by four atoms of hydrogen, each with a molecular weight of 1.
A coal molecule, by comparison is mostly carbon and derives most of it’s heating value (primary energy) from carbon.
Fundamentals of Energy and Work
America uses right at 100 Quadrillion BTUs of Primary energy. Previous article here. Each BTU (British Thermal Unit) when converted to work at 100% efficiency is equivalent to 778 Foot Pounds of work and when 3,412.6 BTU’s are converted to electricity at 100% efficiency can generate 1 kWh. Human muscle power/energy is equivalent to about 100 watts. Think about using a hand pushed lawnmower, (if you remember those), and compare to cutting your lawn with a 2 Hp gasoline powered lawnmower with less than a gallon of gas in the tank. More on replacing muscle power, energy and economic prosperity are written on previous articles, here, here,here and here.
Energy and Economic Prosperity
Designing and manufacturing products provides jobs. Manufacturing provides funding for R&D to create new and better products. It is best for America if manufacturing was mostly within our borders. I have written on this before and the quote below is copied from substack, Doomberg(3)
Energy is not an input into the economy, IT IS THE ECONOMY. Humanity organizes its economic activities to ensure a steady growth in the extraction and exploitation of primary energy because energy is life, standards of living are defined by how much energy is available to be exploited, and all humans everywhere are perpetually seeking a higher standard of living.
Primary energy is what powers a modern economy and America needs about 100 Quadrillion BTUs of energy each year. This was described in the series parts 1-4.(50, 51, 52, 53)
So, Where Does the 100 Quadrillion BTUs of Primary Energy Come From?
Here are the sources of Primary Energy for the U.S. in 2022.
As can be seen conventional fuels of natural gas, petroleum, nuclear and coal provide 87% of the energy we need (more than 89% if old hydroelectric plants are included). Eliminating fossil fuels (79%) will create great harm to our economy. Those of us that were adults in the 1970’s remember the economic pain and disruption of our lives due to the Oil Embargoes. Temporary loss of industrial capacity, jobs, and restrictions on travel and our way of life. The Oil Embargoes of 1973-1980 were temporary and America solved the energy shortages! Now, Forcing Net-Zero Carbon by current government Regulations will be irreversible and permanent. Our politicians could take a look at the impact on the German economy from their attempt to replace coal and nuclear with wind and solar. It has not worked and is well documented. Here are two references, Here and here.
Loss of Supply-Chains are Nearly Irreversible
Once Net-Zero Carbon is imposed, the Domestic supply chains will be lost. Therefore, without a rational transition Net Zero Carbon policies, aka “Inflation Reduction Act or Green New Deal”, will literally plunge us into darkness and despair if we do not wake up to the need to do much more with natural gas, coal and nuclear power to generate the electricity. We must have reliable, affordable and Dispatchable energy and electricity to sustain our lives. More energy to grow and prosper. I wrote and article covering the path of the U.S. nuclear power industry here. Long story short, we mortally wounded the nuclear steam system supply-chain with over-regulations by the NRC and other government decrees.
Summary and Conclusions
Reduction of Federal Regulations should be top priority. The total government Swamp Bureaucracy has been engaged to restrict conventional forms of energy. This must stop.
A rational path forward is to roll back EPA Rules to those in effect in 2012. It is my strong opinion and observation that any rules applied after 2012, especially those overly restrictive on coal plant emissions are simply weaponization of government against coal. Similar restrictive rules by other government agencies have been applied toward the production, refining and transport by pipeline of oil and gas. The Congressional report here, explains why I picked 2012 as a Roll back year..
Replacing much (but not all) of the 100 Quadrillion BTUs of needed energy in America could be done with carbon free nuclear electrification and even including hydrogen production from nuclear generated electric power. However, with current regulations and supply chain limitations, expanding nuclear beyond the current fleet will take decades. In my view nuclear power is a very good approach. As it was in 1954 when the head of the Atomic Energy Commission proclaimed, “Electricity from nuclear will be too cheap to meter”. It took about 30 years to reach 20% of U.S. electricity generation from nuclear. Since then, enormous regulatory roadblocks have been enacted into law that make a repeat 30 year success story very unlikely. So, what do I recommend? I recommend rolling back EPA rules to those in effect in 2012 and building new coal and nuclear plants. Coal and nuclear generation is the foundation of electricity reliability even today when there is extreme weather, especially extremely cold winter periods. So, why not build some more proven coal and nuclear plants to strengthen our energy and electricity reliability and security with a “Balanced Portfolio” of generation?
In closing, let me quote chapter 8 of Donn Dears book, “Clean Energy Crisis“. This is what Mr. Dears calculated that it would take to replace fossil fuels with carbon free power. Build these:
881 new nuclear power plants similar in size to one of Georgia Power’s Plant Vogtle Units
BTW it took over ten years to just build two 1,100 MW units at Vogtle
995,141 new 2.5 MW wind turbines
3,919,006 MW of PV of solar power
Read Mr. Dears book. It is only 128 pages including the index, Dears Bio and references. Please also read the other references below. Most importantly, become an energy savvy voter in November. America needs a realistic path forward for energy and electricity production. Thank you for reading this.
“Clean Energy Crisis”, Book by Donn Dears, 2023. An excellently written, short and concise review of the energy crisis we are facing. Available on Amazon: https://ddears.com/2023/01/03/clean-energy-crisis/
Conventional energy is vitally important for all that we do. Missing from news reports to the general public is an honest communication to try to explain the huge and enormous energy systems that we depend on each day and the impossibility of replacing conventional energy with wind and solar. To start 2024, I thought I would post a series on the Hard Truths of Energy. I borrowed the title from the 2007 National Petroleum Council report, led by Chairman, Lee Raymond, retired CEO of ExxonMobil. Petroleum, natural gas and coal were important in 2007 and they remain important today. The “Energy Density” of fossil fuels makes them indispensable to sustain our economy and our high quality of life.(4)
Fossil Fuels Provide 79% of U.S. Primary Energy
79 Quadrillion BTUs is the amount of energy we depend on from fossil fuels. This is my attempt to try to explain and illustrate what 79 Quadrillion BTUs of energy looks like. The number 79 Quadrillion is from the Department of Energy’s Lawrence Livermore Laboratory for energy use in 2022.(2) Below is a short summary of the amount of natural gas, petroleum and coal that we used in the U.S.A. in 2022.
How Huge is a Quadrillion?
I have discussed the steady U.S. energy demand of 100 Quadrillion BTUs per annum for decades and yes, 100 Quadrillion BTUs is the amount of energy we use each year and it has been steady for over 20 years.(6) Until now, I did not take the time to explain the enormity of a Quadrillion BTUs. Here is what one Quadrillion BTUs of energy is equivalent to:
Coal= About 50 million tons of coal. This would be a coal pile that would be one mile wide, ten feet high and 3.3 miles long.
Oil= 7.14 Billion gallons. See Lee Raymond quote below on the quantity of motor fuels used in the U.S. in a year
Natural Gas= 1 Trillion cubic feet. This is equivalent to 200 aircraft carrier sized LNG Tankers. More on the enormity of an LNG ship below.
It is a fact, in America, we use and need about 100 Quadrillion BTUs of energy each year.
36 Quadrillion BTUs of Petroleum
The single largest form of energy that we depend on is petroleum. About 20 million barrels per day. To visualize what 20 million barrels per day would look like, take a look at the photo of me and the 48″ Alyeska pipeline in Alaska. At its peak flow, about 2 million barrels per day flowed through the Alaska pipeline. So, to visualize 20 million barrels per day, picture in your mind, ten of these 48″ pipelines installed side by side.
Photo credit, Dick Storm circa 2007
Another illustration was offered by Lee Raymond, retired CEO of ExxonMobil when introducing the National Petroleum Council report “Facing the Hard Truths of Energy” in 2007. This explanation is offered by Mr. Raymond on You Tube, here. Mr. Raymond explained that the amount of motor fuels used in 2006 was about 150 Billion gallons. He then went on to state that if each gallon was placed in a one gallon tin can as he used in his youth to fill his lawnmower, the length of 10″ high cans, if placed end to end would circle the earth 1,000 times. That is the enormity of 150 Billion gallons of motor fuel. Mr. Raymond stated, (among other important points), “To replace current energy systems it will take a an enormous effort and a long period of Time.”(5)
The gasoline and Diesel motor fuels used in the U.S. has increased from the 150 Billion gallons consumed in 2007, to about 209 Billion gallons in 2022.
33 Quadrillion BTUs of Natural Gas
America used 33.4 Quadrillion BTUs of natural gas during 2022. Most of the natural gas used by the U.S. is distributed by a vast network of unseen, underground pipelines. Therefore, hard to visualize. So, let’s imagine that if we were to use all of our natural gas from shipments of LNG, (Liquified Natural Gas) how many huge LNG Super Tankers would it take? Such as the vessel Pan American shown below:
This LNG tanker holds 174,000 cubic feet of liquified natural gas. LNG is 1/600th the volume of the gaseous state. The ship is over 977 feet long and the gross tonnage is 114,966. This is a ship about the size of a U.S. Navy aircraft carrier. The energy equivalent of the cargo is about 6 trillion BTUs.
Now, imagine 6,600 ships like the Pan American above all lined up along the east coast. If the ships were placed touching, end to end, this would be about 1,220 miles of ships from New York City to south of Miami, Florida. That is the number of aircraft carrier sized LNG tankers that it would take to provide 33 Quadrillion BTUs of natural gas fuel. The 33 Quadrillion number is from 2022, the actual demand. The future will likely require more than 33.4 Quadrillion BTUs.
10 Quadrillion BTUs of Coal Power
Coal power has been important to the U.S. since the days of Thomas Edison, Nikola Tesla and George Westinghouse. The American electric system, referred to as the “Grid” was built on the foundation of reliable, affordable, domestically supplied and environmentally clean steam power generation fueled by coal. This took over 125 years to build and has been described by the Smithsonian as, “The Largest Machine Ever Built”. Video here. As recent as 2011 about 50% of America’s electricity was produced by steam turbines with steam generation from coal fuel. In 2022 the coal powered electricity generation dropped to about 20%. Much of the total electricity generation which was once powered by coal fuel, has been switched to natural gas fuel.
As recent as 2011 America used about a billion tons of coal. In 2022 coal use declined by about 50% to about 512,000 million tons. Coal is important because of it’s enormous energy density. Another important fact, is that weeks and months of primary energy can be safely stored on site. Coal provides Dispatchable power and it is proven to be affordable. America has the largest coal reserves of any country. The U.S. is the Saudi Arabia of coal.
How much coal is 512,000 million tons? This is enough coal to fill about 5,000,000 coal cars such as the one shown below.
How long would a single train of 512,000,000 tons of coal be? About 50,000 miles, long enough to circle the earth two times at the equator.
Conclusions
The so-called energy transition from conventional to wind and solar is simply not possible with today’s technology. As Mr. Raymond stated in 2007, changing from our conventional energy systems to something else is an enormous effort that will take. a long time.
Net-Zero Carbon by 2050 is impossible. A previous blog post is here.
The largest energy density and provider of the greatest quantity of carbon-free energy is nuclear power. However, replacing the existing electric generation with nuclear will take decades to accomplish and massive roll back of Federal Regulations. It took about 40 years to develop, manufacture, construct and perfect the 93 operating commercial nuclear units in 54 plants. These currently provide about 20% of America’s electricity. Most of these are now over 30 years old and the last two units built by Southern Company (2,200MW capacity) took over ten years to build. A previous blog post discusses “Without New Thinking on Nuclear Power, Net Zero Carbon is Impossible”, here.
Electrifying Everything is not possible, even electrifying transportation is not practical for every vehicle and if they were, much more electricity would be required.
The so-called energy transition from conventional forms of energy to wind and solar is impossible and attempting to do so by forced laws (such as the IRA), increased Regulations and the continuing war on carbon will destroy our country.
It is my hope and prayer that after the next election some sanity to energy policy will return.
Much has been written on the importance of energy to power a nation’s economy and to continue to provide a high quality Human Development Index. The purpose of this post is to focus on the importance of Fuel Diversity for electricity generation. There is a proven concept for energy storage for electricity generation. It is coal fueled power plants with a 30-60 day supply of coal in a pile, on site. This is proven to be reliable, low cost and safe.
Energy powers everything we do!
Think about this. You are probably reading this on a computer screen. Have a warm cup of coffee nearby and are sitting in an air conditioned office or home. Your car is sitting outside and at your urging is ready to provide transportation. You get the point. Remember the last hurricane or severe winter storm that killed power for a day or so? Loss of energy sources or electricity is debilitating. Think about the 1970’s Oil Embargoes. If you are too young to remember 1973-1979 check these references, here and here.
Primary Energy Sources-Back to Basics
Lets discuss energy and electricity and the sources and quantity of everyday energy that we depend on.
America has used right at 100 Quadrillion Btus of PRIMARY energy per annum since about the year 2000.
The energy we use is compiled by various government agencies in BTUs equivalent (British Thermal Units). A BTU is enough heat to raise one pound of water one degree Fahrenheit, just as a reminder of High School Physics. Each BTU converted to work is equivalent (at 100% efficiency) to 778 Foot Pounds. Therefore, the energy production and consumption is converted to BTUs so that all forms of energy can be reported on a like basis. I wrote an article on the basics of energy for Middle School students here if you are interested, also on “Demystifying Energy and Electricity” here.
This article is about fuel diversity. Just as I explained above regarding the reporting of energy in BTUs to have a common measurement of energy quantities, in some cases one fuel can be substituted for another, especially in electric power generation. Thermal Power Generation Plants that generate Bulk Power can be provided with natural gas, coal, oil, Biomass or nuclear energy to produce steam to drive a steam turbine generator. The fuel selected is done for reasons of economic or fuel availability. Hawaii is truly an Energy Island and thus cannot interconnect with the lower 48 states. Fuels for Thermal Power Generation needs to be imported. In fact, I wrote on Hawaii’s electricity generation in 2020, here.
The proportions of each form of energy used and depended on to power our lives has changed as technologies for extraction and production have improved. For example for electric power generation coal fuel was consumed for about 50% of power generation in year 2000. Then due to the Shale Revolution of Hydraulic Fracturing and Directional Drilling, natural gas became less expensive than coal on a $/million BTU basis. See my review of Harold Hamm’s book, Game Changer which covers the Shale Gas Revolution, here. Thus, gas was substituted for coal generation by many utilities that could get it. Alaska and Hawaii of course do not have pipelines to connect, but of many utilities in the lower 48 states, gas was an economical and clean fuel of choice.
Coal fuel in the U.S. today provides about 23 % of the primary energy to produce Bulk Electric Power over the year. The substitution of coal fuel as primary energy is natural gas which has become more economical as a result of the Shale gas revolution which took off about 2012. Electricity is SECONDARY Energy and must be produced from Primary energy. Electricity is important and in 2022 electricity consumed about a third (37.7% to be exact) of the total PRIMARY energy used in the U.S. The best factual illustration that I am aware, of the sources and consumption of primary energy is the LLNL Energy Flow Diagram, shown below. This is one of my favorite graphics and it is prepared each year by the Department of Energy. The chart above shows the total primary energy used since 1950 and thus supports my conclusion that America needs right at 100 Quads per year to sustain our quality of life, economy and industrial production.
The total Primary Energy used by the U.S. from coal fuel in 2022 was about 10% of the total. (9.91% from data above). That doesn’t seem like much does it? Remember, this is primary energy I am talking about. So, although coal only provided about 10% of our total primary energy it was in fact, Dispatchable, affordable and it provided electricity generation when solar and wind were not available. The chart below is of MISO generation by fuel this past summer. This example shows 40% of total power generation in MISO from coal at this moment in time.
The topic of this article is “The Importance of Fuel Diversity”. The example above of summer Bulk Power Generation depending on coal fueled power generation units is just one of many reasons America should keep our Fuel Diversity. Another example of the importance of coal plants and the consequences of shutting them down is discussed in my blog post discussing the February 2021 Texas Blackout that killed over 200 people. Here.
My previous post on De-Mystifying Energy attempted to explain this, here. The difference between Primary and Secondary Energy is important. If everything is Electrified as many suggest we should do, has anyone really thought through where the primary energy to do so is to be sourced? In my opinion, it has not. Wind and solar cannot replace the primary energy currently required. The four charts shown up to here should make that clear.
Government policy and many people in the general public believe that renewables can replace fossil fuels and nuclear. The harsh reality is that after decades of government subsidies & tax credits wind and solar provide less than 6% of our total PRIMARY energy. Here below is the LLNL Energy Flow Diagram from 2021 with the 4.96% wind and solar contribution circled.
Public demonization of all conventional fuels including nuclear, coal, gas, gasoline, Diesel are unAmerican and foolish. Wind and solar only provide single digits of the total Primary energy needed to power our lives and it will be impossible to ramp wind & solar renewables up to 100% of our energy needs. The charts above are from the government statistics as published on the Lawrence Livermore National Laboratory Sankey Diagram website, an excellent resource.
Back to Fuel Diversity
Each American citizen, on average is accustomed to using about 315 million Btus of energy per year. I have written separate articles on American energy use here and here. My first point is that we all need on average of about 863,000 to 1 million Btus each day in Total Primary Energy. This number is provided by dividing 330 million citizens into 100 Quadrillion Btus and then dividing that by 365 days/year = 863,000 BTUs per day/citizen of PRIMARY Energy. This is for all uses which (see LLNL chart above) including: Electricity generation, Transportation, Industrial Production, Commercial and Residential uses. The second important point is that providing this energy each day may be from various forms of energy. Depending on which is more efficient or more economical. Let’s take an example of electric generation on July 21, 2023 in the Midwest at about 2:00 PM in the afternoon (example above). It was more economical to use coal fuel for 40% of the electricity generation at that hour. It may have been, I do not know for sure, that only coal generation could deliver the electricity Demand at that moment. The fact is, coal delivered 40% of the electricity at that moment.
Let’s take another example from last winter. This example below is from Christmas week, 2022.
Fuel Diversity with more coal plants ready to operate and properly maintained could have avoided the Blackouts of Christmas week, 2022. Duke Energy has shut down many coal plants as part of their Net-Zero Carbon plan. So have many other Utilities, both Public and Investor Owned. I presented my views on this at the ENERUM (Columbus Ohio Energy Forum) in August 2022. My presentation is Here. Also, my recent article on the self sabotaging of our energy and electricity generation Grid is here.
Even well respected utilities that were once known for their outstanding leadership and engineering excellence are planning to shut more of their coal plants down in the near future. This works against Fuel Diversity! Here below is a screen print excerpt of the Duke Energy IRP for 2023:
These planned shut downs are in spite of the winter 2022 rolling Blackouts described above. Why? Because the N.C. politicians and top Duke management have agreed to follow a disastrous Net-Zero Carbon path. So has the S.C. Legislature and Santee-Cooper. I wrote about Santee-Cooper in an earlier article, here.
Energy Storage
My first instructor on electricity generation was in class in 1959. The instructor, Harry Park stated, “Electricity needs to be generated the instant that it is needed”. That stuck with me my entire career. Today intermittent renewables are the rage and of course, as Mr. Park stated in 1959, electricity needs to be generated or provided from storage the instant it is needed. That is what built America’s Grid and America’s strong economy. Reliable, affordable electricity available the instant it is needed or in today’s word, Demanded. The published articles I see regarding the justification of higher and higher percentages of wind and solar generation are dependent on electricity storage. The best and largest Bulk Power Storage systems today are “Pumped Storage Hydro”. Such as Duke Energy’s Bad Creek or TVA’s Raccoon Mountain. These work well where the local topography allows it. Bad Creek has about 1,200 ft of elevation change between the upper and lower reservoirs(21). Bad Creek is currently, according to N.C. Business Journal, being uprated to about 2,800 MW. TVA’s Raccoon Mountain provides 1,650 MW of storage. Two other alternatives for storage are batteries and hydrogen. The largest battery electric storage system (BESS) that I am aware is in California. This is at Moss Landing Plant in California. It is being uprated to 3,000 MWH. The “H” after MW means Hour. That means the electricity stored is good at the rated capacity for one hour. Enough time to start gas turbines or buy power from a neighboring utility on the grid. Hydrogen can be a source of storage too. However, it must be remembered that it takes about four times the input of electricity to produce one unit of Bulk Power from hydrogen. An excellent reference on this was published in Gas Turbine World Magazine in August 2022, Here. (22)
The most reliable, proven, safe and affordable form of Energy Storage: A large pile of coal onsite at a clean, efficient coal power plant. When I started in the power generation business in the 1960’s one of my experiences was in conducting a boiler efficiency test at a large power plant in Illinois. As I recall the explanation for the huge coal pile was, “Because of the possibility of Union walkouts at either the coal mines or the railroad, a 90 day supply of coal was required to be stored on site”. Proven, safe and affordable. The photo below is real long term energy storage. A coal pile can store enough energy for a 2,000 MW power plant to run full power for months, not hours as is currently planned for batteries.
These five categories of energy use are shown on the LLNL charts above. Americans with our current population of about 330 million, will need at least 100 Quads per year for the foreseeable future. If we are to sustain our quality of life and freedom to travel, we will continue to need about 100 Quads per year. This article is focussed on electricity generation and the 37% of America’s PRIMARY Energy used to generate Bulk Power. The second part of this article will cover the other 63% of our PRIMARY ENERGY.
Conclusion
It will be impossible to replace fossil fuels with wind and solar any time soon. Attempting to do so will create hardships, economic decline and a general weakness of our country including weakness of our National Security.
The best and most proven energy storage system that I have known through my entire career in power generation is a large coal pile. It was common for coal power plants to have 30 or 60 day supplies of coal storage on the plant site.
On a positive note, I wrote about the preceding 80 years the “Era of Affordable, Reliable Energy and Electricity Generation, Part 1” Here. America really did great things in making energy and electricity reliable and affordable for over 80 years. Coal plants became more efficient and clean, nuclear power came of age and America became energy independent and the largest producer of natural gas in the world. I chose 80 years because that covers my lifetime and I know the history of accomplishments during these times, because I worked in the power generation business for over 50 of those years. Experiences in design, maintenance, operations, tuning, upgrading, capacity improvements, Betterments, Heat-Rate Improvements, fuel flexibility, fouling and slagging reductions and emissions reductions of fossil power systems. I admit, I am not a policy wonk, I am a nuts and bolts power engineer. But, I have been gifted with many years of experiences and have traveled much of the world to witness the relationship of energy and economic prosperity.
The loss of legacy coal plants is threatening Bulk Power Supply Reliability by the loss of over 100,000 MW’s of reliable coal power generation capacity without replacing it in kind is wrong. I wrote on the “End of the Era of Reliable, Affordable Energy and Electricity” a couple weeks ago. It is here. The references included are from NERC, FERC and other reliable people and sources of information. I encourage the reader to check these references to decide for yourself.
Nuclear power generation is the only known technology to produce carbon dioxide free electric power. However, building a new nuclear power generation supply chain will take decades. David Archibald wrote an excellent article on “The Energy Future We Need to Have a Future Worth Having”, here. I also support nuclear for the long term, but the next 30 years are important to work through and hopefully, sustain our high quality of life until future technologies and the needed supply-chains are sufficiently developed for safe and reliable implementation. My previous blog post covered an overview of the needed new thinking (and policies) on nuclear power for carbon dioxide emissions reduction to succeed. here. (27)
This is my Perspective of Proven, Reliable, Affordable & Abundant Energy & Electricity Generation during my lifetime. Here are some of the significant technical advances, changes, regulations, incidents, events and policies that have shaped energy and power generation over the last eight decades. Some personal experiences are interjected during this era just to show where I am coming from in my perspective. Part 2 will cover my thoughts on the impossible transition to renewables.
A Brief History of the Improved Quality of Life Since WWII
Dr. Euan Mearns wrote in WUWT this short summary of the history of energy and the “Energy Transition as Social Vandalism”(19). An excerpt from the concise and well written essay:
“The mid 19th century also saw the development of early internal combustion engines, although at that time there was insufficient fuel for a motor industry. The Spindletop gusher and subsequent discoveries changed all that. The world was now awash with oil without any real market. Then in 1908, Henry Ford rolled out his Model T to begin the age of the car and mass transit. The Wright brothers’ first powered flight in 1908 led quickly to commercial air travel and eventually to the jet age.
Unparalleled development came with the 20th century and the introduction of nuclear power plants whose uranium fuel contains more than 16,000 times the energy content of coal, oil and natural gas. At the same time, hydroelectric power rapidly expanded and natural gas (the most energy dense of the fossil fuels by mass) became more available for electricity generation and home heating and cooking.
The introduction of gas-fired central heating enhanced the well-being of populations. Whole homes would be heated by hot-water radiators, and no longer would families have to huddle round a dirty coal fire. By 2000, life expectancy in world population had risen to 66 years, 78 years in the now developed countries.”
Looking back, I am awed by the progress that was made for the Betterment of the quality of life for Humankind. I am proud of my small contributions along the way.
Some of the Significant Energy & Electricity Mileposts: 1940-2023
Pulverized coal firing for steam generation becomes the predominant method of power generation
Mechanical dust collectors are used for collection of particulates
1941 B&W invents and develops Cyclone Burners to fire low fusion midwestern coal with more than 70% of the ash collected as a molten smelt
1943 Combustion-Engineering invents and develops Tilting Tangential Firing
Electrostatic precipitators are applied to large coal plants
1949 First G-E Gas Turbine for electric power generation in the U.S. installed at Oklahoma Gas & Electric Belle Isle Plant
1951 U.S. Navy Admiral Rickover obtains funding from Congress to build the first nuclear powered submarine, Nautilus
1953 President Eisenhower’s “Atoms for Peace” initiative
Supercritical pressure steam generators become common place
1955 USS Nautilus puts to sea
1955 First “Atoms for Peace Conference” in Geneva
Steam temperatures and power generation from Rankine cycle steam plant efficiency approaches 40% design efficiency
1957 Shippingport Nuclear Steam System, the first U.S. Commercial Reactor is proven
1957-59 Philo and Eddystone Ultrasupercritical Units are placed in service
1970 – President Nixon signs law to form EPA
Coal pulverizer state of the art advances to single pulverizers with over 100,000 pounds per hour capacity
1973 First Oil Embargo
1977 U.S. Department of Energy is formed with the intention to lead America to energy independence
The Strategic Petroleum Reserve is begun
1978 EPA Clean Air Act
1978 President Jimmy Carter signs Energy Policy Act
1979 Three Mile Island Incident
1980 Energy Security Act
1988 G-E Single Cycle Aeroderivative Gas Turbine achieves 41.9% efficiency
1990 EPA-Clean Air Act Amendment
1991-First Horizontal Drilling by Enid Company in OK
Low NOx Burners or other NOx reduction systems are installed on most coal plants across the U.S.
Flue gas desulfurization becomes standard for coal plants
Selective Catalytic Reactors are used to reduce NOx
2010 Hydraulic Fracturing combined with Directional Drilling by Harold Hamm’s company greatly increases shale gas production in ND
2012 The Shale Gas Revolution produces natural gas at lower cost/million Btu than coal
2014 CCGT (Combined Cycle Gas Turbine) units achieve over 60% efficiency
2020 Natural gas electricity generation provides over 38% of U.S. electricity production
2022 U.S. Congress passes IRA Law and Biden signs, it codifies green energy
Reasonable Cost Energy & Electricity Improves Quality of Life
This is a personal story of electricity generation. Here is my take on how “Living Better Electrically” came to be, during my lifetime. Here is a typical TV ad from circa 1962, the year I entered the workforce.
Electricity Generation 1962-2012 Living Better Electrically
This 50 year period was my personal career, most of which I spent working in the electric power generation business. Including equipment design, manufacturing, startup, testing, operations, maintenance, emissions reduction and upgrading of coal power production equipment. My specialty was large electric utility fuel burning and steam generating equipment. Upon graduation from Williamson in 1962 I was employed as an electrician then as a utility engineer at Mobil Oil Corporation. In 1966 I joined Babcock & Wilcox working in Barberton, Ohio as a Technical Assistant to the Project Engineer in the Nuclear and Special Projects Department. Projects that I worked on as part of the B&W team were the Duke Oconee Nuclear Steam Systems, numerous reactors, steam generators and pressurizers for Navy Nuclear Propulsion Systems and large heavy walled, high pressure, pressure vessels for the Petrochemical industry.
Duke, Oconee #1 Reactor Vessel at B&W Shop in Mt. Vernon, Indiana, from Duke Annual Report 1967
In the 1960’s electricity was very reasonable in cost and nuclear power was proclaimed by the AEC Head (Atomic Energy Commission) Lewis Strauss as soon to be “Too Cheap to Meter”. Commercial nuclear power generation had been proven at Shippingport and was growing exponentially in applications all across the country. The two most memorable engineering leaders that I remember visiting B&W’s Barberton facilities (while I worked there) were Admiral Rickover, the Father of the nuclear Navy and commercial nuclear power generation and Bill Lee, who at the time, was Duke Power Company’s VP of engineering. Mr. Lee was said to have favored the B&W Nuclear Steam System because it was slightly more efficient with the Once through Steam Generator providing a small amount of superheat that competing NSS (Nuclear Steam Systems) did not provide, to the steam supply to the turbine. Duke Power at the time, had commissioned some of the most efficient coal plants in the world and planned to extract the highest possible efficiency from their first nuclear powered steam supply system. This was logical to Mr. Lee and one reason he was attracted to the new B&W OTSG (Once Through Steam Generator) which was designed for a few degrees of superheated steam temperature. My previous blog post discussed the B&W, C-E and Westinghouse nuclear power manufacturing facilities here.
The Most Efficient and Largest Supercritical Coal Power Plants Built 1957-1975
The 1960’s were exciting times for coal fueled power plants too. Two Milestone supercritical power plants were built and started up during this time. The 5,000 psi Eddystone Steam Station (Philadelphia Electric) with a steam generator built by Combustion Engineering and the 4,700 psi Philo Plant (AEP) steam generator was built by Babcock & Wilcox.
Soon after these magnificent accomplishments was the 900 MW Combustion Engineering series of supercritical steam generators at Conemaugh & Keystone plants in western PA. Then the 1,300 MW supercritical steam generators built by B&W for AEP and TVA. Certainly impressive to me at the time with furnaces over 100 foot wide and operation at over 3,500 psi with superheated main steam at 1,000 degrees F. and also Reheated steam supply to 1,000 degrees F.
Duke Power designed, installed, operated and maintained the most efficient coal plants in the world with the additions of Marshall Units 3 & 4 on Lake Norman in 1969 and 1970.
Later, the Belews Creek coal plant was installed and between Marshall and Belews Creek competed for the highest efficiency coal plants in the U.S. Belews Creek Steam Station is a 2.24-GW, two-unit coal-fired generating facility located on Belews Lake in Stokes County, North Carolina. It is or was Duke Energy’s largest coal-burning power plant in the Carolinas and when it was operated on coal it ranked among the most efficient coal facilities in the United States. During 2006, it was the fifth most efficient coal power plant in the United States with a heat rate of 9,023 Btu/kWh (37.8% conversion efficiency). In 2008, it was the #1 most efficient coal power plant in the United States with a heat rate of 9,204 British thermal units per kilowatt-hour (2.697 kWh/kWh) or 37.1% conversion efficiency.
A Few of My Personal Experiences with Coal Plants in the 1970’s
My first foray into S.C. was as one of three startup engineers for the SCE&G Wateree coal plant in Eastover, SC. This is a coal fueled, two unit supercritical steam supply plant which uses two Riley Stoker supercritical steam generators. These are the only two supercritical steam generators built by Riley. They have been very successful and in fact, at this writing are still in service 53 years after the startup of Unit #1. After that in 1972 I was assigned as lead startup engineer at the 420 MW Sutton Unit #3 near Wilmington ,NC. This plant is shown below during steam line blowing in June 1972. Steam line blowing was one of my favorite activities in the startup of a new plant. The roar of the exiting steam at supersonic velocity was memorable and provided a sense of the enormous power of steam. Steam line blowing is a one time startup operation to remove grit and foreign debris from inside the superheater and reheater tubes and piping, so that when operation begins, solid particles of debris will not damage the steam turbine blades.
Following the startup of Sutton #3, in January 1973 I joined Carolina Power and Light Company as a senior engineer. My first assignment was as the lead startup engineer on Roxboro Unit #3. This is a 720 MW coal Unit with a unique design of two half capacity boilers and one common feedwater supply train with a blended single stream steam supply to one G-E 720 MW turbine rated at 2,400 psi 1,000 degree F. Superheat and 1,000 degree F. Reheated steam to the last 13 stages of the turbine. The Roxboro plant is shown below in a recent photo by Duke Energy. This plant was started up as CP&L and was later absorbed to be part of Duke Energy.
Reasonable Cost, Abundant, Reliable and Dispatchable Coal and Nuclear Provide the lowest Cost Electricity in the World
The Roxboro plant is still in operation and it is rated at 2462 MW generation capacity. Let me digress with a short anecdote. Back in the time frame of about 1975 I was involved in an ASME meeting in Niagara Falls, NY. As part of the group, we were given a tour of the Niagara Falls Hydro plant on the U.S. side of the river downstream of the falls. I was struck at the time with the realization that all of the water feeding several of the Great Lakes provides (on the U.S. side) about the same generation capacity as the Roxboro Thermal Plant did. A real world lesson in “Energy Density”. Roxboro’s four units are rated 2,462 MW, the Robert Moses Hydroelectric plant 2,300 MW. This comparison is one I find helpful when non-energy trained people ask why are coal plants necessary? It helps to explain the enormous energy density of a coal fueled power plant.
Niagara Falls, Robert Moses Hydroelectric Plant, about five miles downstream of Niagara Falls, From NY Power Authority website
Fuel Diversity Helps Keep Costs Down, All Fuels Are Important
I joined Riley Stoker in 1969 and worked at Tampa Electric on the final acceptance work of the Gannon Station Units 5 & 6. Then on to the SCE&G Waterree plant for the startup of Riley’s first and only supercritical steam generator. Wateree is still running today and it was very successful. After startup of Wateree #1, I was sent to the City of Lakeland, Florida to finish the startup of the 80 MW oil and gas fueled Power Plant #3 (now named McIntosh) The unique and difficult design of this unit was that it was a stand alone, single unit with no steam connections to another unit. It was fueled by heavy oil, #6 or also known as Bunker C. The oil required heating to about 220 degrees F. to reduce the viscosity for satisfactory atomization and complete burning in the furnace. Because there was no gas or steam connections, the startup entailed firing on Diesel fuel until the boiler had at least 1000 psi drum pressure. Then the stored energy of the boiler would be used to heat and circulate oil from the Heavy oil supply tank. It sounds simple enough, however when the new controls and safety interlocks were all in startup mode, unproven and with numerous glitches, steam pressure would be lost and the operation on diesel fuel would need to be repeated. Any field engineer with experience in oil firing Utility boilers knows the importance of steam or compressed air cleaning of the Ljungstrom regenerative air heaters to prevent fires. That is the reason I was sent to Lakeland. The previous startup engineer was not careful about airheater cleaning and both airheaters were destroyed by fires. I was sent to replace that unfortunate startup engineer.
Oil firing was common in the 1970’s because it was competitive with coal at $0.50/million Btu. After Lakeland I was sent to lead the startup of Jacksonville Electric Authority’s Northside #2. A 325 MW heavy oil fueled boiler. Then off to CP&L Sutton #3, a 420 MW fueled at startup with heavy oil and with provisions for future coal fuel. America’s power demand was rapidly growing, especially in the south where air conditioning and heat pumps were taking off in popularity. As I recall peak load growth was about 10% per year. To illustrate the rapid growth in electric demand, here is my recollection of the units added at CP&L over a five year period:
Robinson #2, 700 MW, 1970 (Nuclear)
Asheville Unit #2, 200 MW, 1971 (coal)
Sutton Unit #3, 420 MW , 1972 (coal/oil)
Roxboro Unit #3, 720MW, 1973 (coal)
Brunswick Unit #1, 836 MW, 1975 (nuclear)
During this time period (1970-1977) CP&L was a regional Utility separate from Duke Energy. The total installed capacity of CP&L back during this time was about 6,000 MW. Therefore, the rapid system load growth is illustrated by the addition of five generating units totaling 2,876 MW in generation capacity in just five years. It was a great time to be involved in the power industry… And then came the Oil Embargo and some difficult times for the industry.
City of Lakeland, Power Plant #3, Now there are three Units, including a 360 MW coal unit #3. Picture by Dick Storm about 1971
During 1973 the U.S. government supported Israel in the Yom Kippur War between Israel and the Arab nations.
At the time of the first oil embargo, 1973-1974, the EPA had been creating needed air pollution rules to reduce emissions from coal fueled power plants. Amongst the first pollutants to be addressed, was particulates. Before the Oil Embargo coal cost and oil cost per million Btus was about the same, right at $0.50 per million Btu. Therefore to reduce emissions fast, Utilities had an economic choice of converting coal plants to oil fuel which has nearly zero ash content or install millions of dollars of backend equipment, including electrostatic precipitators. Carolina Power and Light Company took the path of installing electrostatic precipitators on the newest units (Asheville #2, Sutton #3 and Roxboro #3) and converting the older, smaller coal units to being fueled by oil. Many utilities to the north, including VEPCO, PEPCO, Philadelphia Electric and others, chose the fuel oil conversion route to reduce particulates with less capital cost than installing electrostatic precipitators. This could be done with much lower costs to the consumer because the coal and heavy oil costs were about the same on the fuel cost/million BTU. About $0.50/mmb. Fuel cost is the largest single component of electricity production cost. Comprising between 75 and 92% of the production cost. Thus, when fuel costs escalate, so does the electricity production cost increase.
The Oil Embargo made an immediate fuel supply shortage for all petroleum products and including residual #6 heavy fuel oil. This is when, in my recollections, that major “Wheeling of Power” across state lines became common. The Utilities in the states to the north of CP&L were; VEPCO, PEPCO, Delmarva and Philadelphia Electric. They could receive coal generated electricity from Duke Power, CP&L and other southern Utilities across state lines using existing Transmission interconnections by wheeling power. This was before RTO’s (Regional Transmission Operators) were created.
The 1973-1980 time frame was difficult for Utilities and some had to cut once reliable dividends to stockholders and some went Bankrupt (Consolidated Edison in NY had a particularly difficult time) due to the volatile fuel costs.
National Energy Act of 1978
The energy shock of the oil embargo prompted Congress and the President to act on energy policy. Also during this time the Alaska Pipeline was approved and built(15). Jimmy Carter signed the first Energy Act in 1978.
America’s electricity supply has remained reliable and of reasonable cost for all of my lifetime. Below is a chart of world electricity prices in 2009 which shows the comparison of U.S. electricity prices to other industrialized countries of the world.
Shown on the chart of electricity costs above is Denmark and the Netherlands which were two of the first countries to implement wind farms for significant portions of their power generation.
America up to about 2012 used coal fuel for over 50% of our electricity production. Reasonable cost, reliable, abundant and dispatchable coal, generation powered the largest economy in the world. Reasonable cost electricity and GDP tend to parallel each other as shown on the graph below.
Coal Plant Efficiency Rankings
Up until the war on coal, coal plant designers, operators and maintenance personnel took pride in striving for the best overall efficiency. The best yearly coal plant efficiencies were typically from well run supercritical steam pressure units. Duke Power, PEPCO and AEP typically held the top positions. Duke Power’s Marshall and Belews Creek had repeatedly good years. Here is a typical ranking from 2013, Power Engineering Magazine:
I personally remember many meetings with Utility engineering management where the topic of discussion was modifications to the boilers and fuel burning equipment so that fuel changes could be made to reduce the production costs of power and at the same time, reduce emissions. One fuel change that was popular in the 1990’s was to convert coal plants designed for eastern Bituminous coal to fire western Powder River Basin fuel. This reduced emissions of NOx and kept production cost of power reasonable.
The Shale Gas Revolution
The combination of Hydraulic fracturing and Directional Drilling created an enormously large boost in U.S. natural gas production beginning about 2012. Natural gas prices at the Henry Hub dropped from a high of over $12.00/million BTU to about $2.00/million BTU in 2012. This abundance of natural gas fuel at this price, was competitive with well run, efficient coal plants. Then, the E.P.A. ramped up restrictions on coal plant emissions but the consumer was insulated from electricity price hikes because many natural gas CCGT (Combined Cycle Gas Turbine) plants were being built and fuel diversity allowed the Utilities to switch generation from coal plants to new, highly efficient CCGT generating units.
The vastly increased supply of natural gas drove the price of gas down to below the cost of coal on a unit heating value basis. Gas dropped to below $2.00 per million Btu. Also during this time period, gas turbine-combined cycle plant efficiencies increased to the range of 60%. Power generation efficiencies over the years is shown on the graph below. The combination of low cost natural gas and enormous efficiency advantage of CCGT plants greatly increased the use of natural gas fuel for power generation. Keep in mind, the advantage of natural gas fuel is only an advantage when there are pipelines to provide the fuel and there is an abundant natural gas supply. This does not work well in all states, such as Massachusetts and Hawaii.
The combinations of low fuel cost, low Capital cost, low environmental emissions controls cost and greatly increased efficiency together made natural gas fuel more economically attractive than coal for new generating plants. The fuel of choice became natural gas for Utilities that had pipelines and sources of natural gas fuel. Coal fuel accounted for 50% of electricity generation in 2004 but was reduced to 23% by the increased use of more economical natural gas by 2019.
Duke Energy, Buck Station CCGT Plant
America is Blessed with Enormous Energy and Mineral Resources
America has plenty of Coal, oil, natural gas and nuclear fuels to power our economy and our life styles. I have written other blog posts on the relationship of energy and economic prosperity. Specifically, our lifestyles and our industrial production requires on average, about 315 +/- 15 million Btus of energy each year per person This equates to about 100 Quadrillion Btus of energy per year for our country. This level of energy requirement has held steady for about twenty five years. More on the need for 100 Quads of energy/year are here,here, here and here (20, 21, 22, 23) . Up until the manufactured climate hoax and war on carbon, America enjoyed reasonable cost, reliable electricity and also gasoline, Diesel and Jet Fuel supplies. America became energy independent in 2020.
Energy Growth and Clean Air Too!
Protection of the environment is important to all of us, including me. In fact, much of my career was invested in improving efficiency and reducing emissions of coal generating plants. There has been steady progress in cleaning the air and water of the U.S. and I would be remiss if I did not show that during the preceding eight decades in spite of population growth, increases in the number of miles driven and the growth of the economy, the real pollutants have been drastically reduced from the levels of the 1950’s, 1960’s and 1970’s. The chart below was prepared by the EPA.
Two of the Last Clean Coal Plants Built in America
Coal plants are robust, reliable and when properly maintained can run safely and reliably for over fifty years. Several of the plants that I have personal experience with were mentioned above. However, newer designs with greater efficiency and improved emission controls should be built to replace the aging plants. In 2008 there were plans for dozens of new, clean coal plants to be built. Two magnificent examples are the John Turk Plant and the (then called Cliffside) #6 Unit at Rogers Energy Center in S.C.
Duke’s Rogers Energy Center Unit #6 Startup 2013AEP-John Turk Plant, Arkansas
Example of Many New Coal & Nuclear Plants, Planned and Should Have Been Built 2012-2022
Santee-Cooper Pee Dee Plant, Planned to Be Built near Florence, SC
The Pee Dee Energy Center is one example of dozens of new, clean, efficient coal plants that were planned but cancelled due to political pressure of the environmental activists. I predict that these plants will be sorely missed during the winter peak power generation periods in December 2023 and January 2024. So will the Summer Nuclear Units #2 & 3 be missed.
Slide of Summer 2 & 3 and Vogtle Plant Construction from Dick Storm USCB-OLLI Course
Summary
My contribution to the progress made in the last 80 years was very modest and I will quickly admit that. However, because I worked with many talented and visionary engineers and in hundreds of generating plants around the world, I had a very good position to observe the progress of the giants in our industry. Engineers with a Vision of abundant, clean and reasonable cost electricity generation. To mention a few of these giants: Admiral Hyman Rickover, Bill Lee of Duke Power, Mendall Long of CP&L, Bill McCall of Santee-Cooper and many more fine engineers like them. What were their goals? To improve the quality of life, security, safety, economic growth, ensure that reasonable cost power could be produced for decades into the future, provide Bulk Power at the lowest possible cost to attract industry, increase industrial output, provide good paying jobs in their service territory, and design power plants that provide environmental protection for all of the citizens.
During the last 80 years nuclear power became a reality and today about 19% of our electricity is generated from clean, carbon free nuclear power plants. Many are now over fifty years old, but still reliable and inexpensive producers of vital electricity.
Natural gas generation has progressed from the first simple cycle unit built by G-E in 1949 at about 25% efficiency to today’s combined cycle gas turbine plants that at optimum load points can operate at over 60% thermal efficiency. They are amongst the most efficient machines ever built, of any kind.
Ultra-supercritical, clean coal plants such as Turk and Rogers #6 have been developed to provide reliable, reasonable cost, clean and importantly, Dispatchable power generation. There should have been built more like these Why? Because fuel diversity is important when one fuel becomes short in supply. For example, the 1973-74 Oil Embargo. Today most of the Dispatchable electricity generation is from natural gas which of course, flows through pipelines. Pipelines are reliable but, fuel storage is not practical. Coal plants, on the other hand, can store several months fuel supply on site.
Fuel Diversity is important for electricity generation reliability. I am proud to have worked during these years to do my best to make a small contribution to the great progress that was accomplished.
Part 2 will describe the self induced end of reliability, affordability and dispatch ability of electricity generation. As Dr. Euan Mearns recently wrotein “Watts Up With That”….The “Energy Transition is Social Vandalism”(19)
It is my best hope that America and our politicians will wake up and understand the importance of primary energy from conventional sources.
Yours very truly,
Dick Storm, October 4, 2023
References
You Tube video of a “Living Better Electrically” ad hosted by Ronald Reagan, who was with the G-E Theater on Sunday nights for 8 years 1953-1962: https://www.youtube.com/watch?v=u5Lz1C53RwI


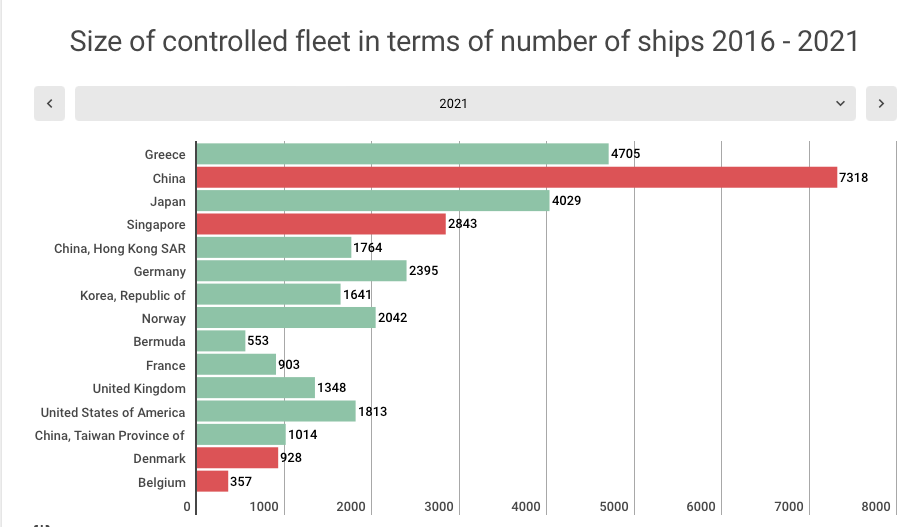

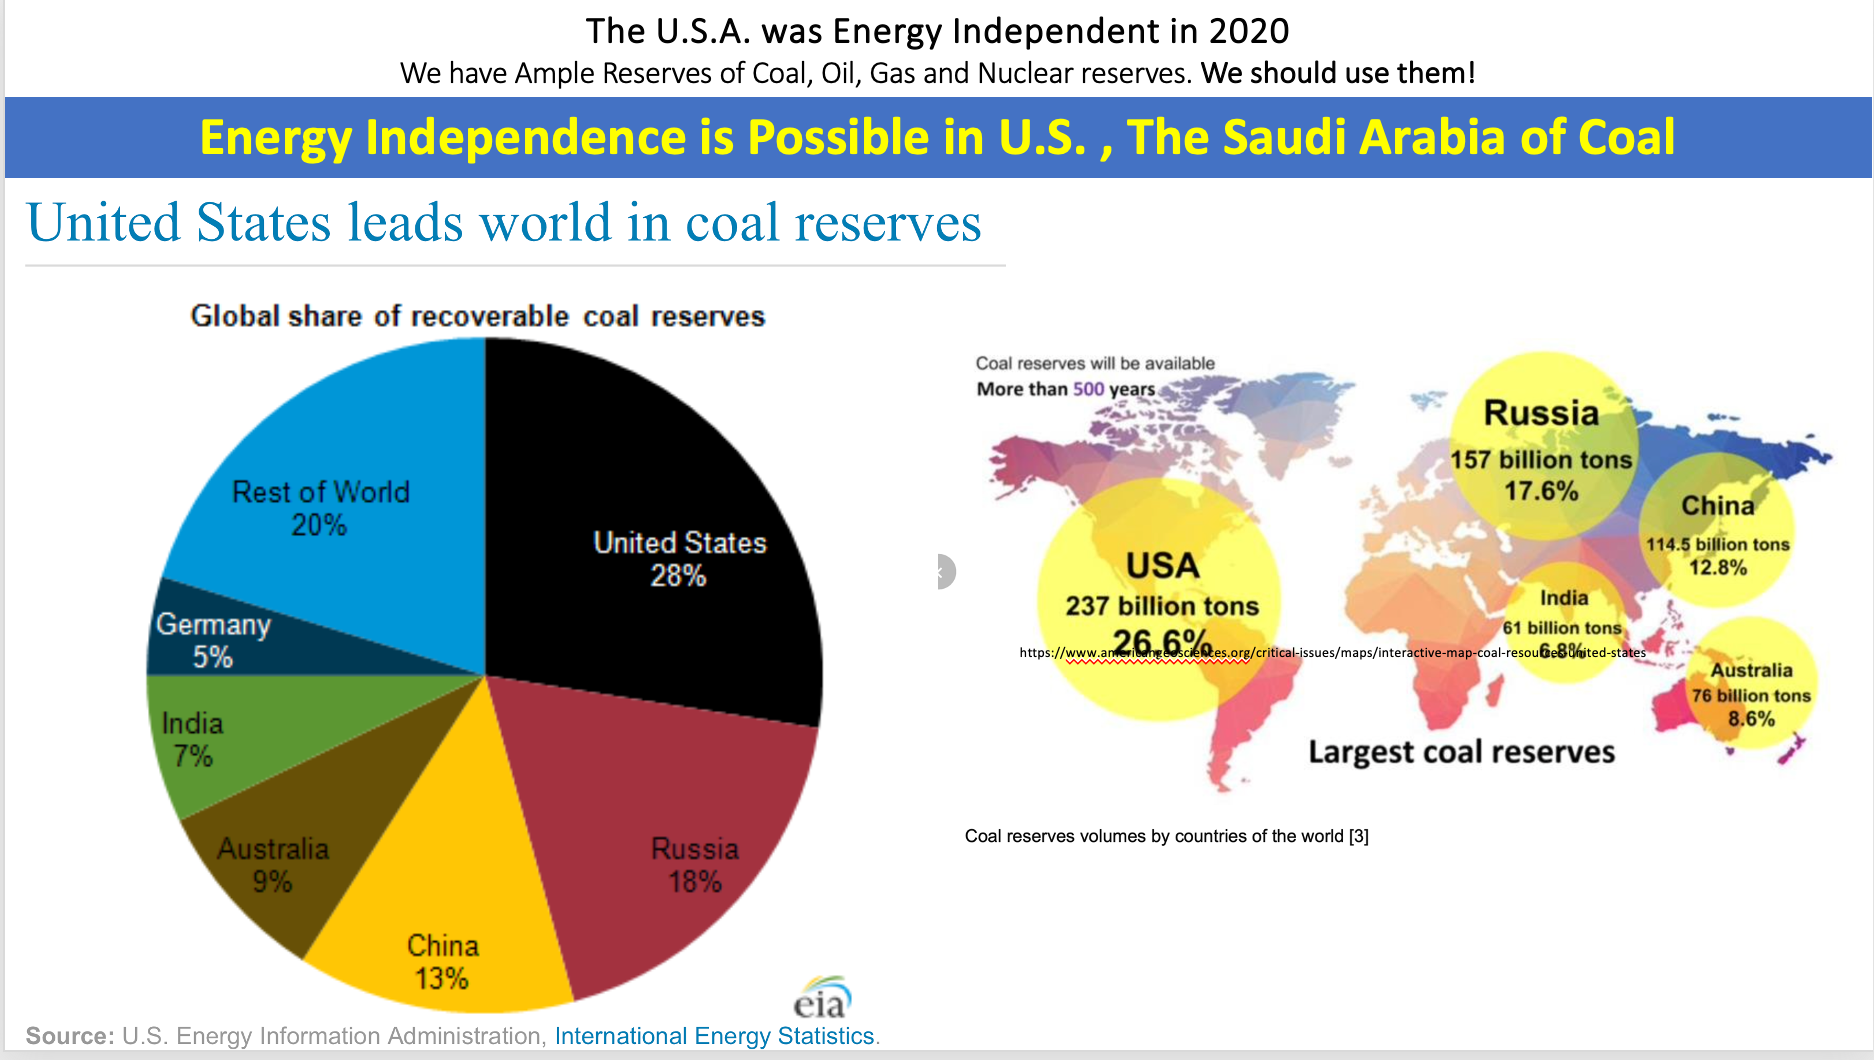
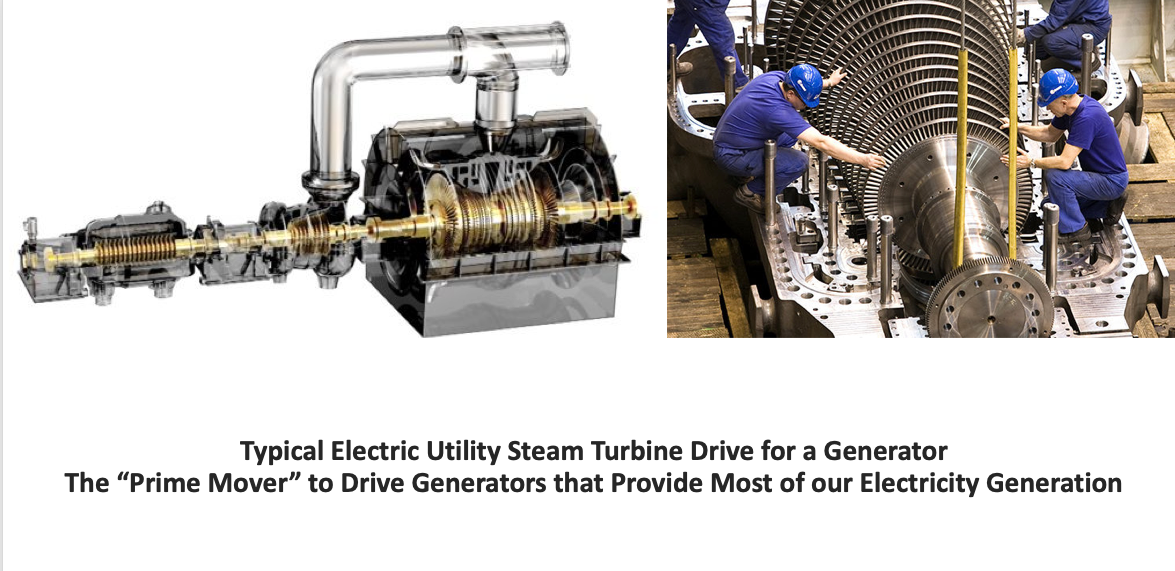


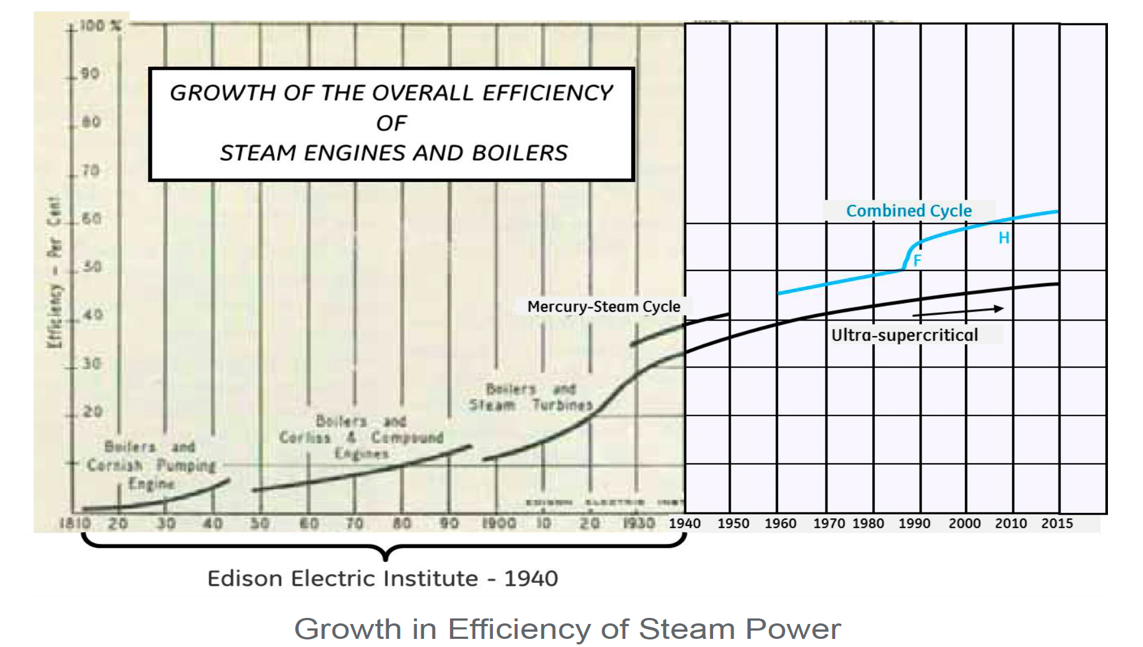
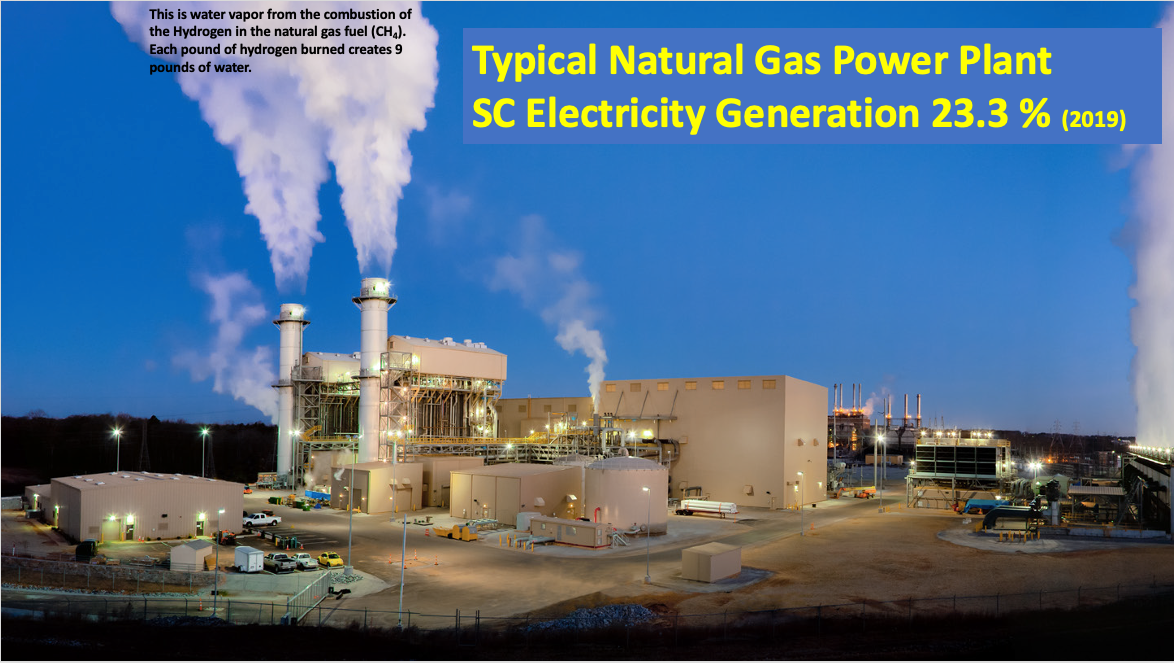
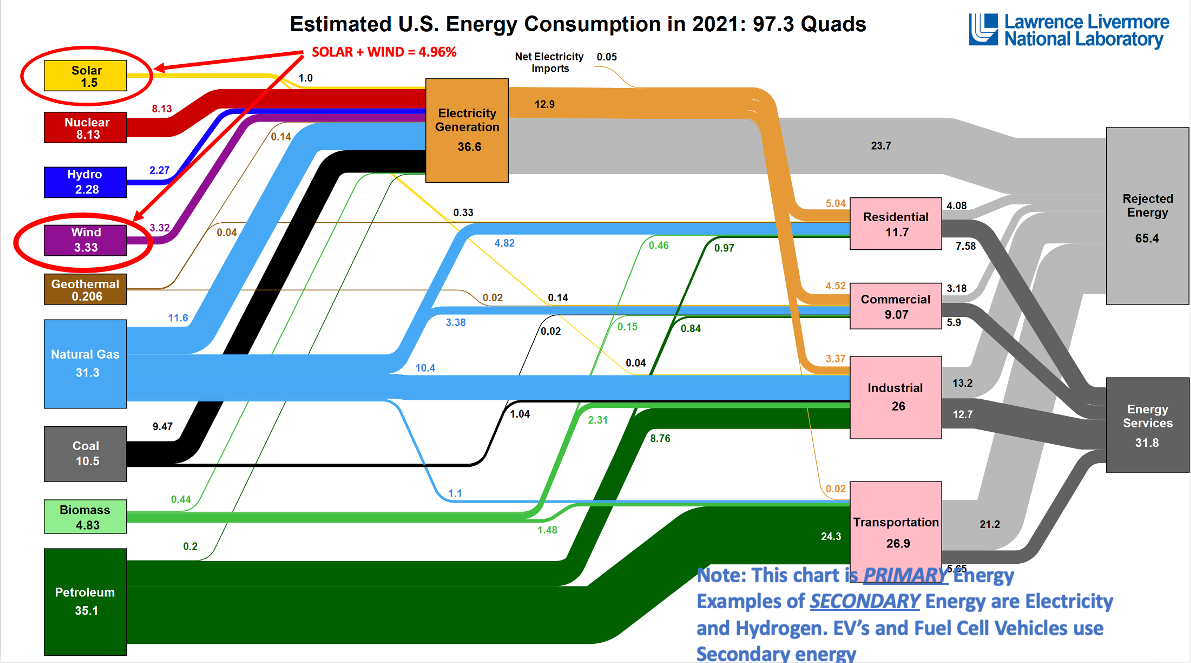

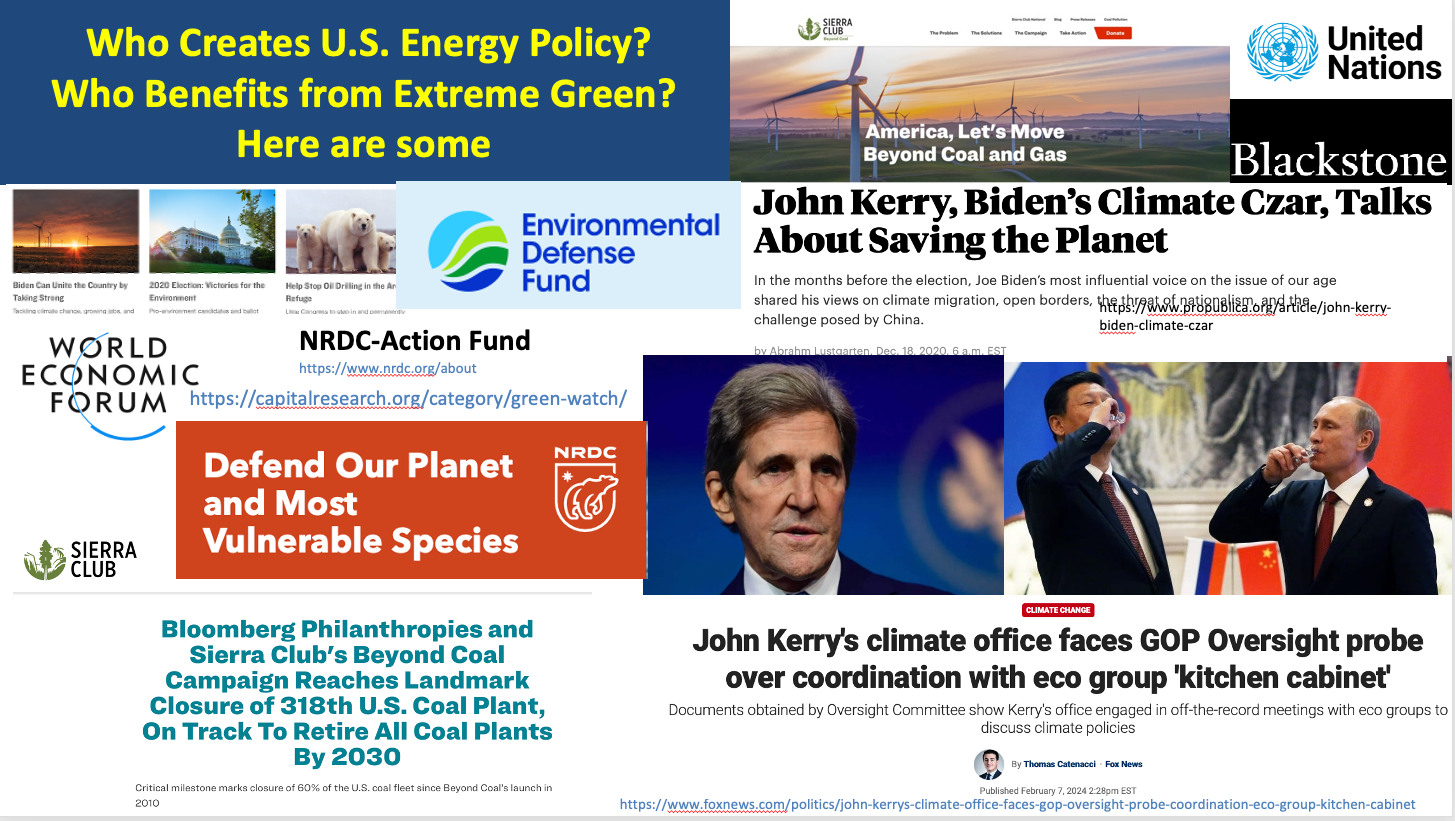
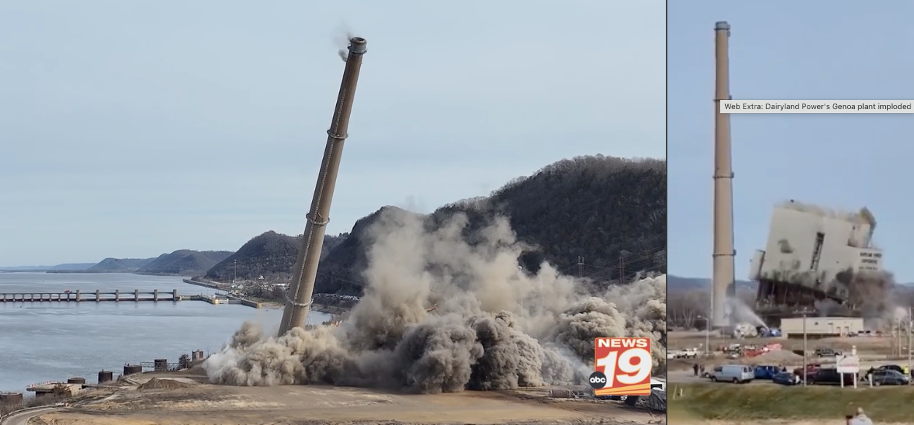
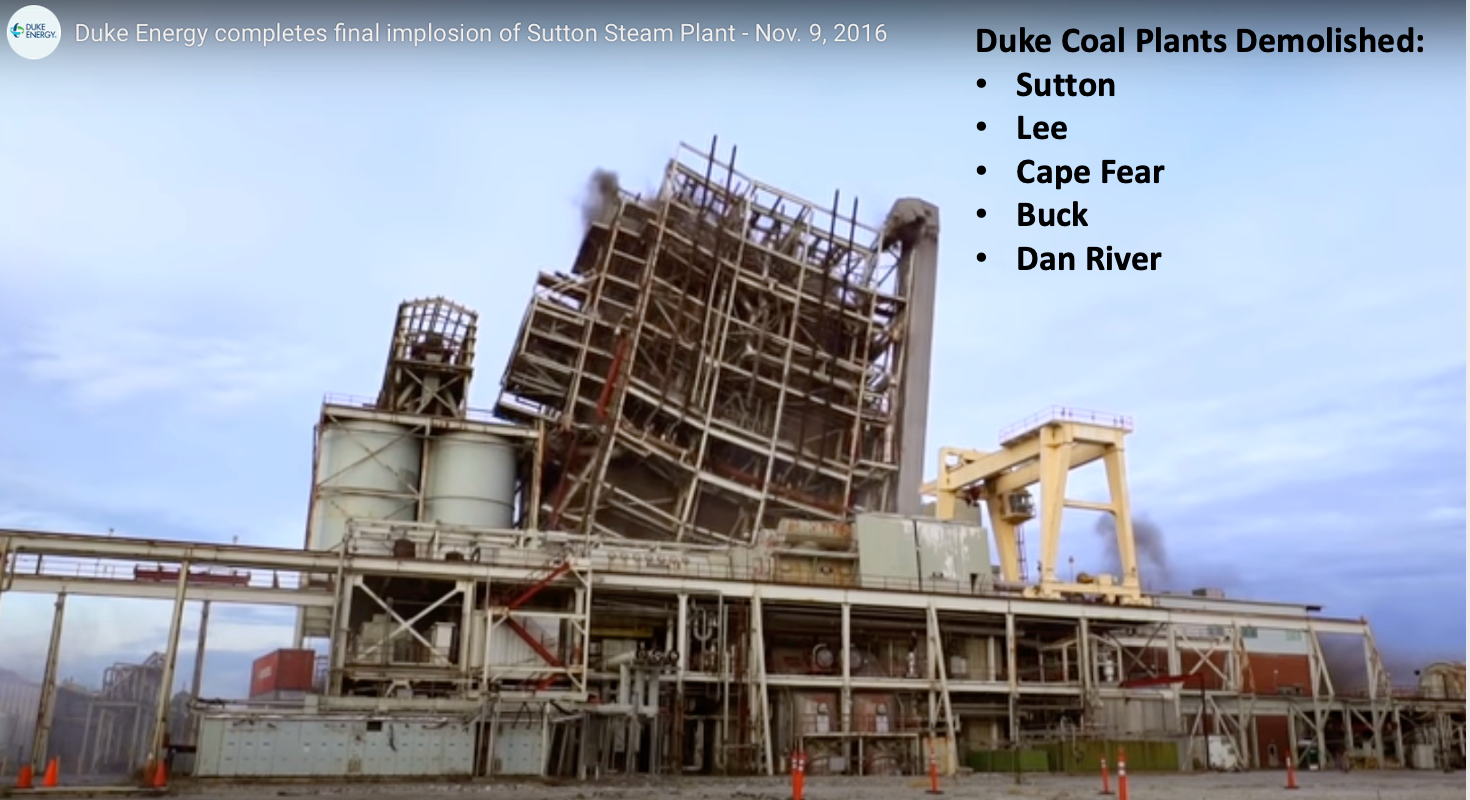


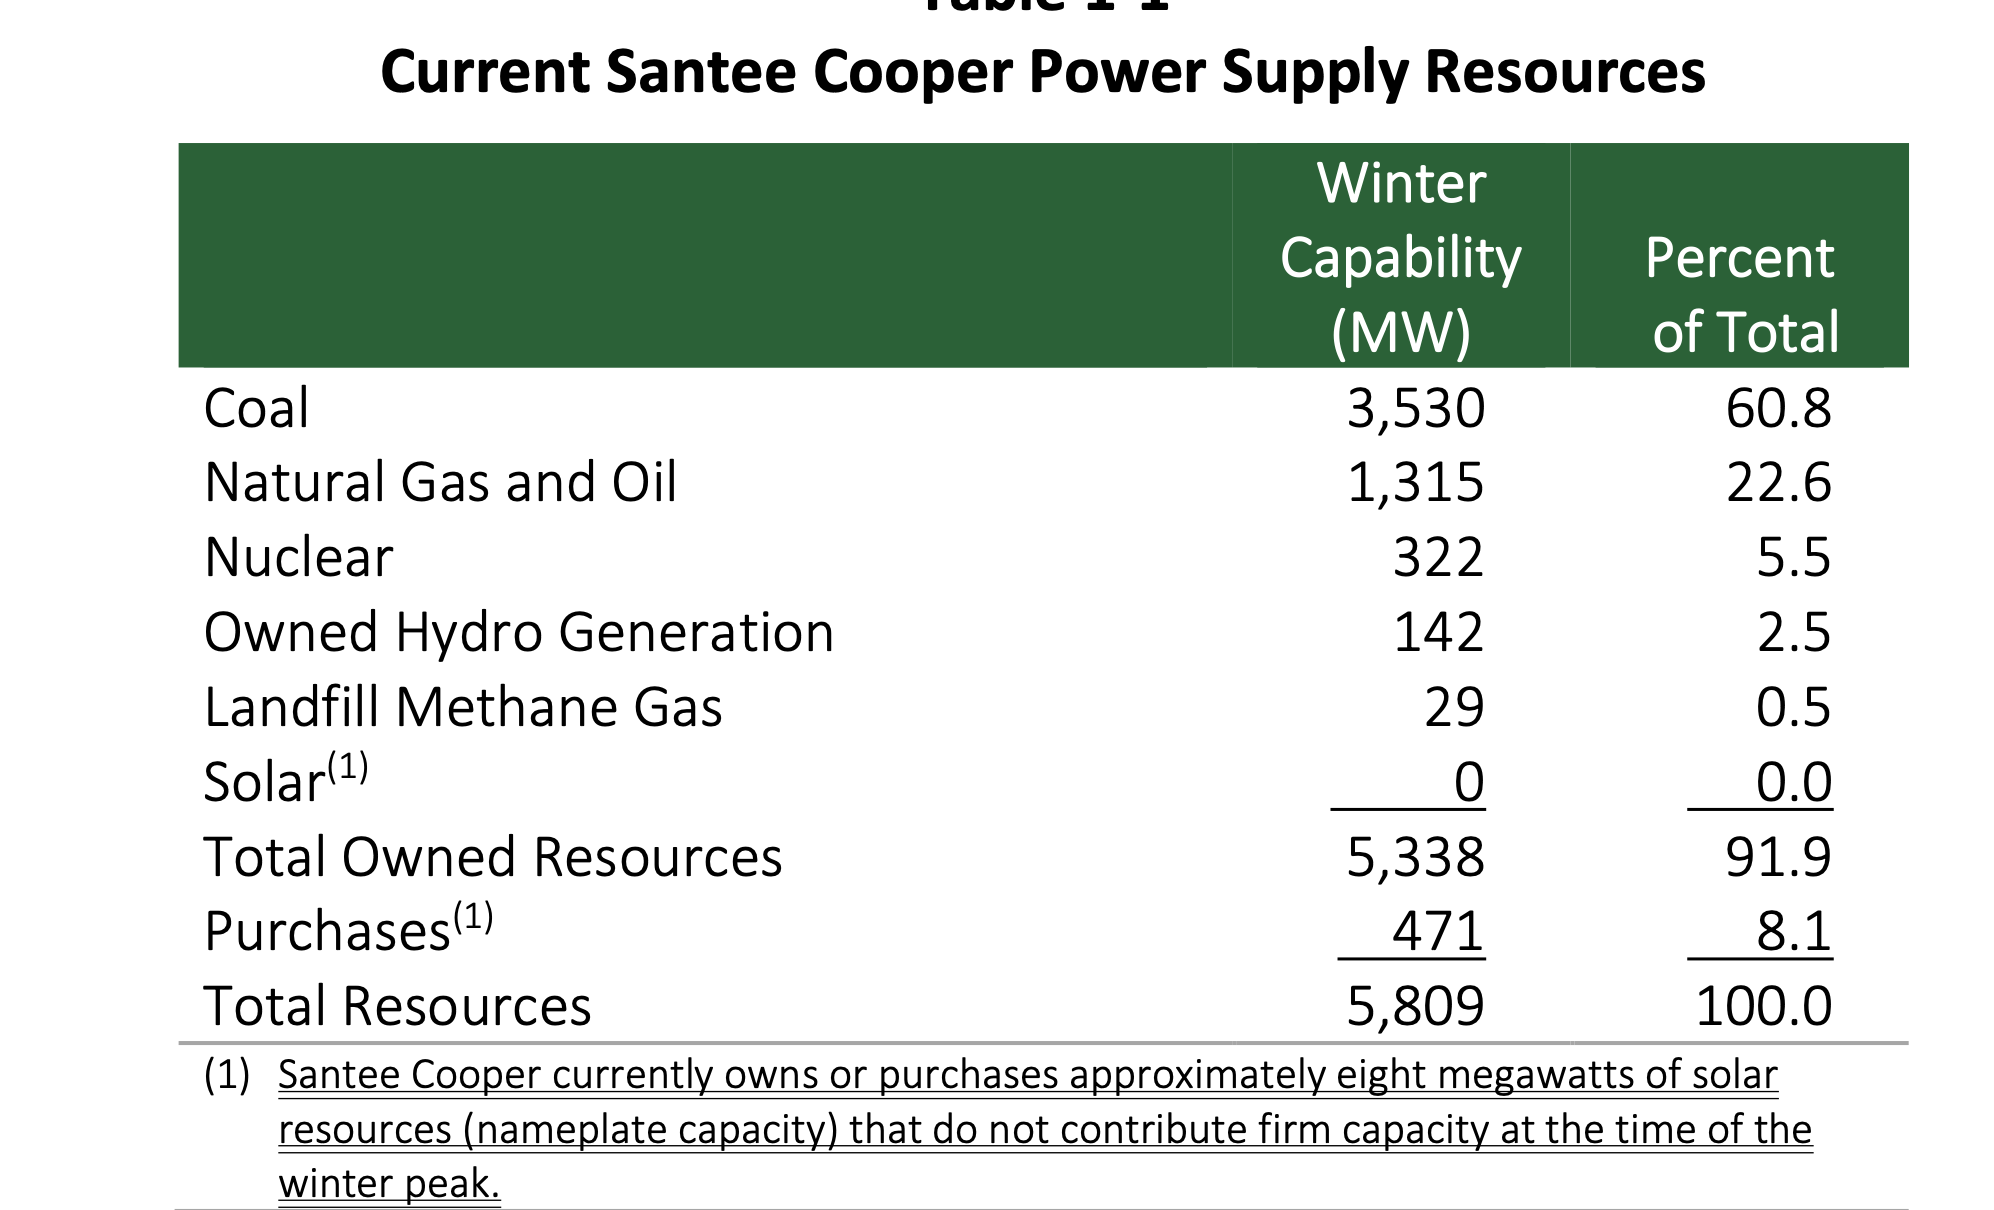
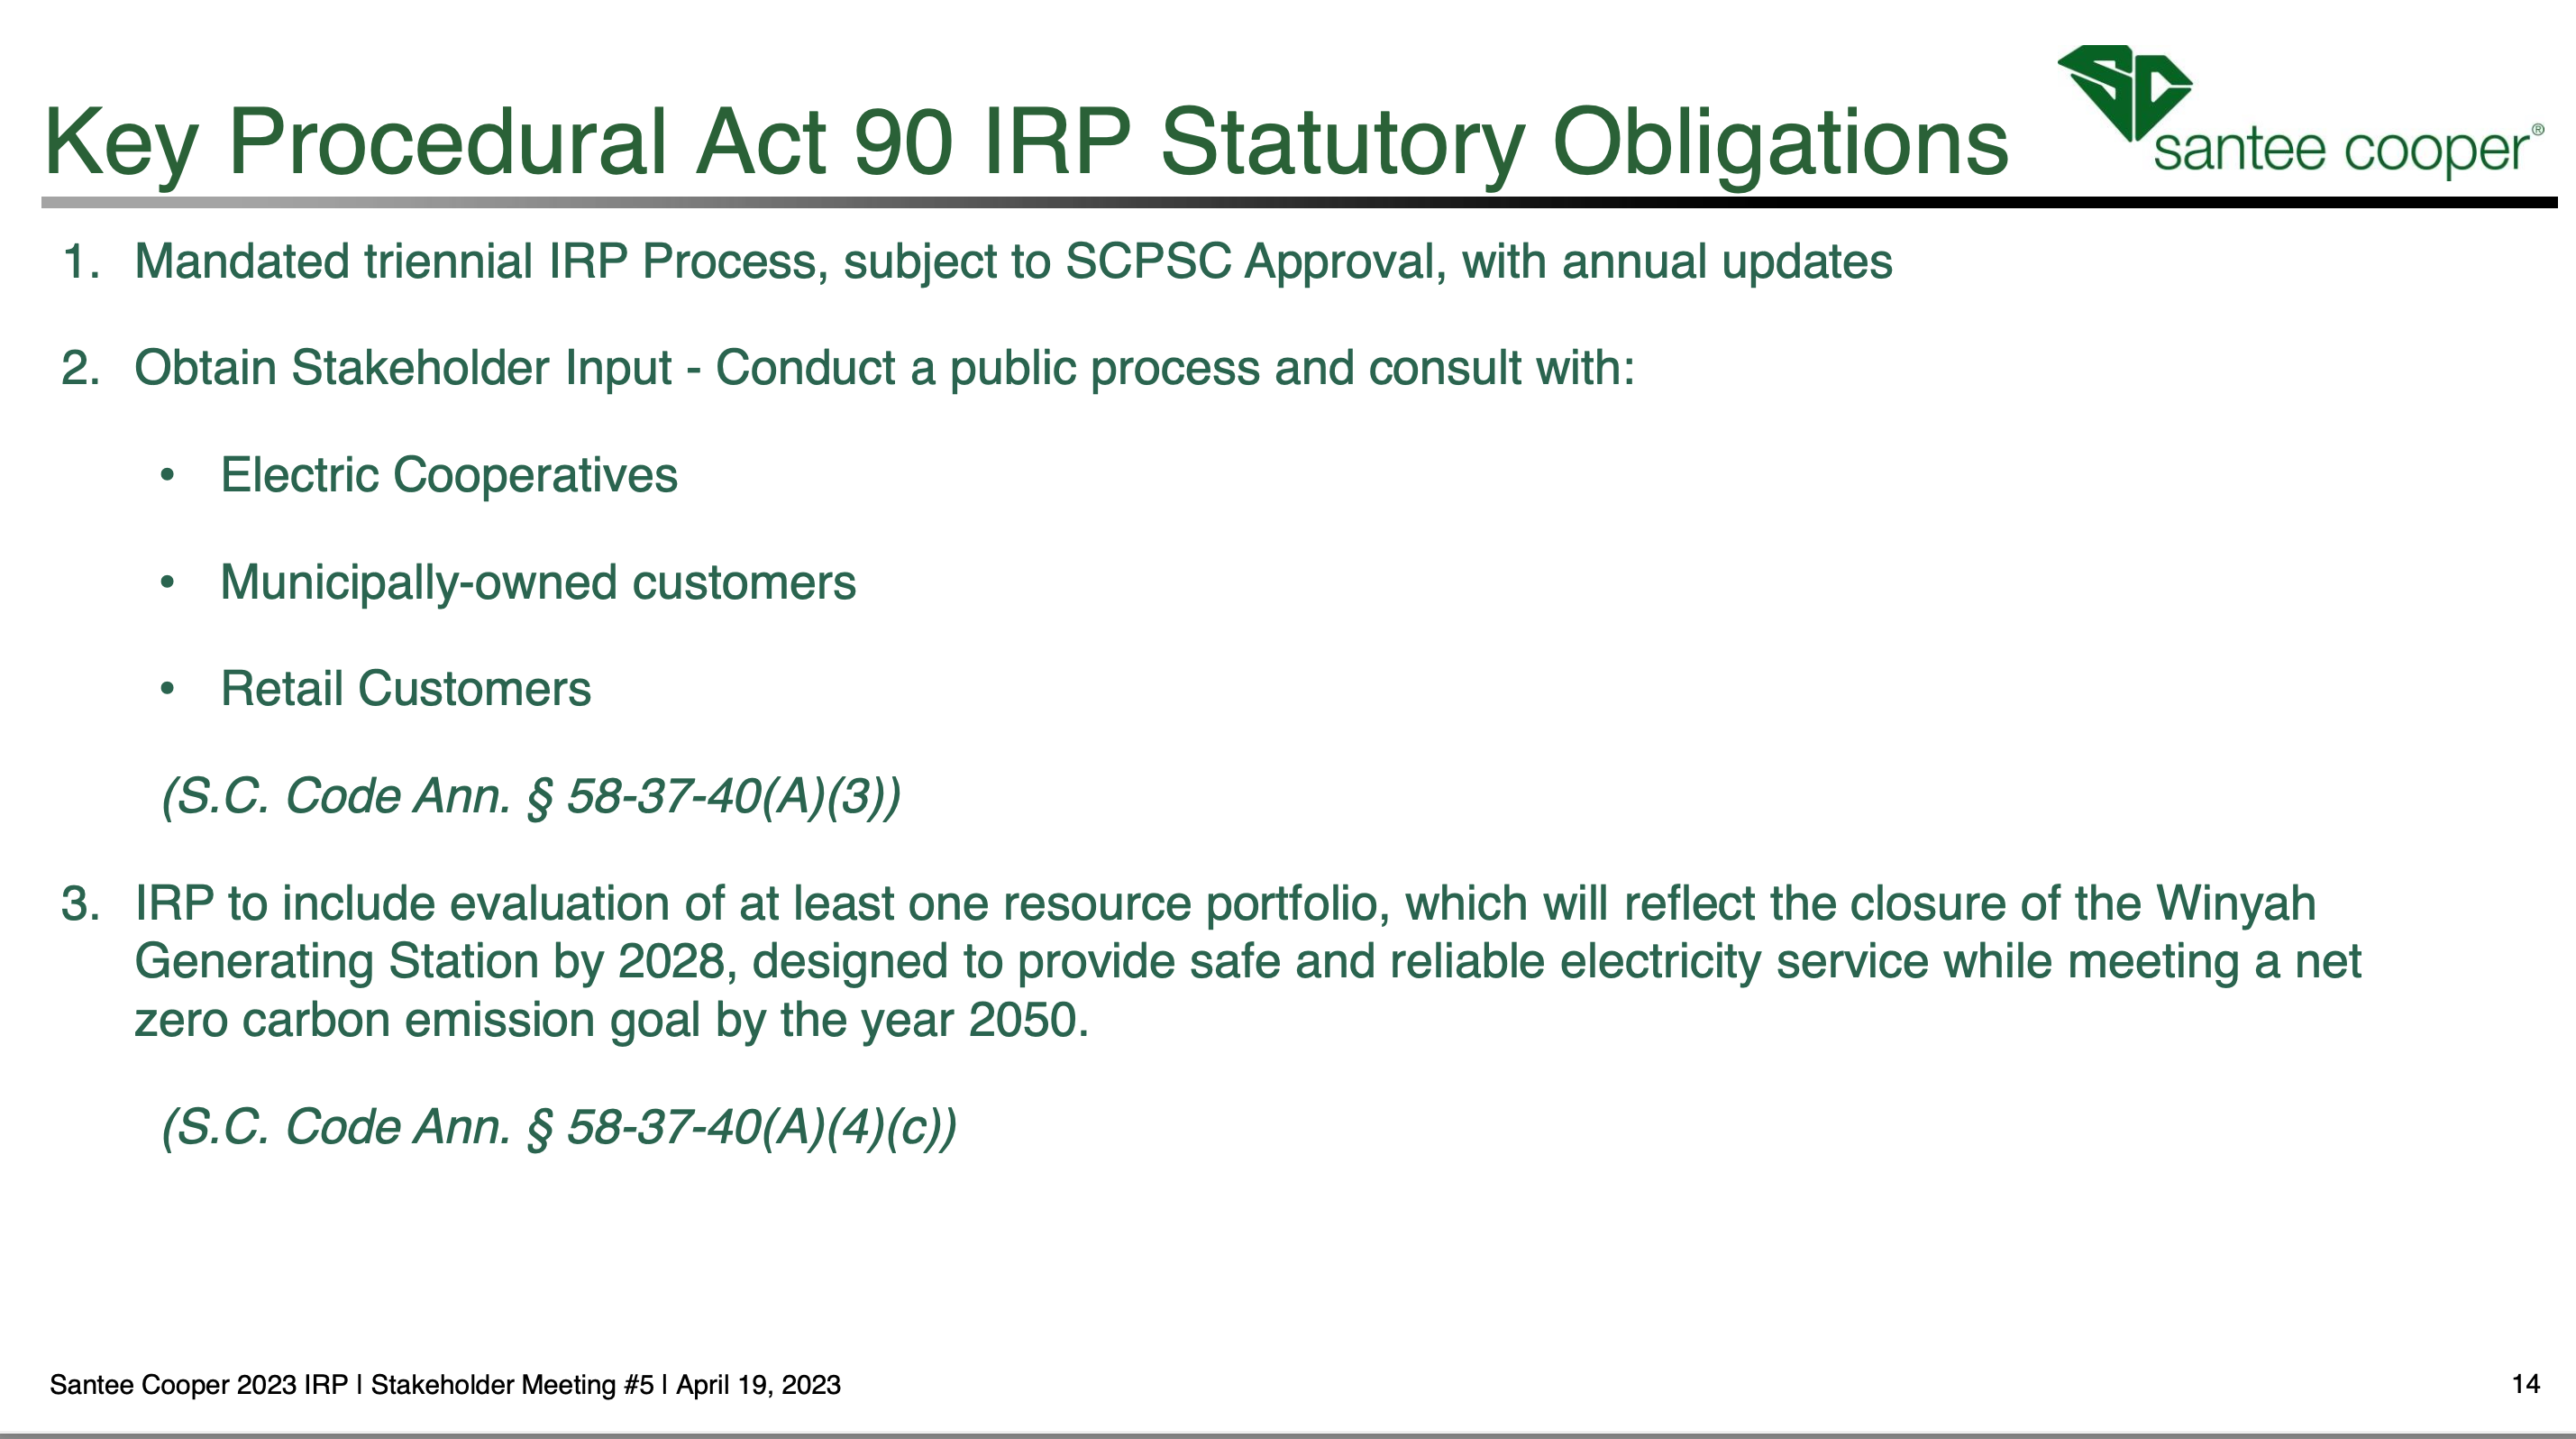


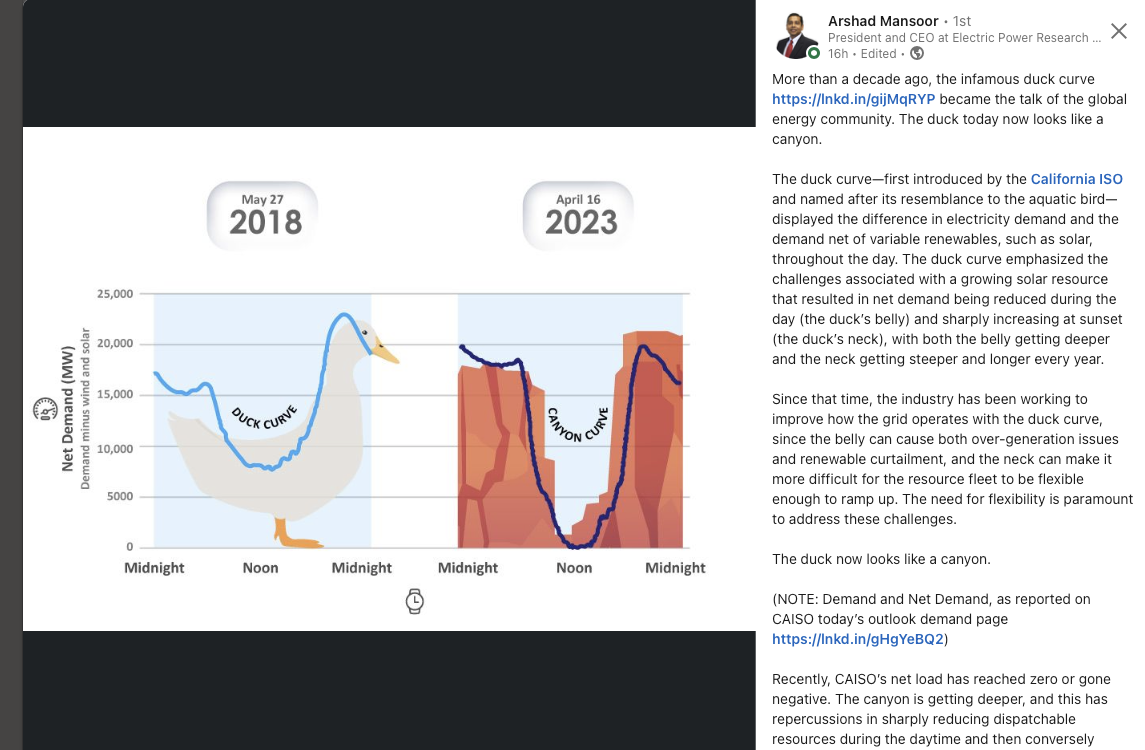


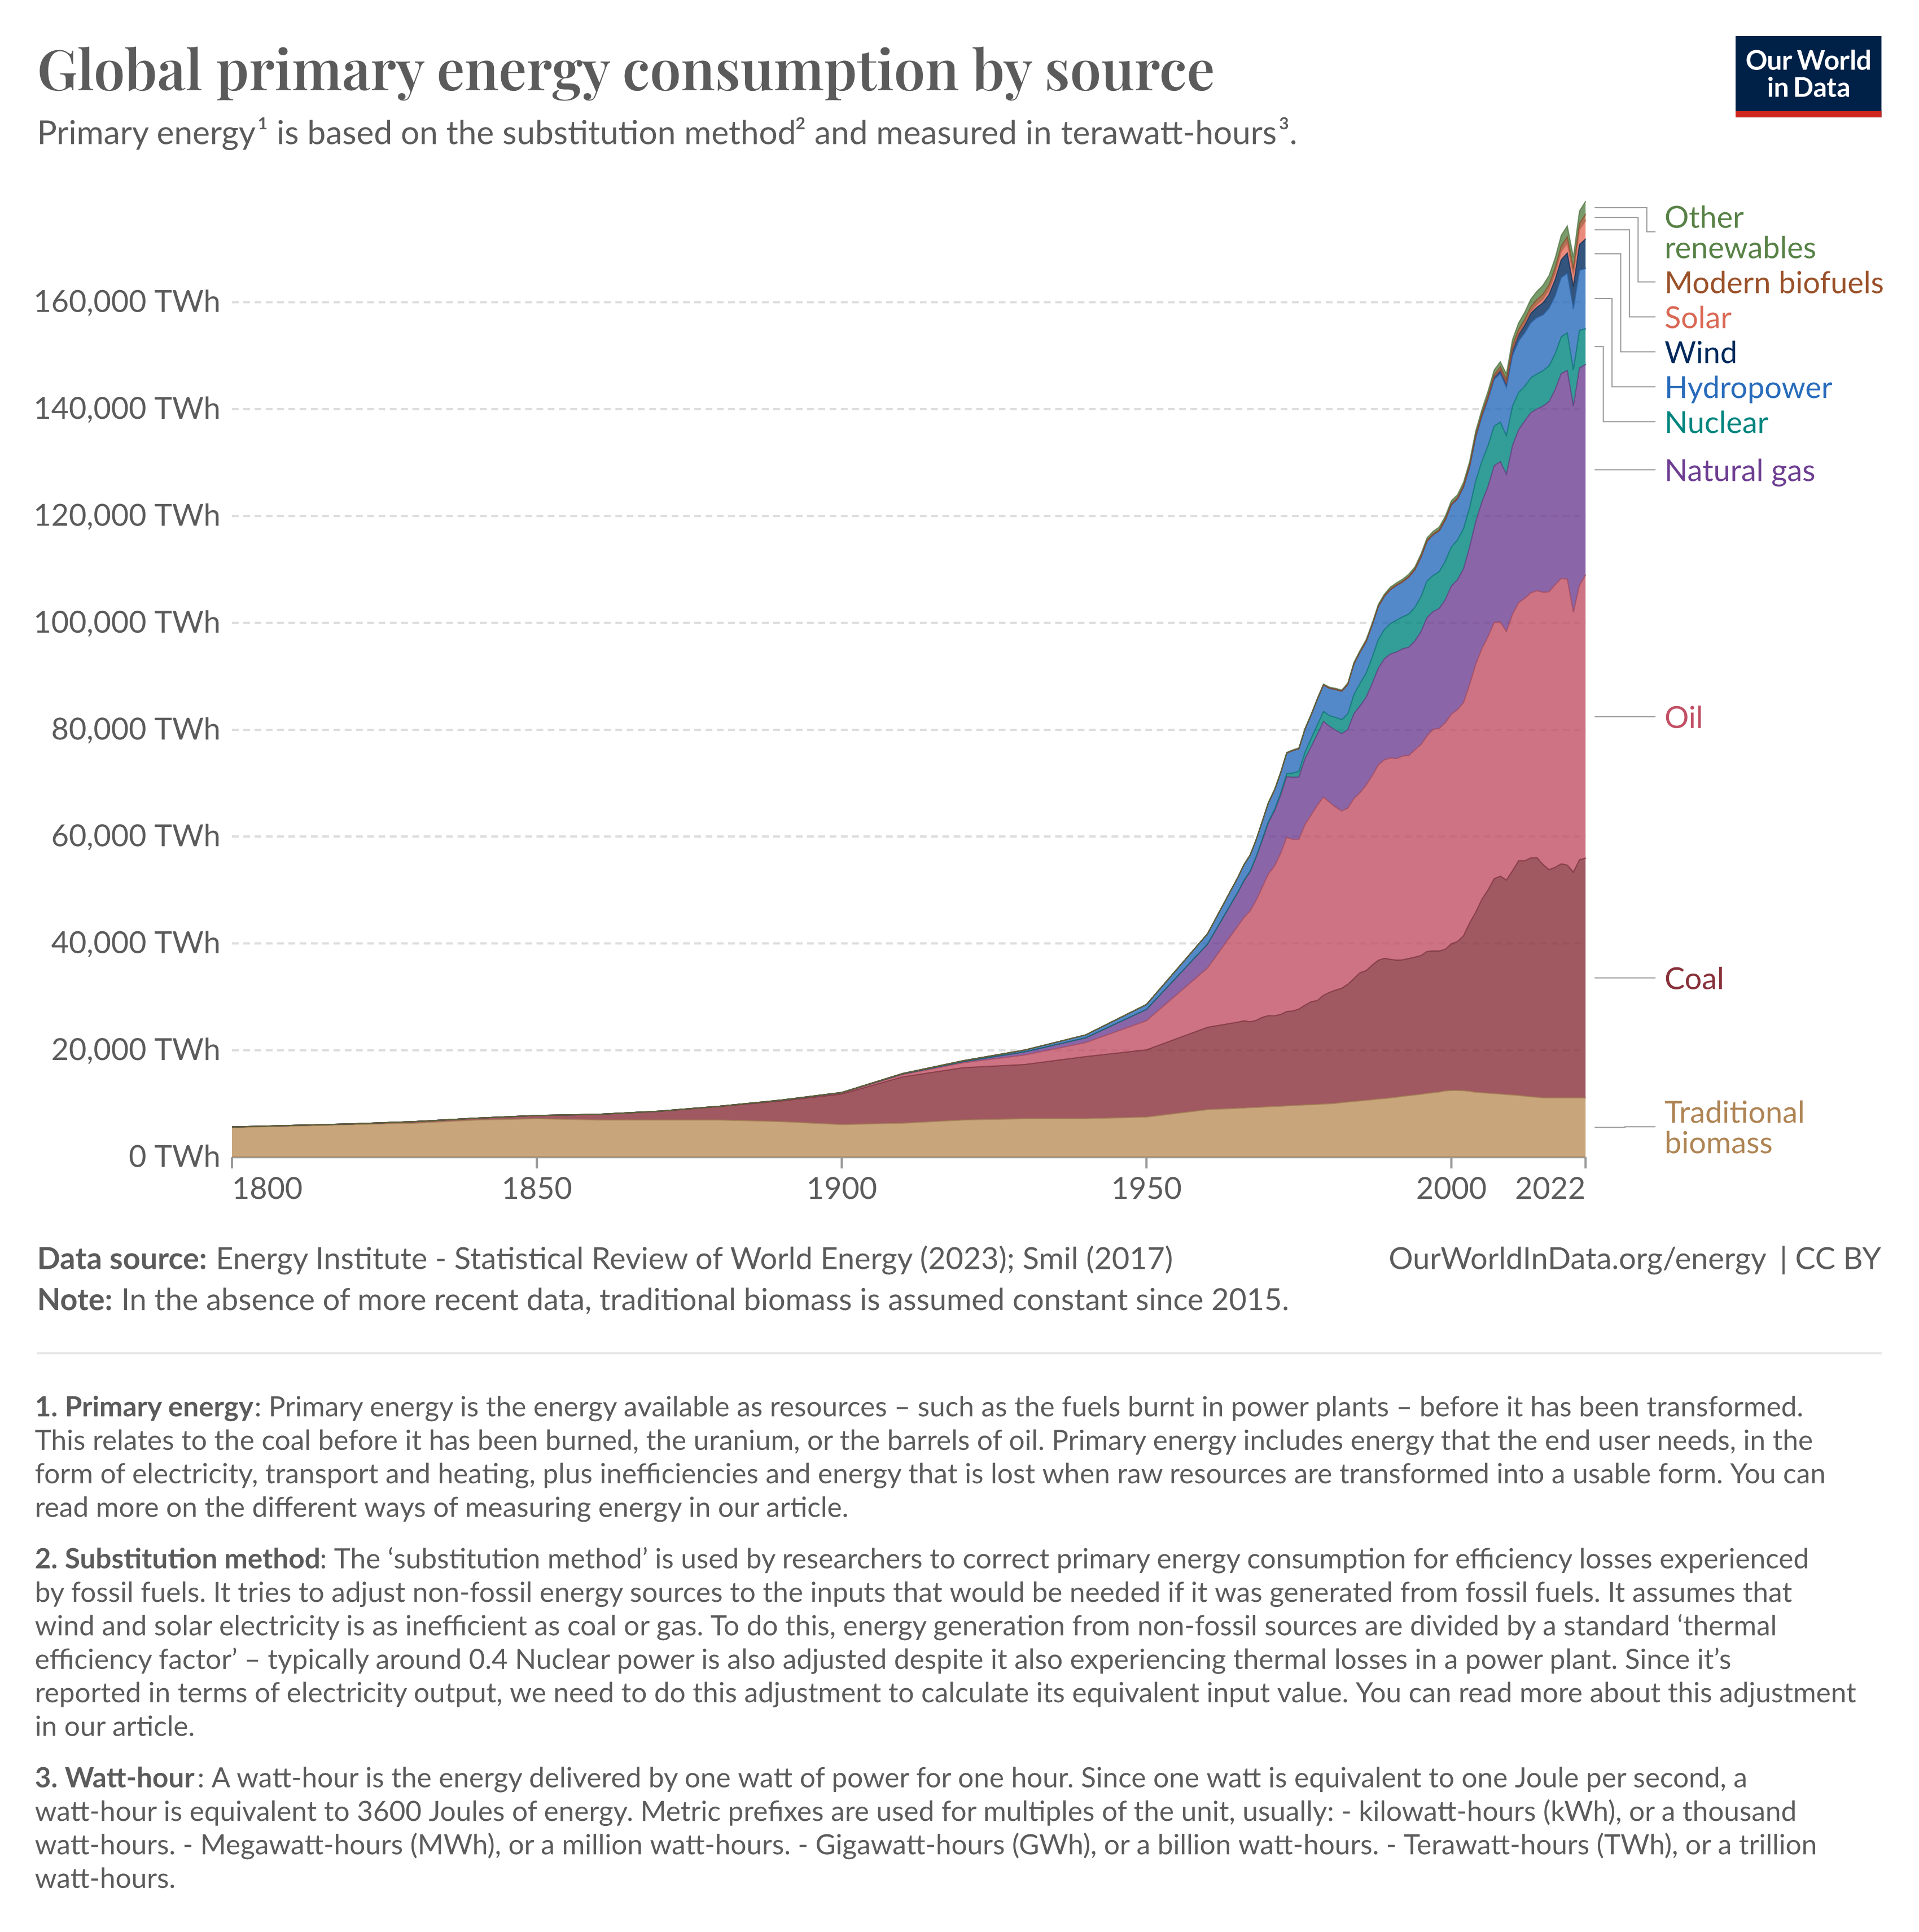


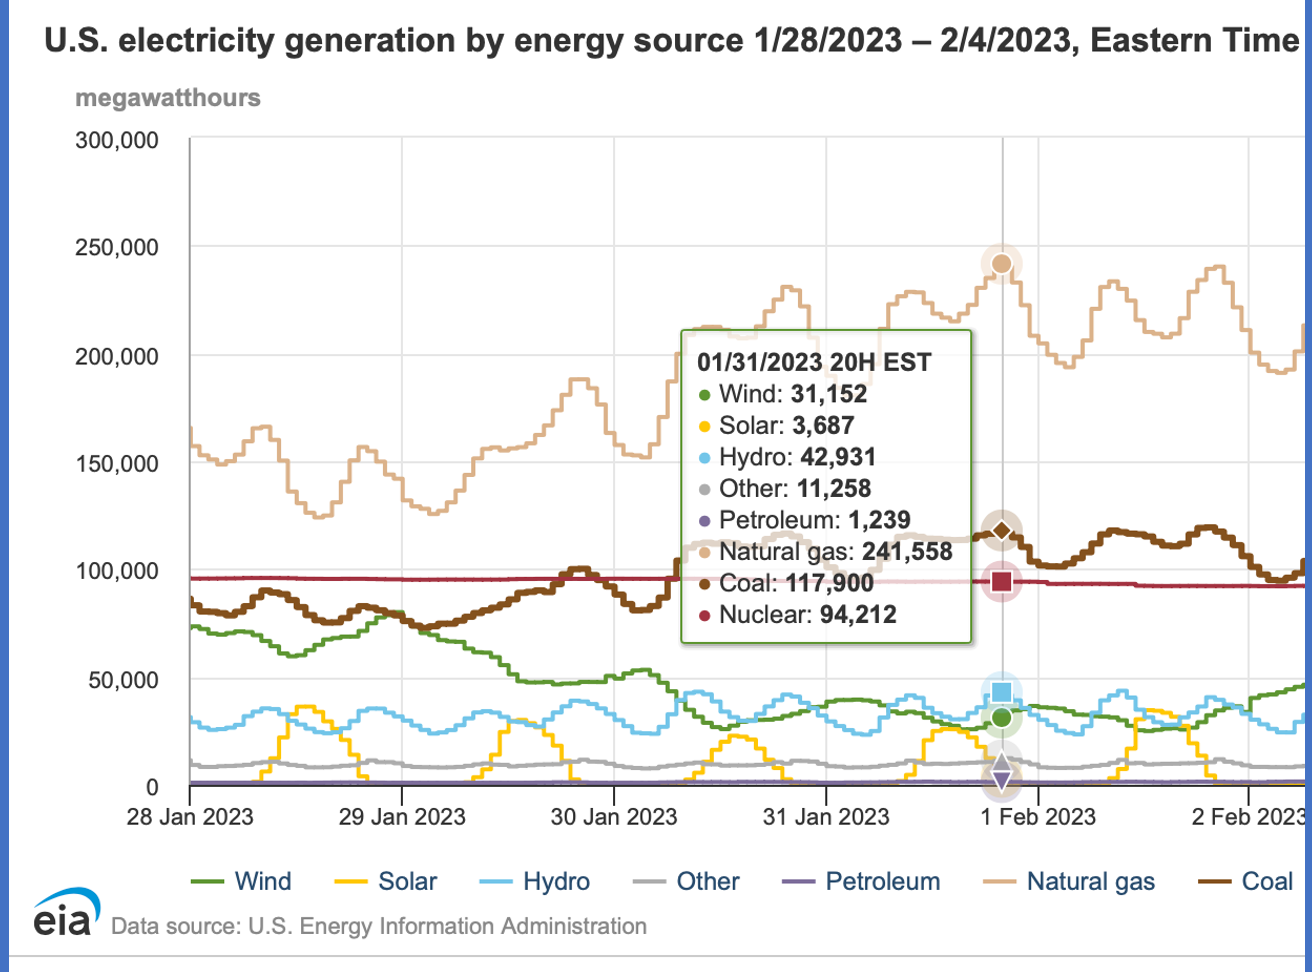


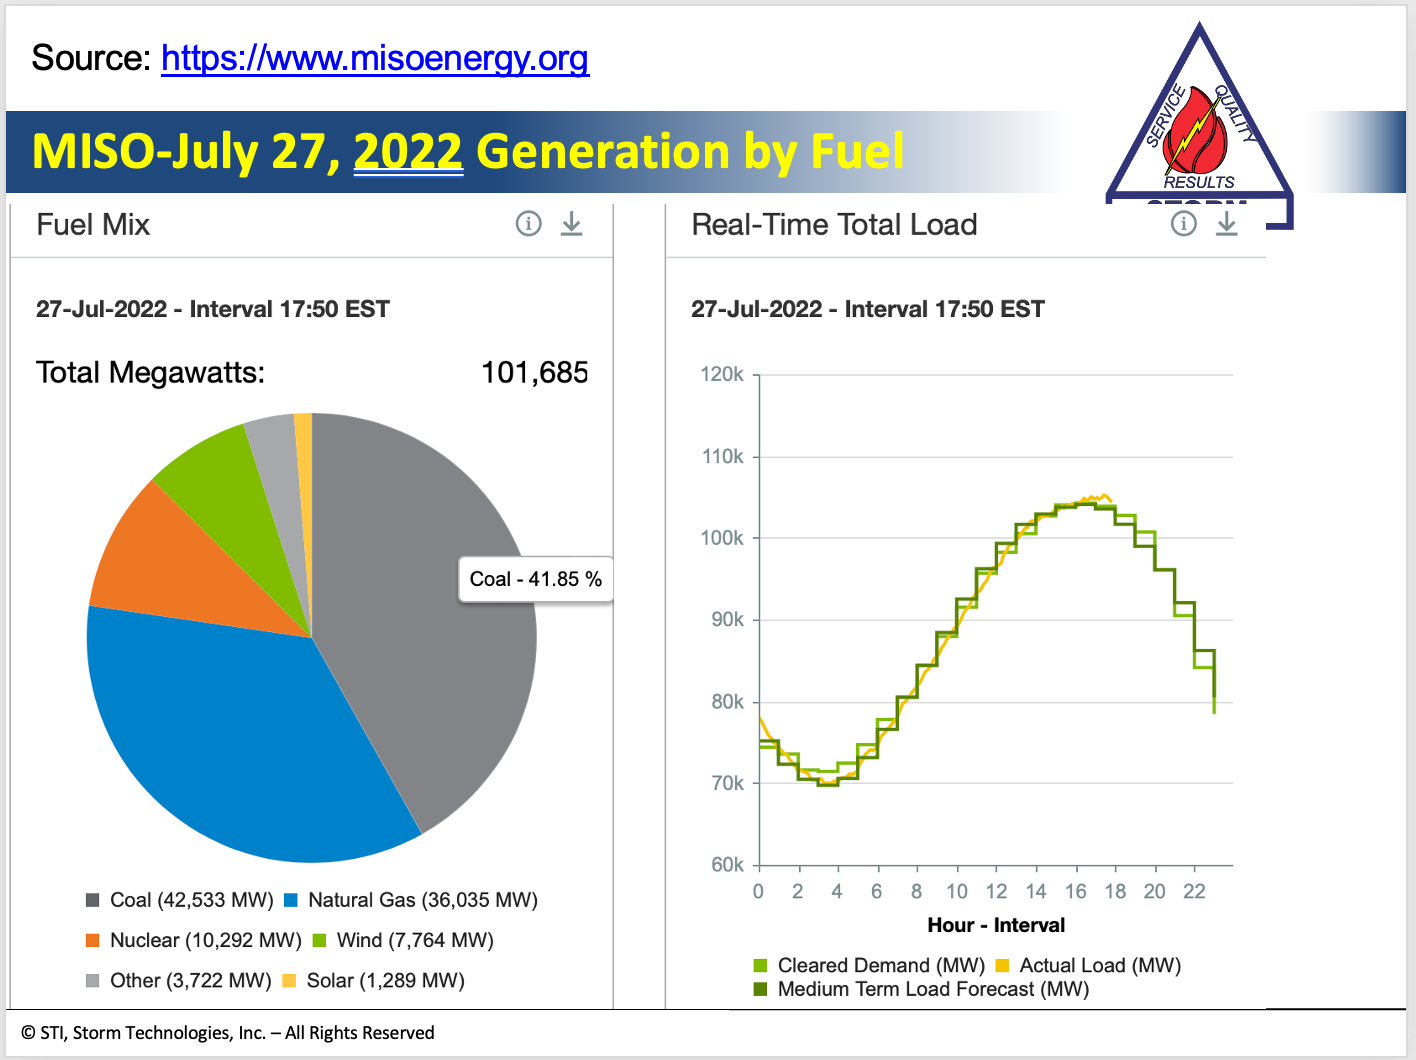


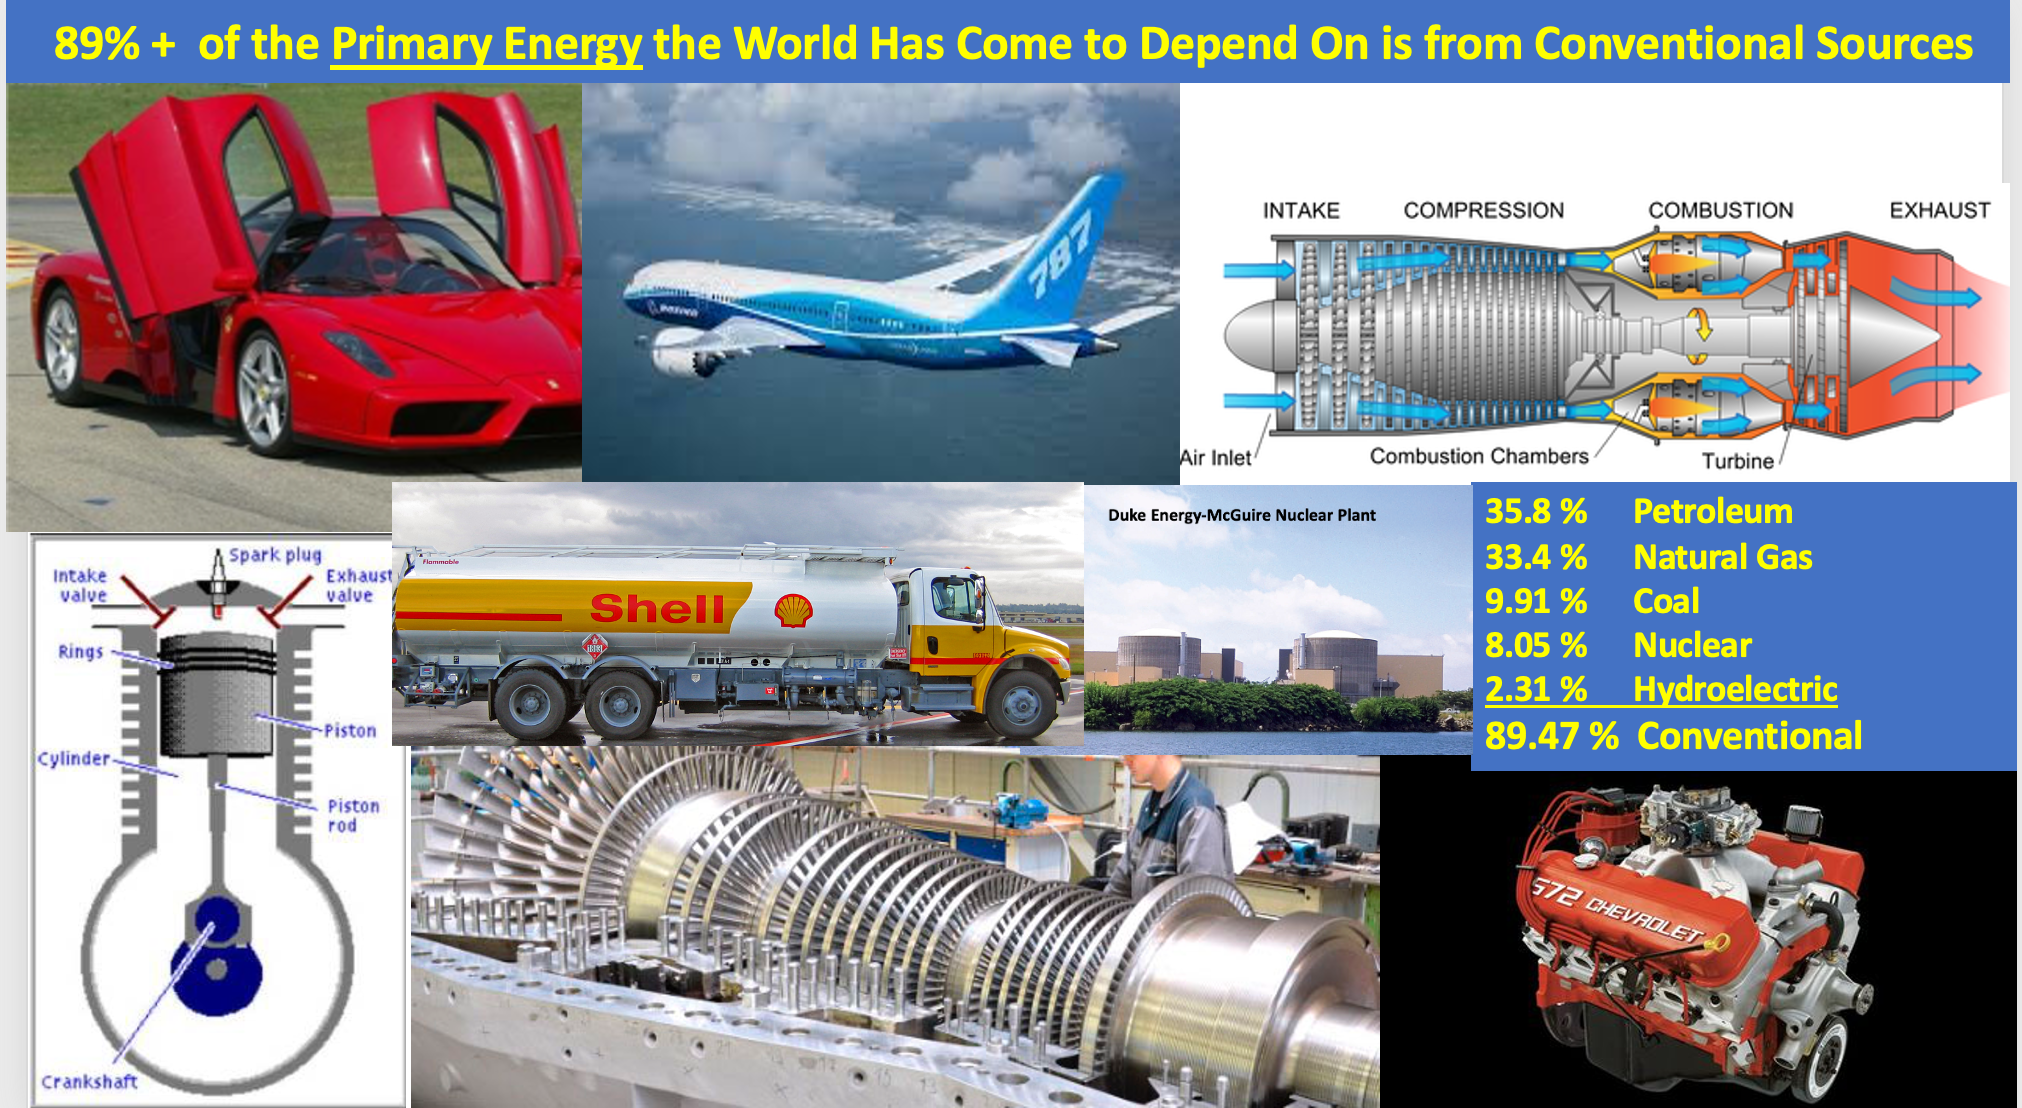

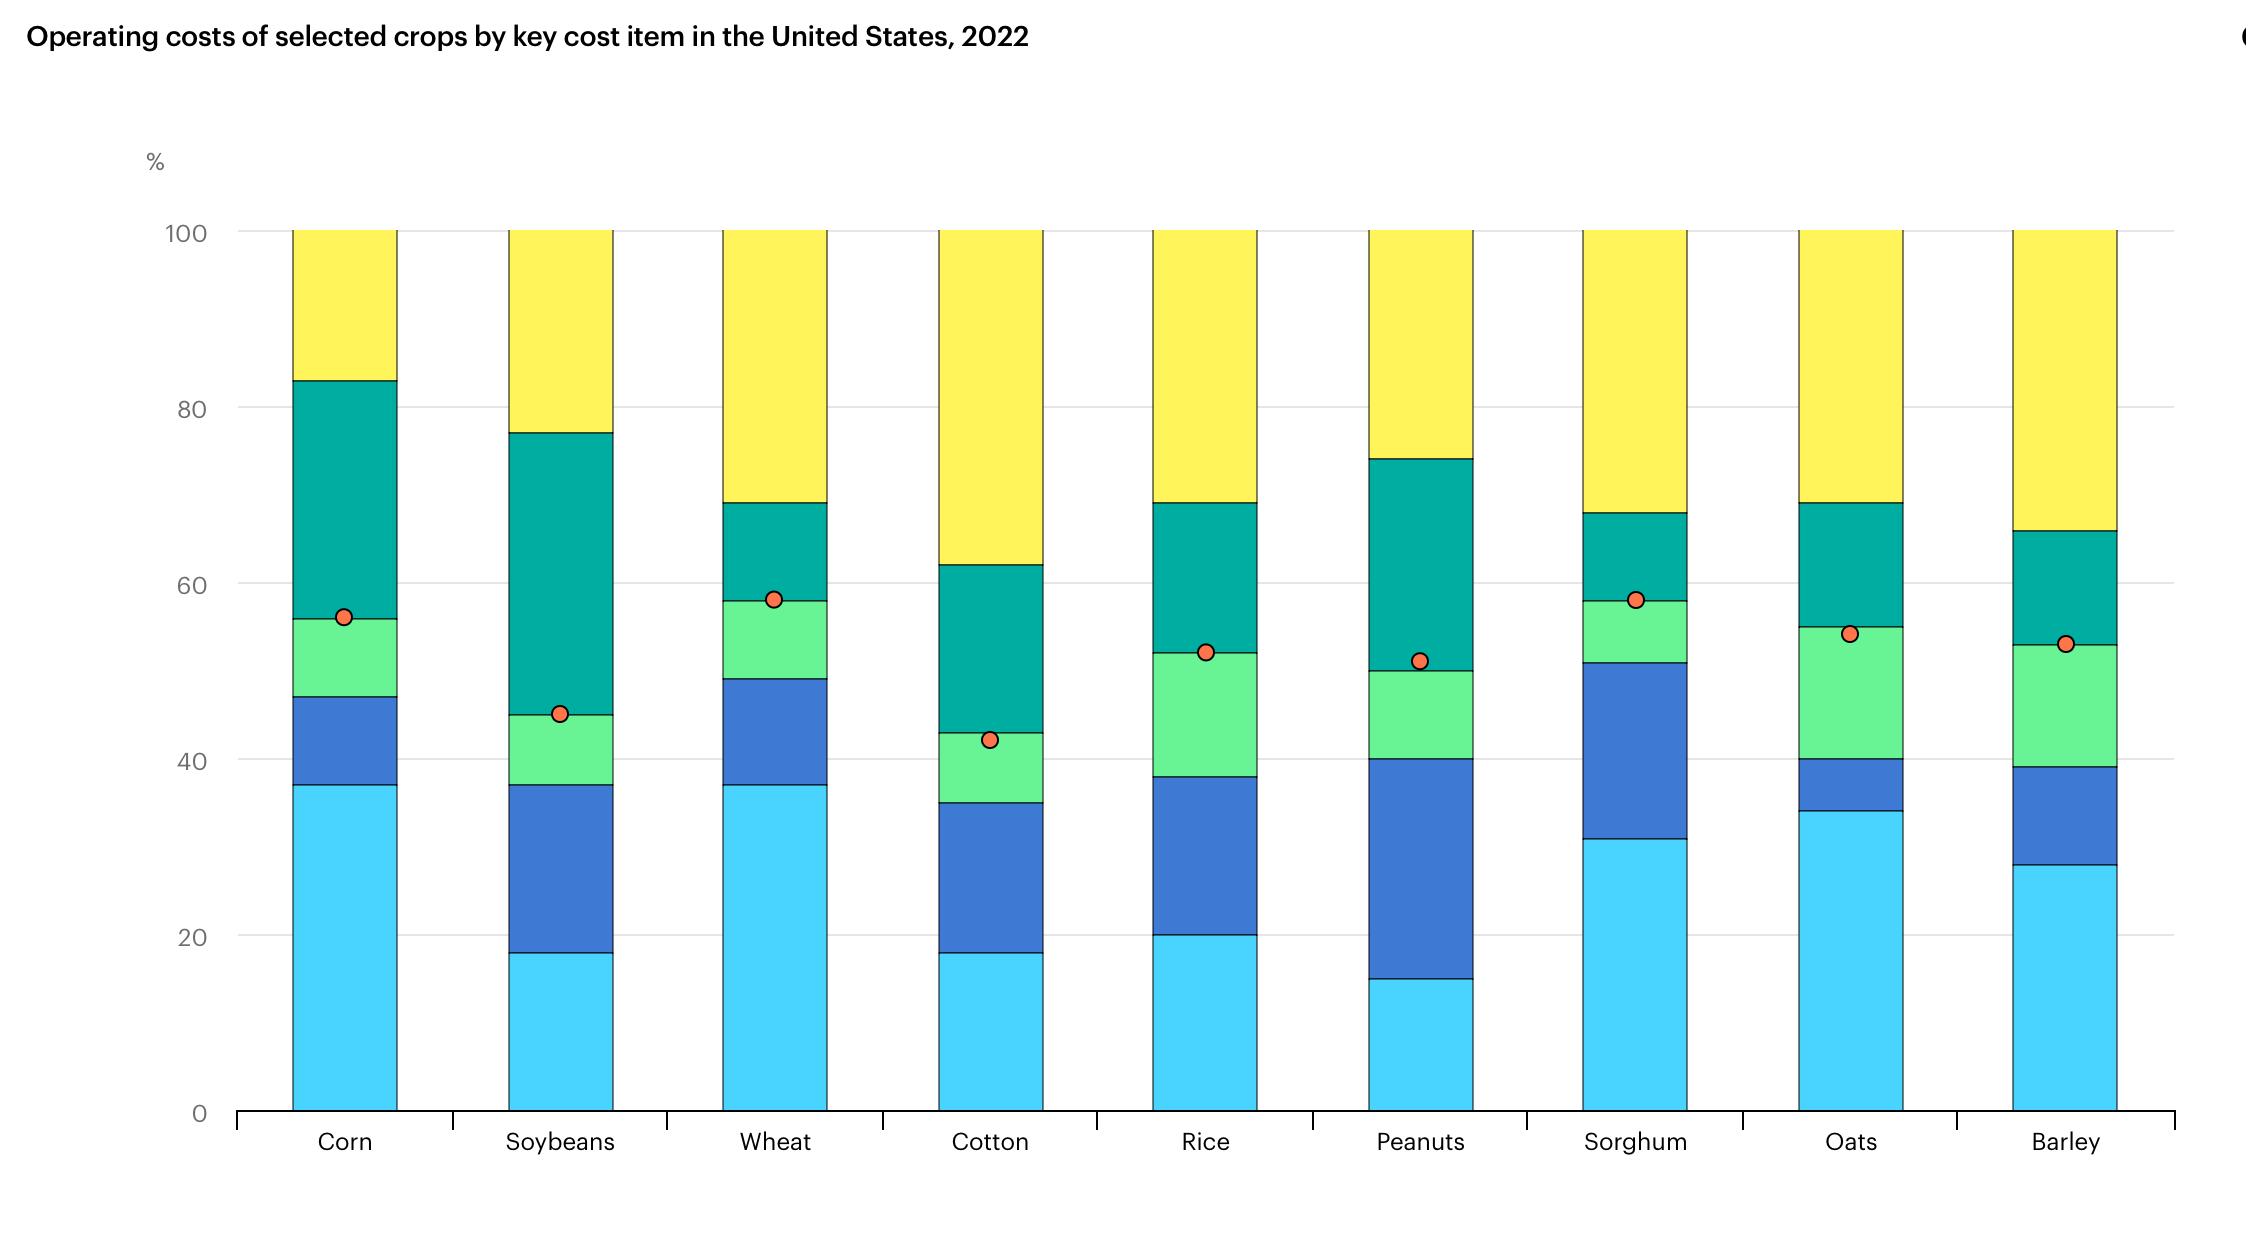


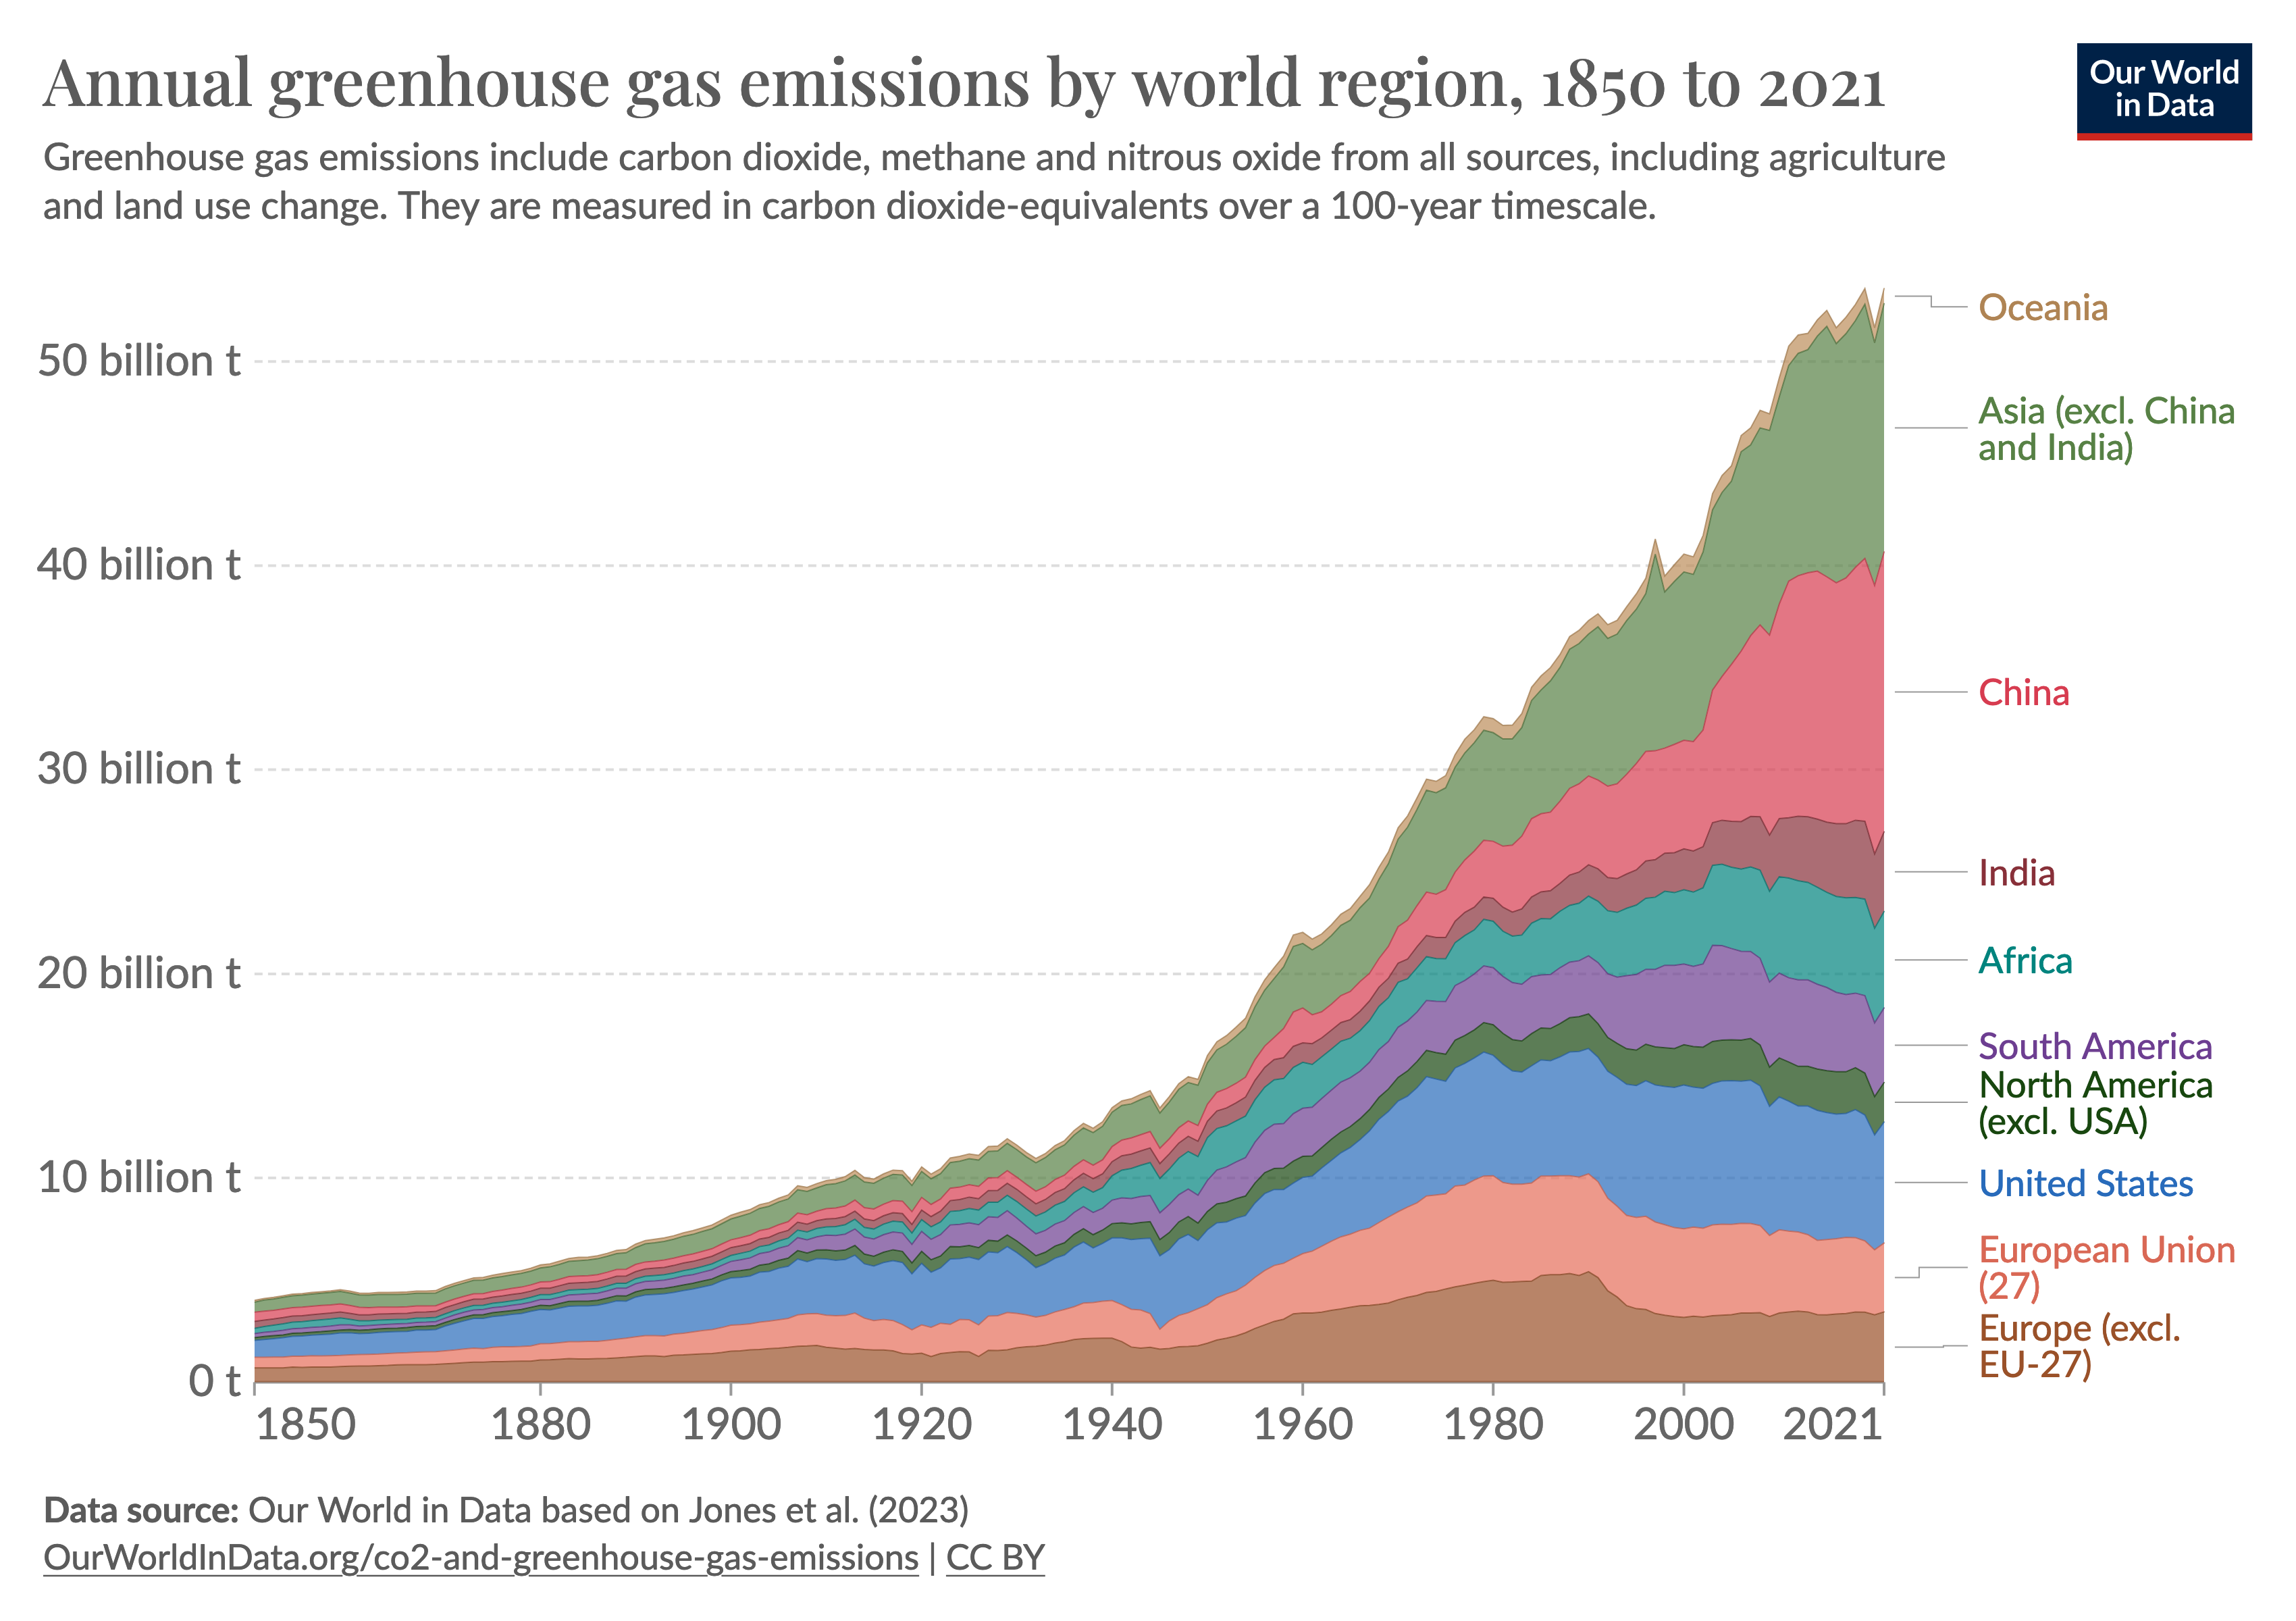

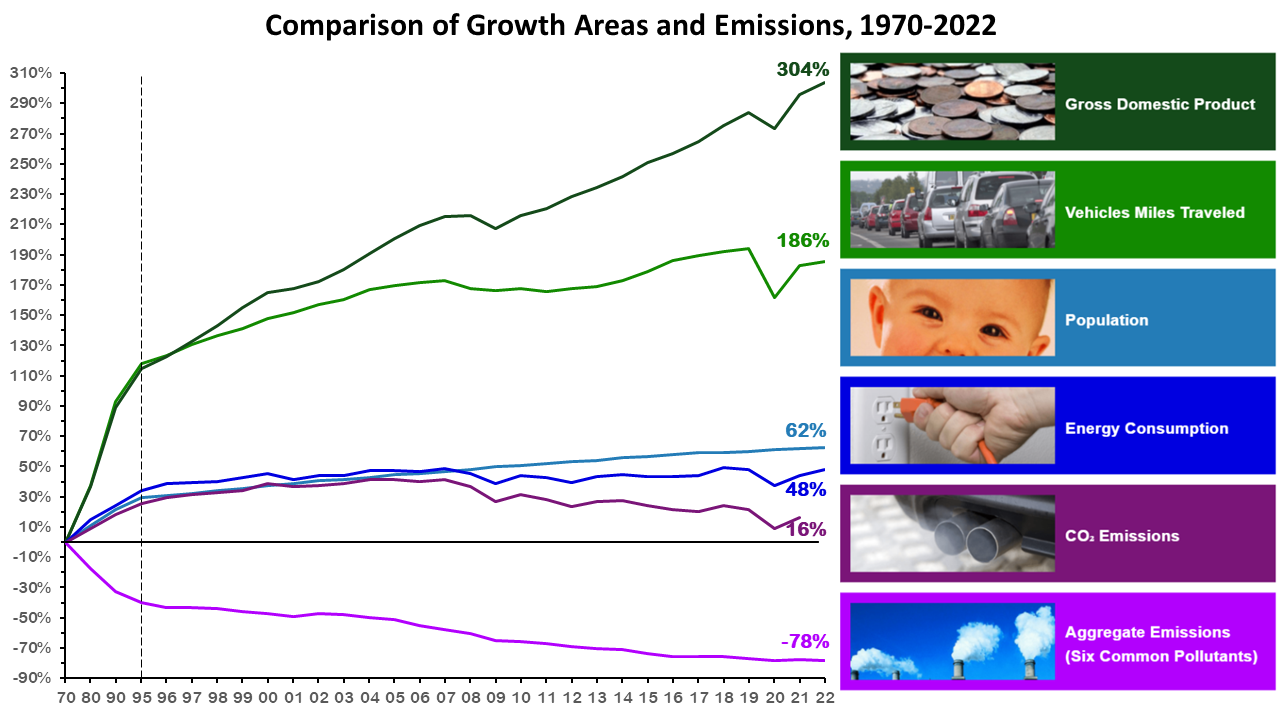

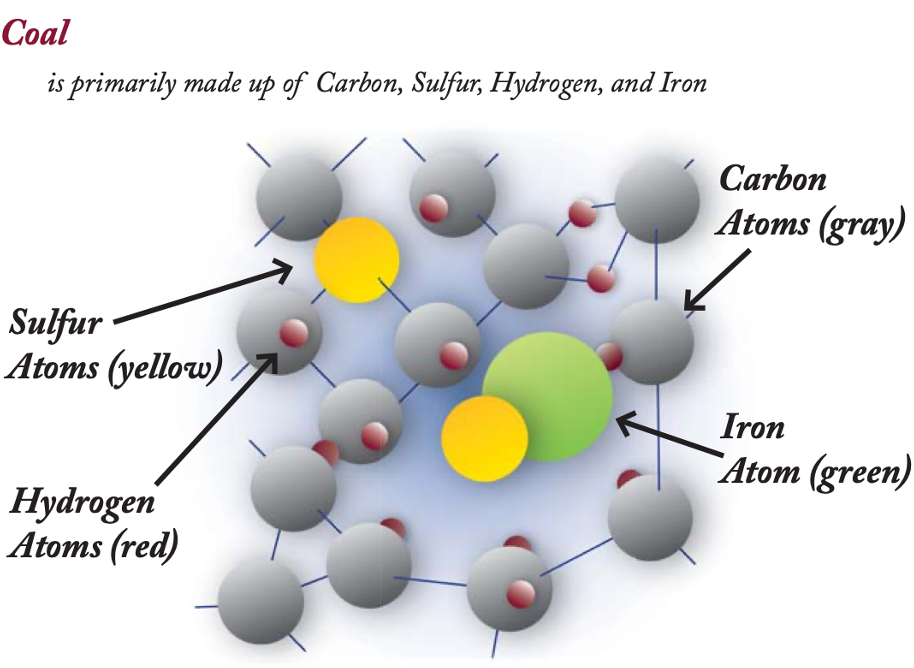
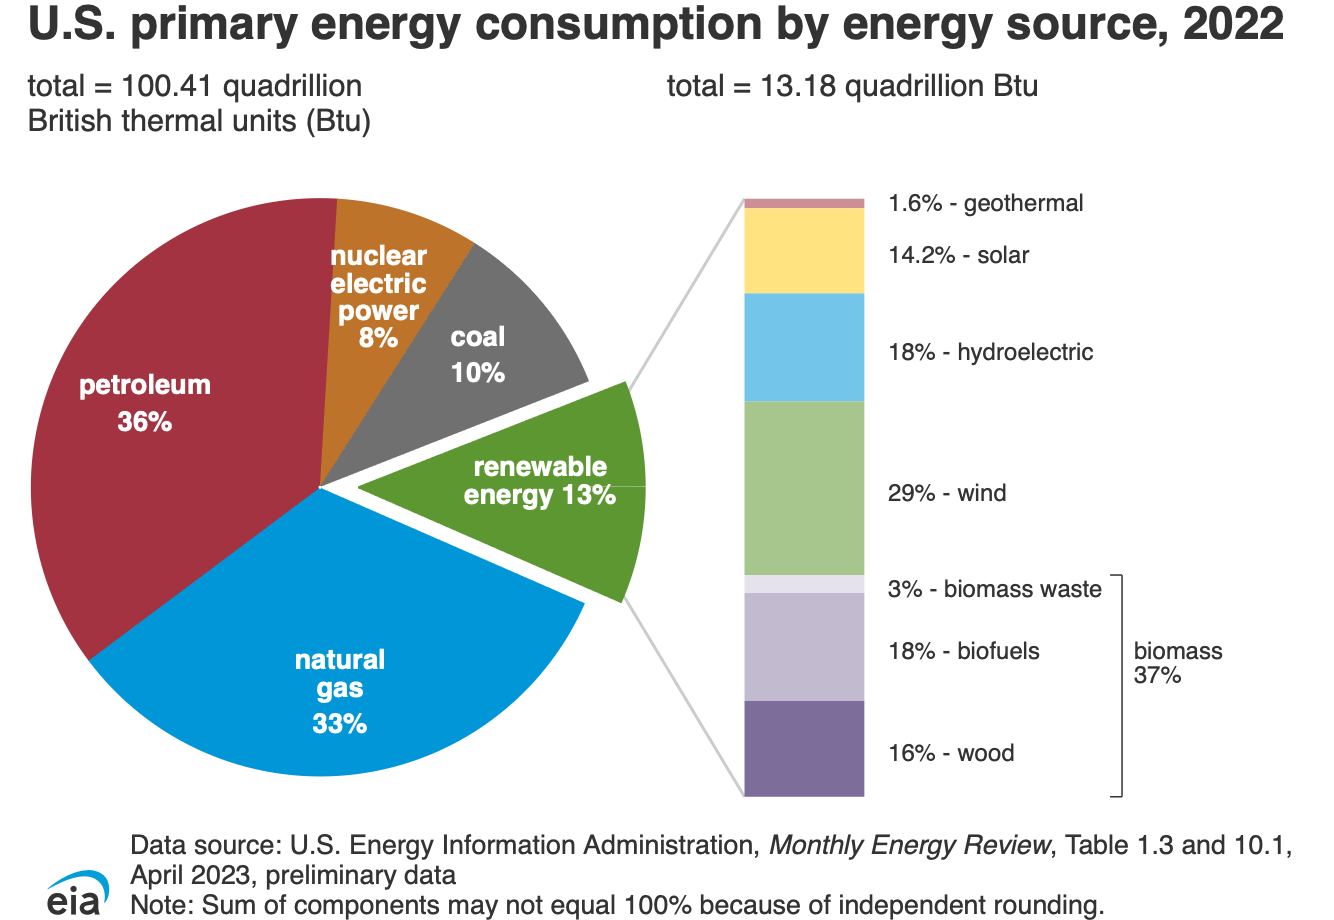
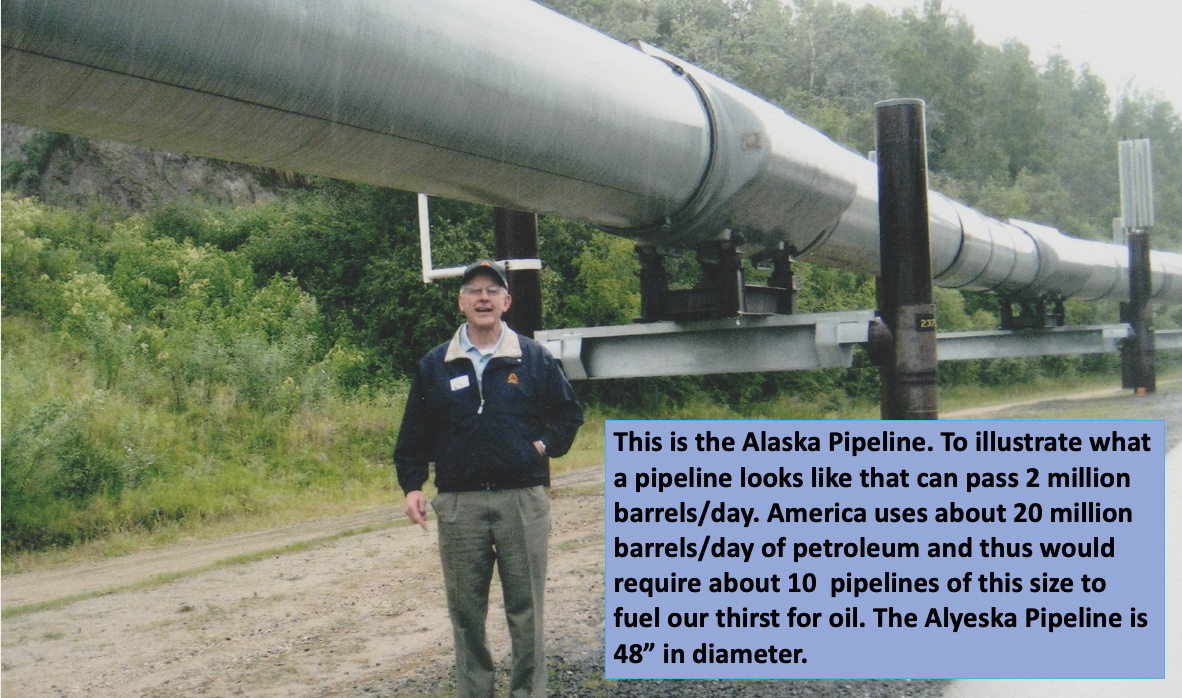


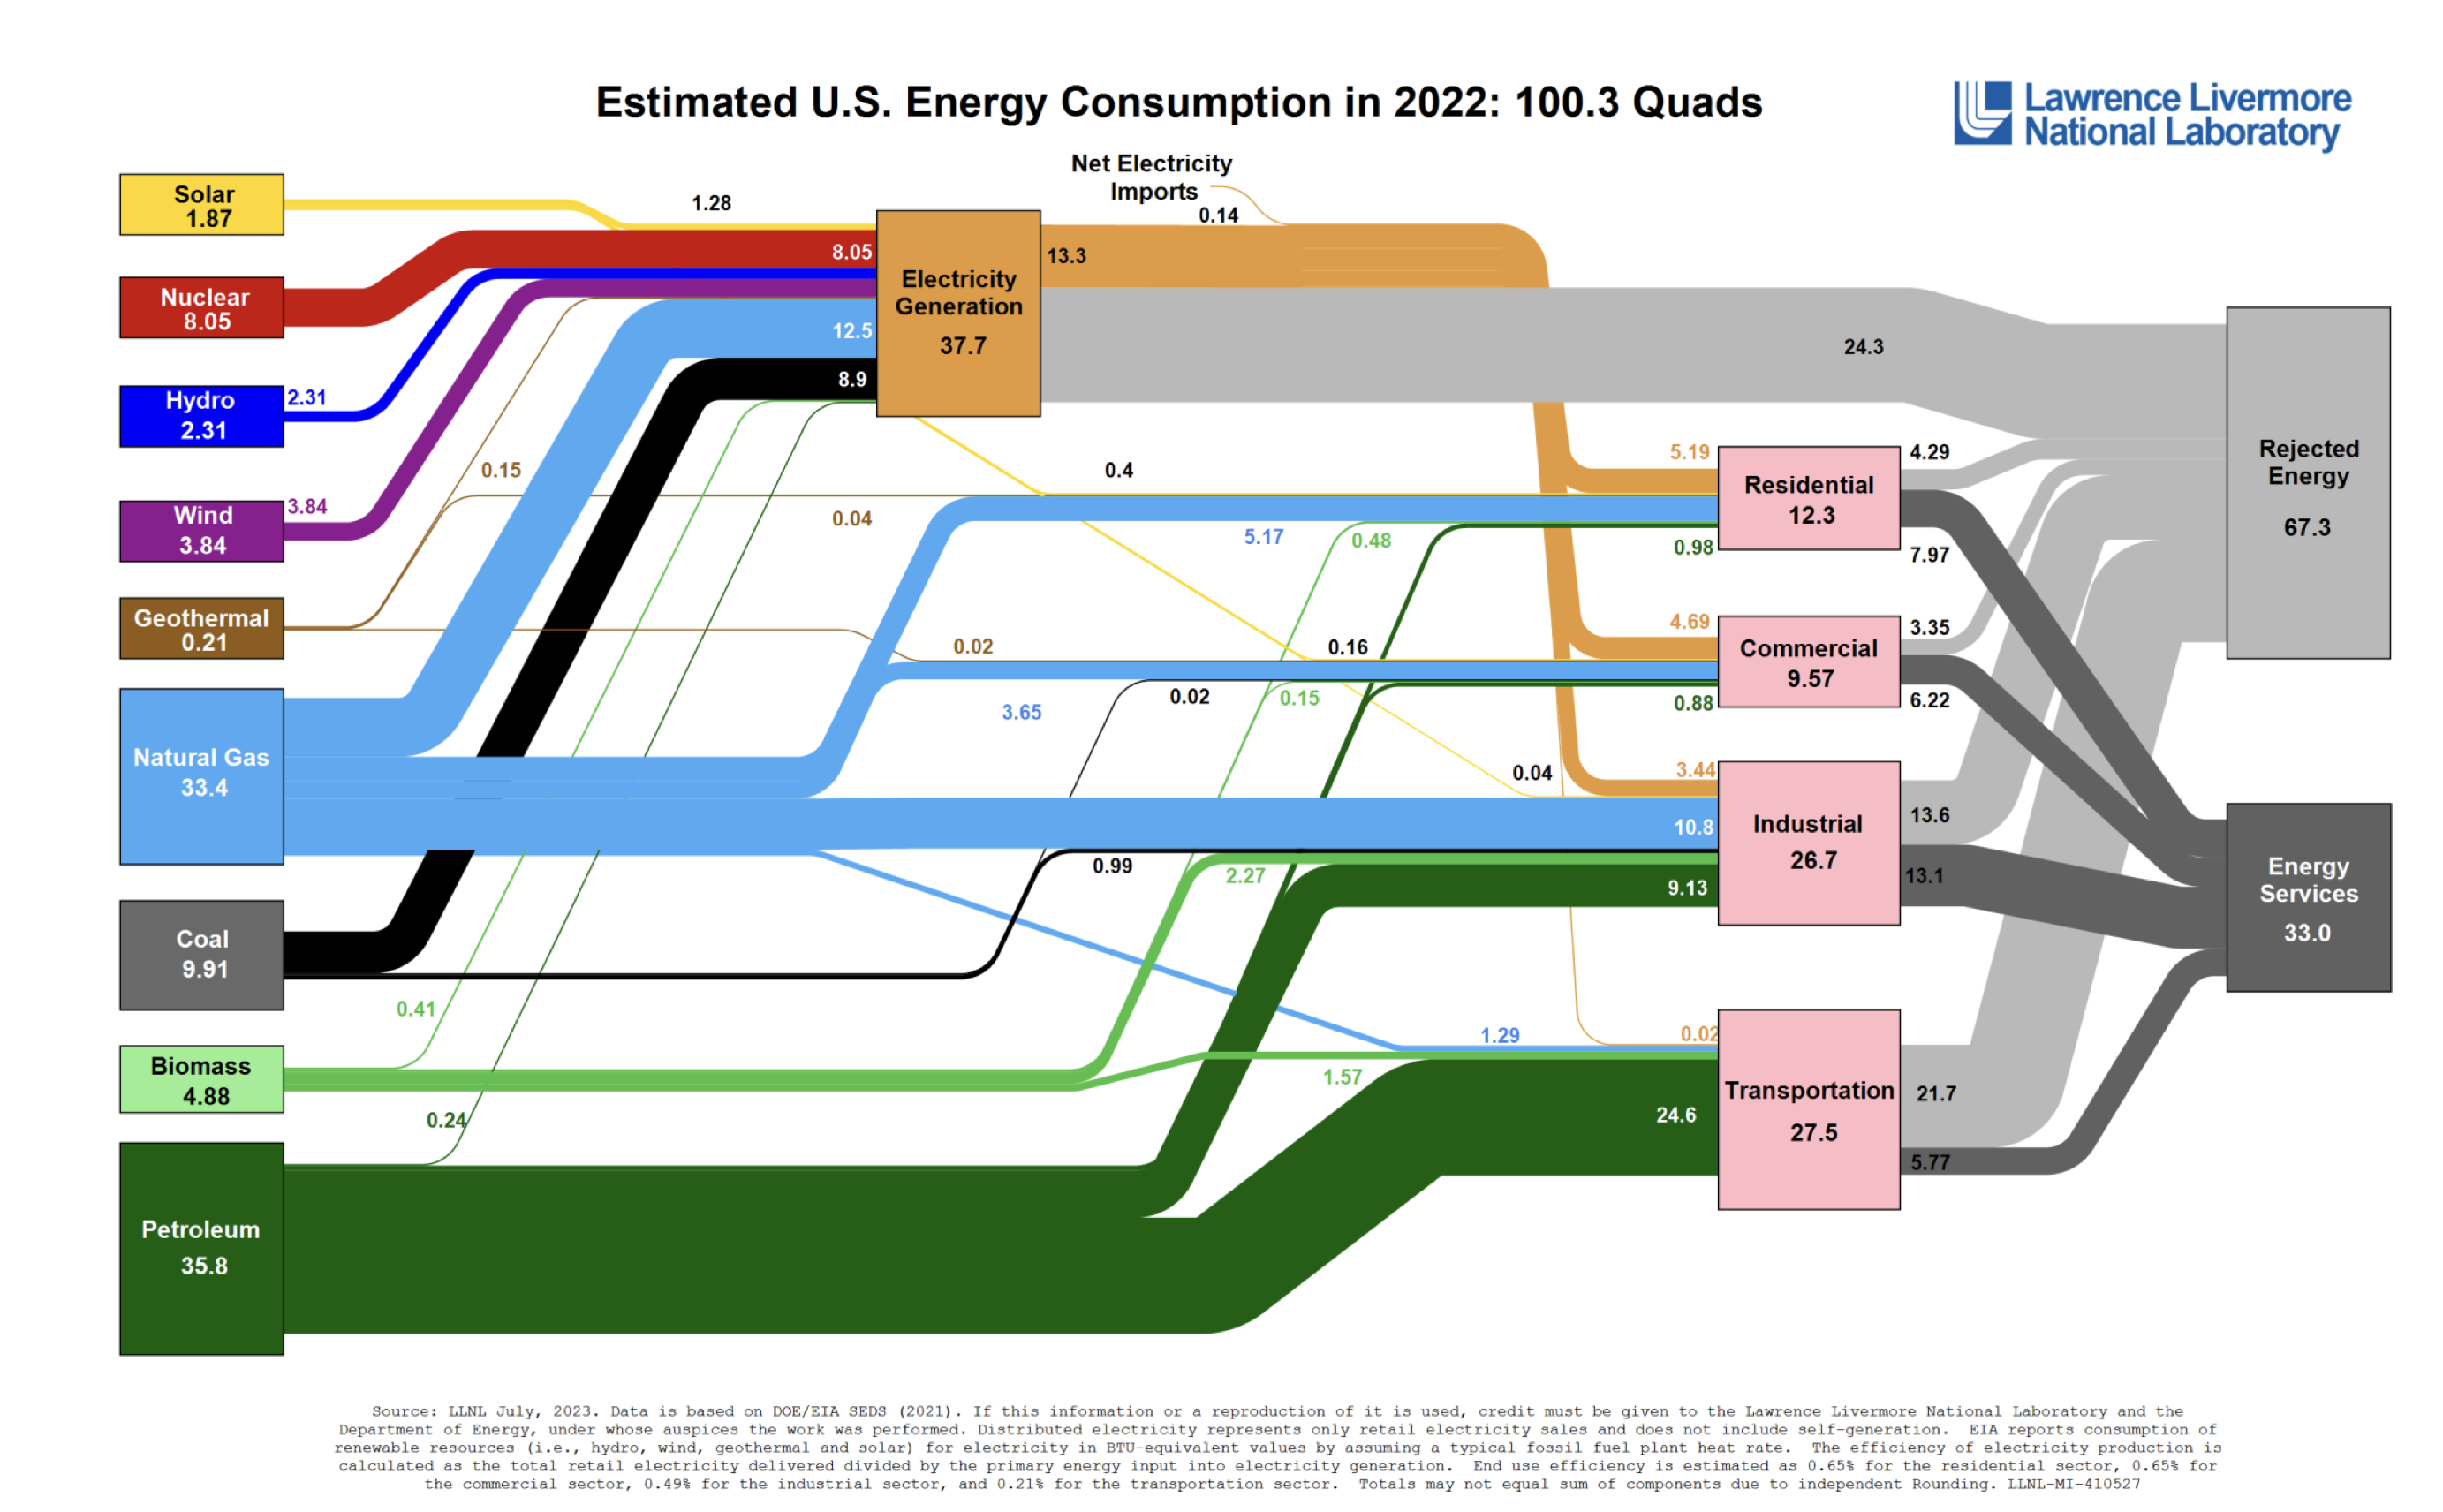
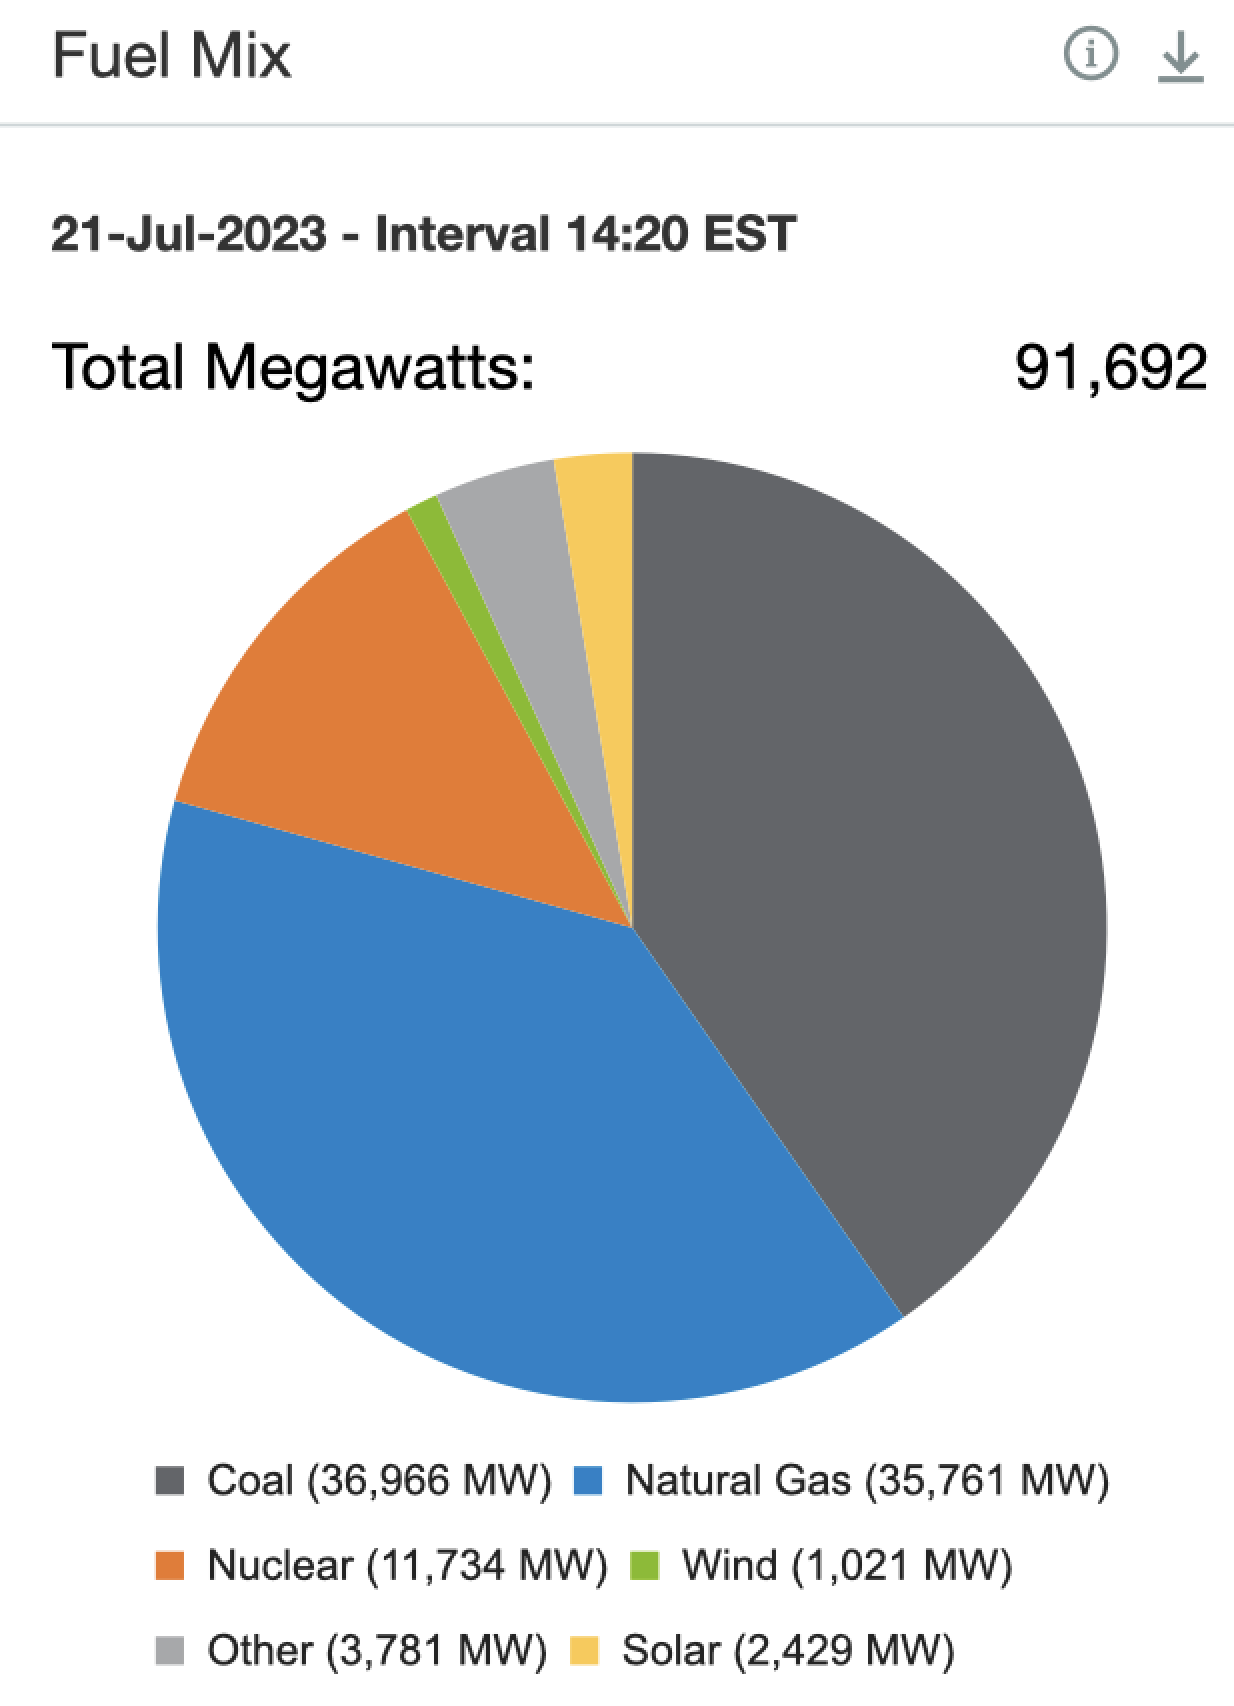
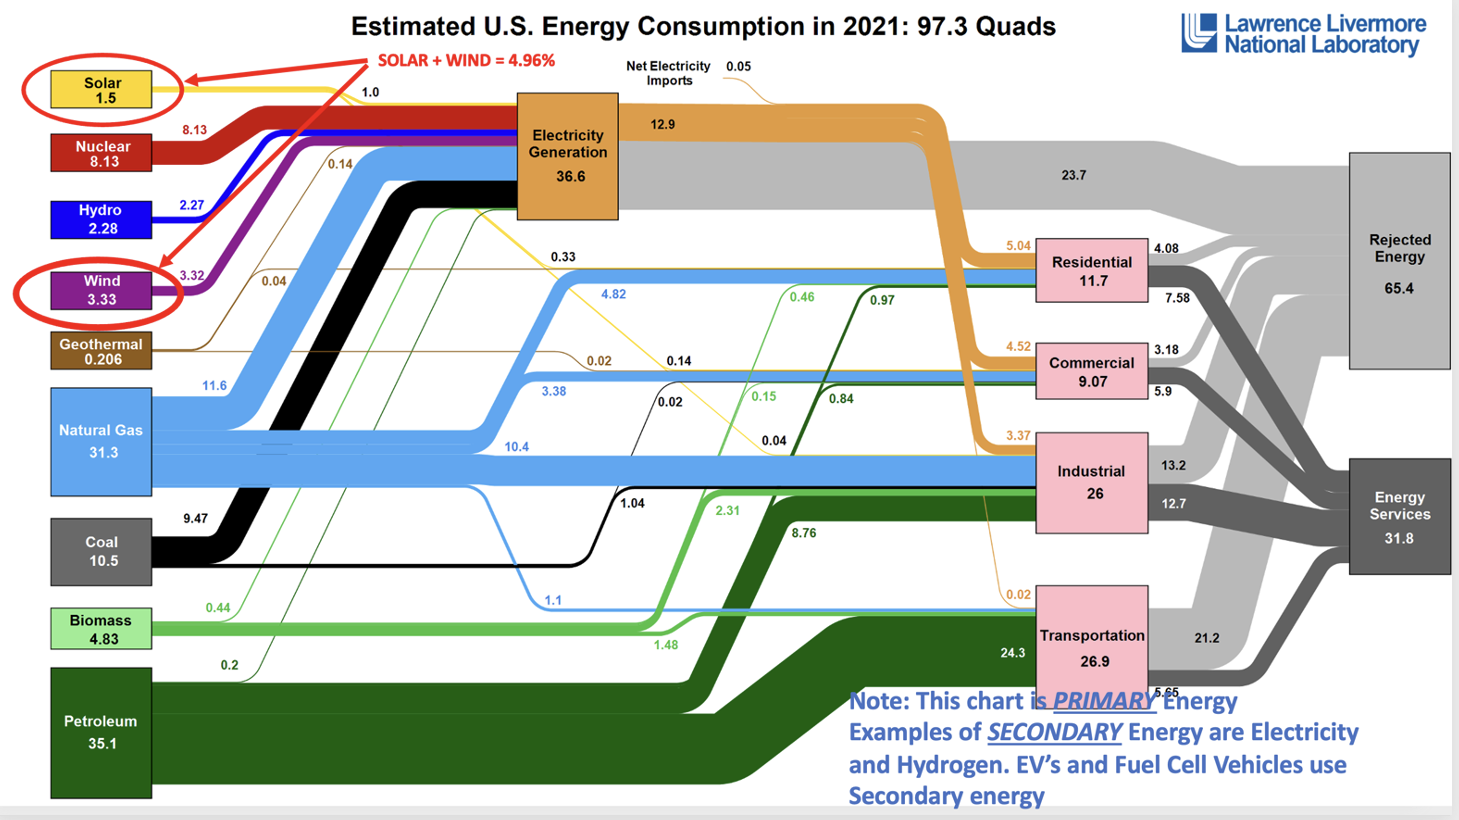
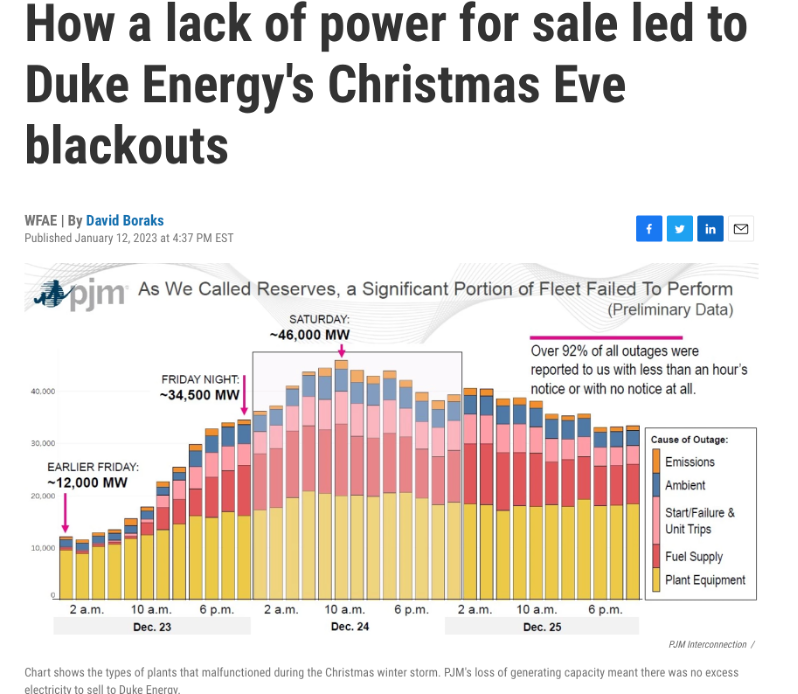


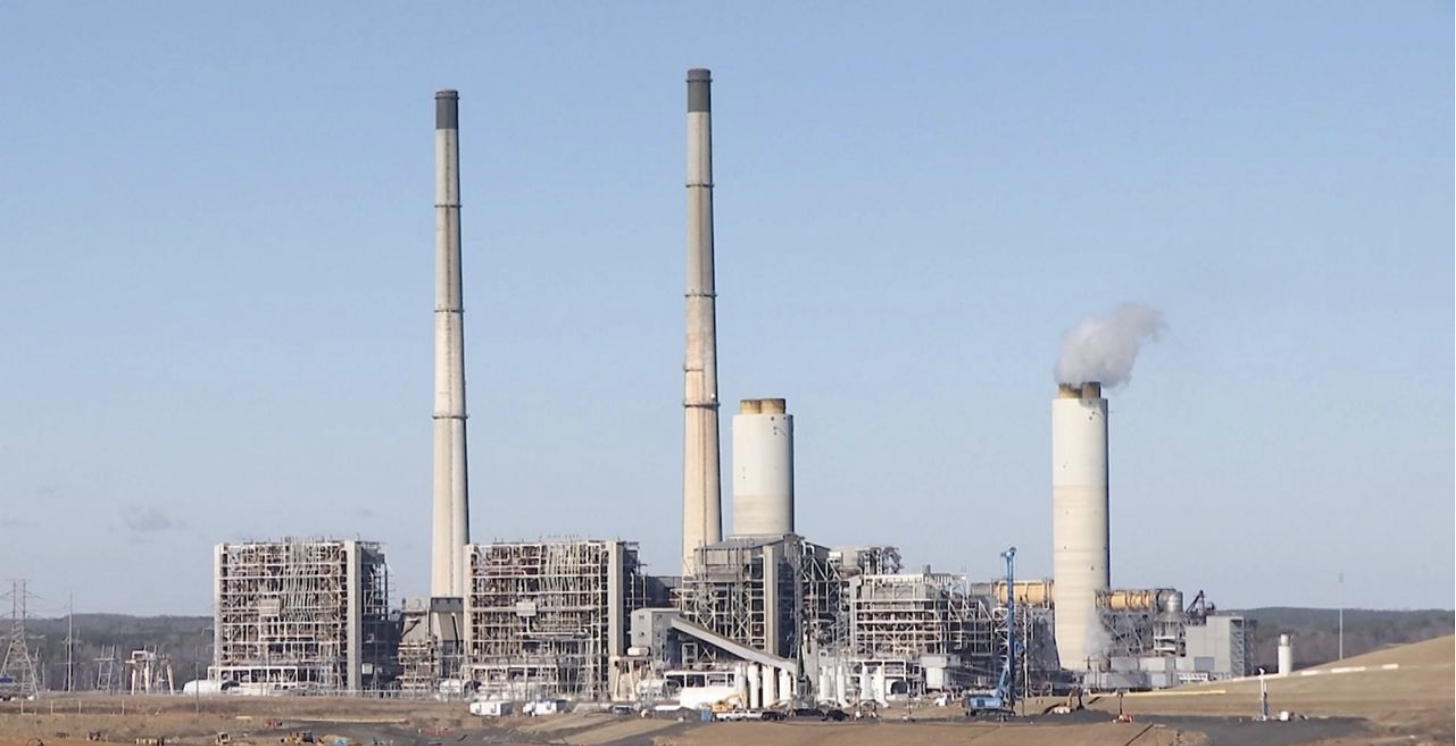


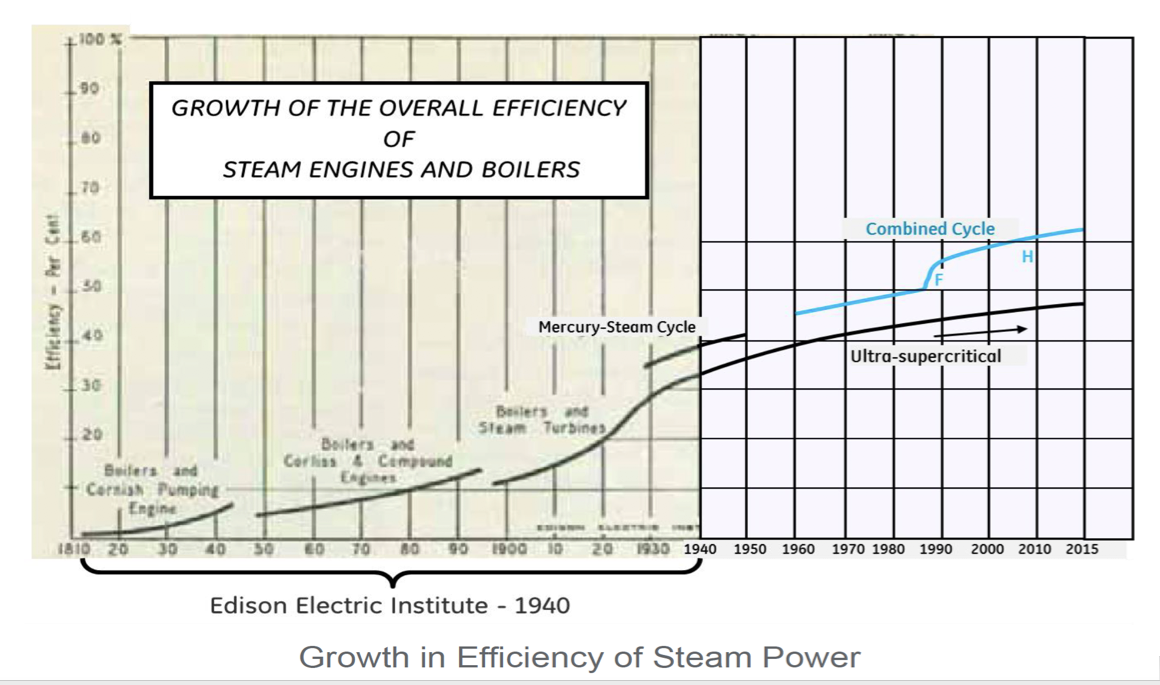

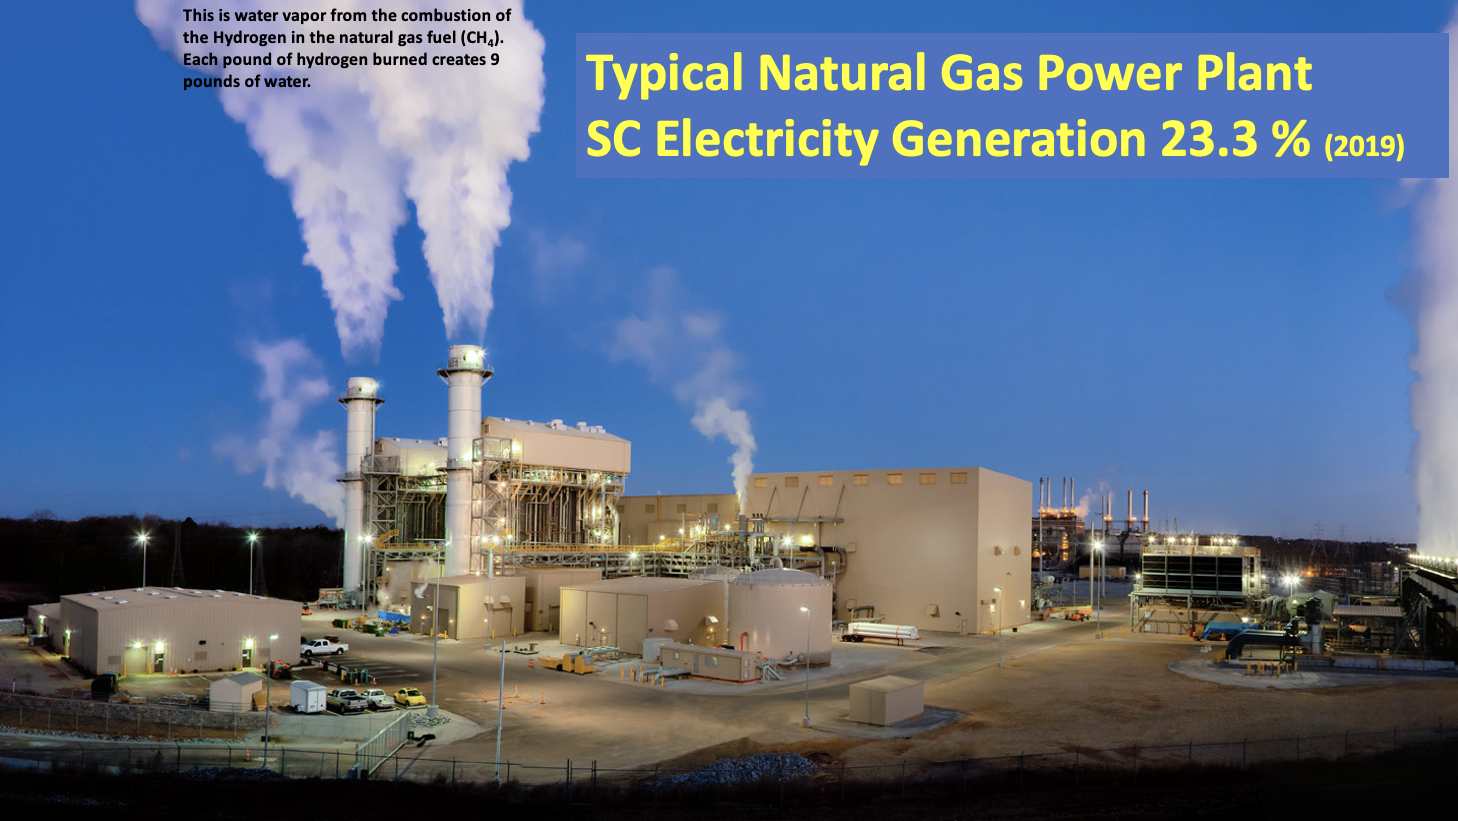
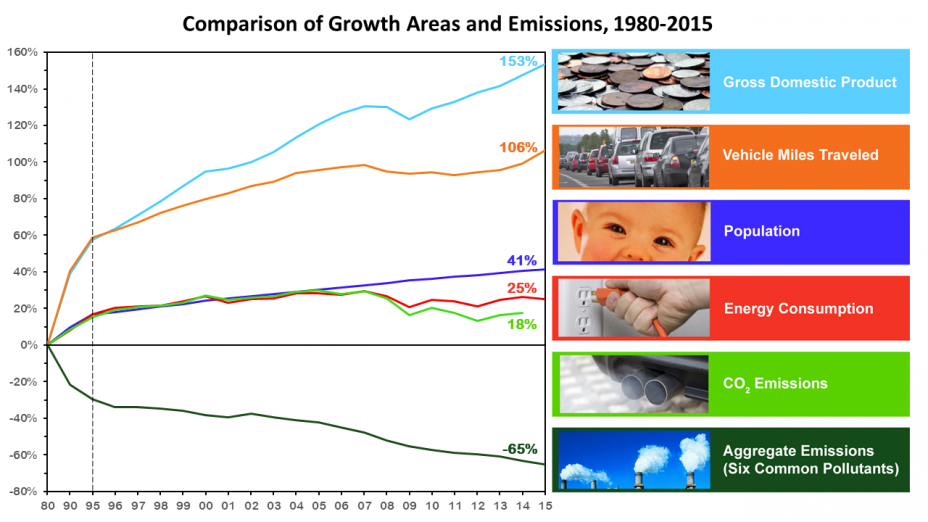


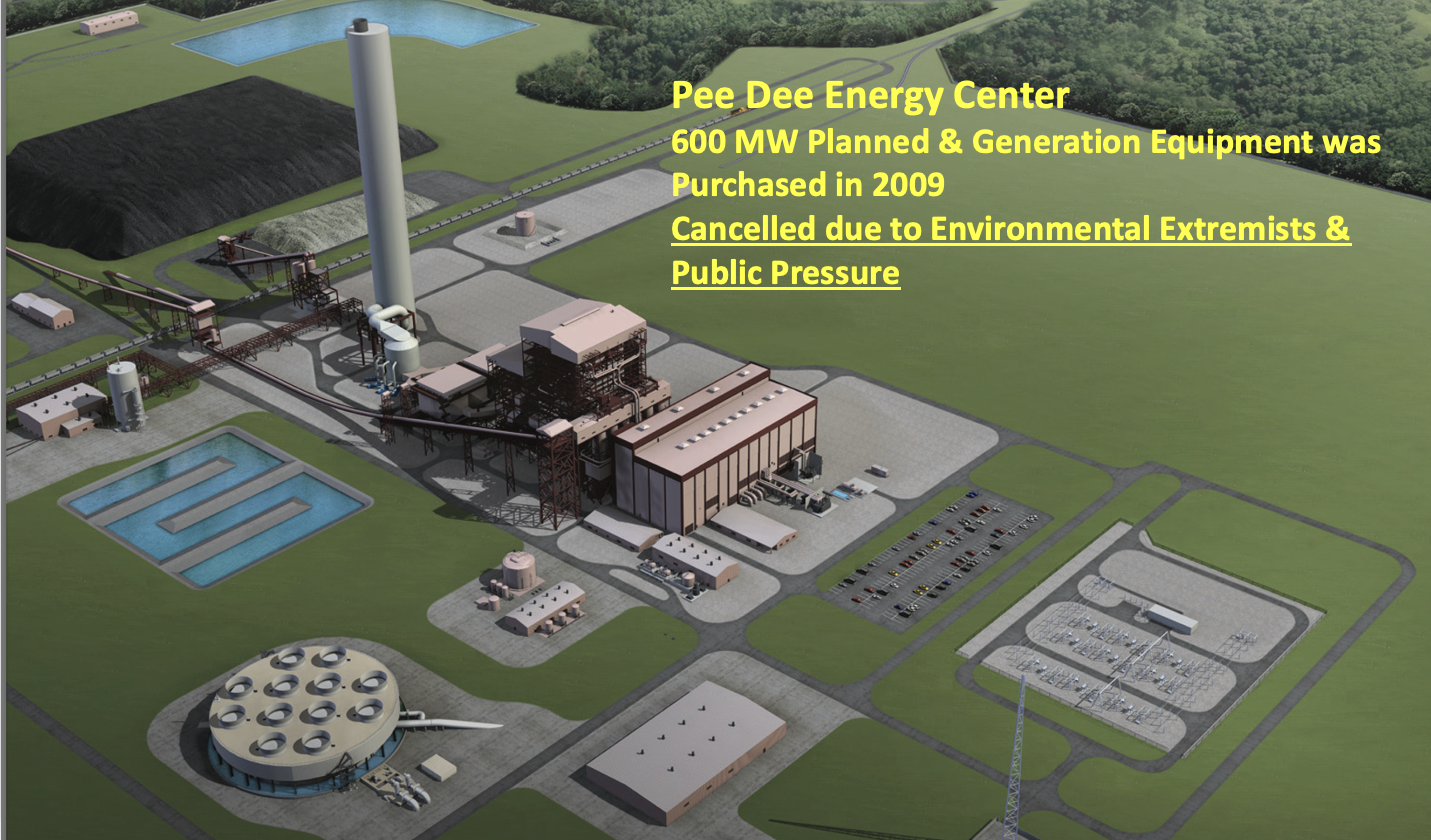

 Dick Storm's Thoughts on Energy, Education, Economic Prosperity & Environmental Blog