Background: Bulk Power Supply in the S.C. Lowcountry
The wholesale (Bulk Power) electricity providers serving our region are Santee-Cooper (officially the South Carolina Public Service Authority, or SCPSA) and Dominion Energy (which replaced South Carolina Electric & Gas as the Investor-Owned Utility). Most of Palmetto Electric’s Bulk Power comes from Santee-Cooper.
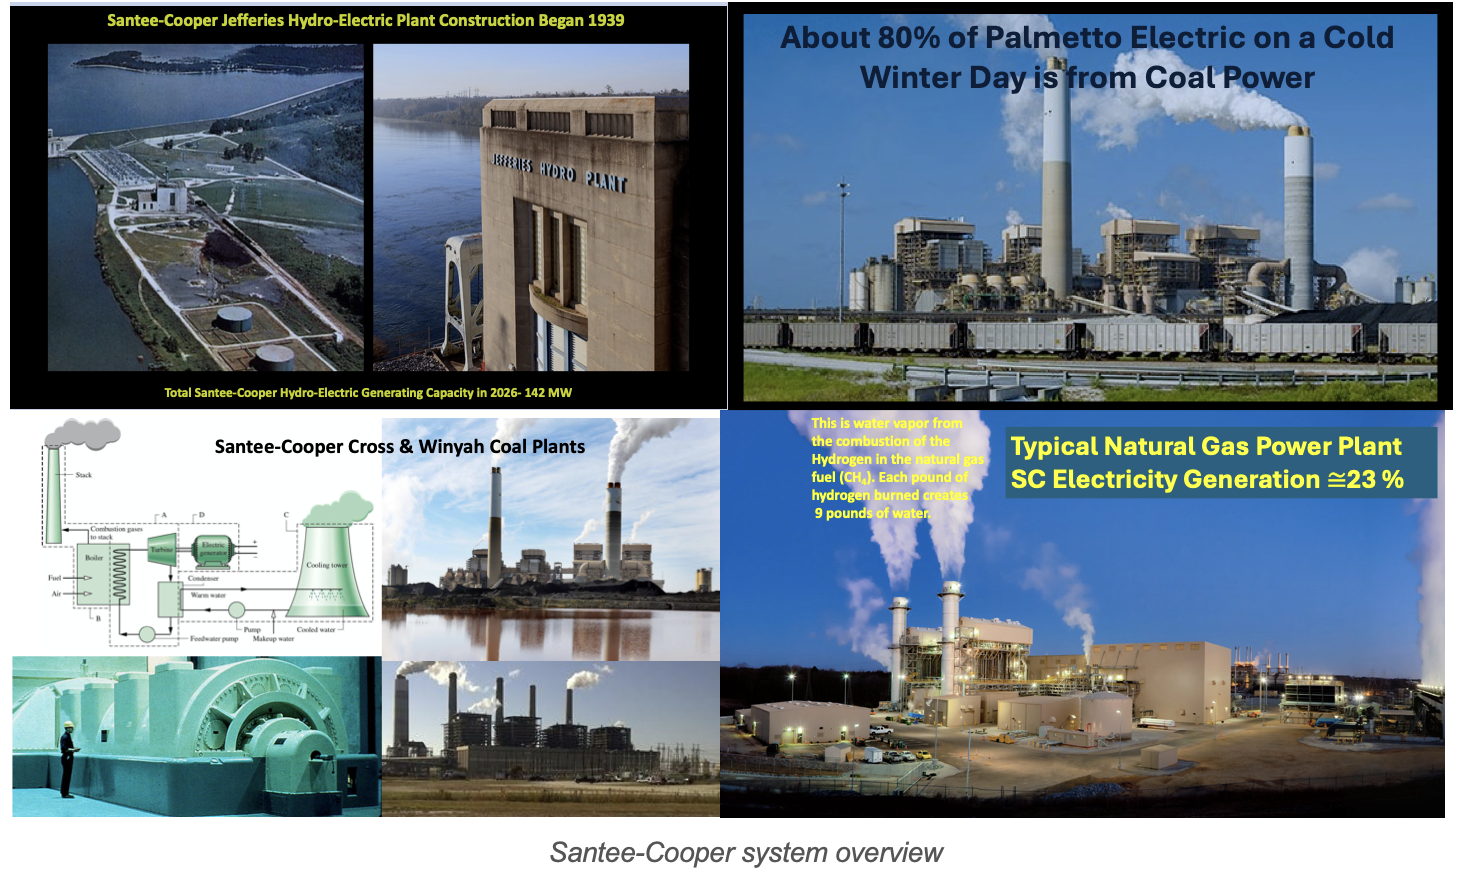
Santee-Cooper is a state-owned agency operating since the 1930s. Its first electricity was generated in 1941 from the Jefferies hydroelectric dam at Moncks Corner. Today, SCPSA’s hydroelectric plants still operate with a combined capacity of 142 MW.
Since 1941, population growth, industrial expansion, and regional electrification have driven steadily increasing electricity demand. During peak-load periods, SCPSA now generates up to approximately 5,000 MW. Over more than 80 years, coal has been the primary energy source, keeping production costs at or below the U.S. average—a commendable achievement.
This low-cost electricity attracted energy-intensive industries, most notably NUCOR Steel and Century Aluminum. Affordable coal-fired power was the decisive factor in locating these facilities in South Carolina. This has benefited heavy industry and all citizens of the region, including our area around Bluffton and Hilton Head Island.
How South Carolina Uses Its Electricity
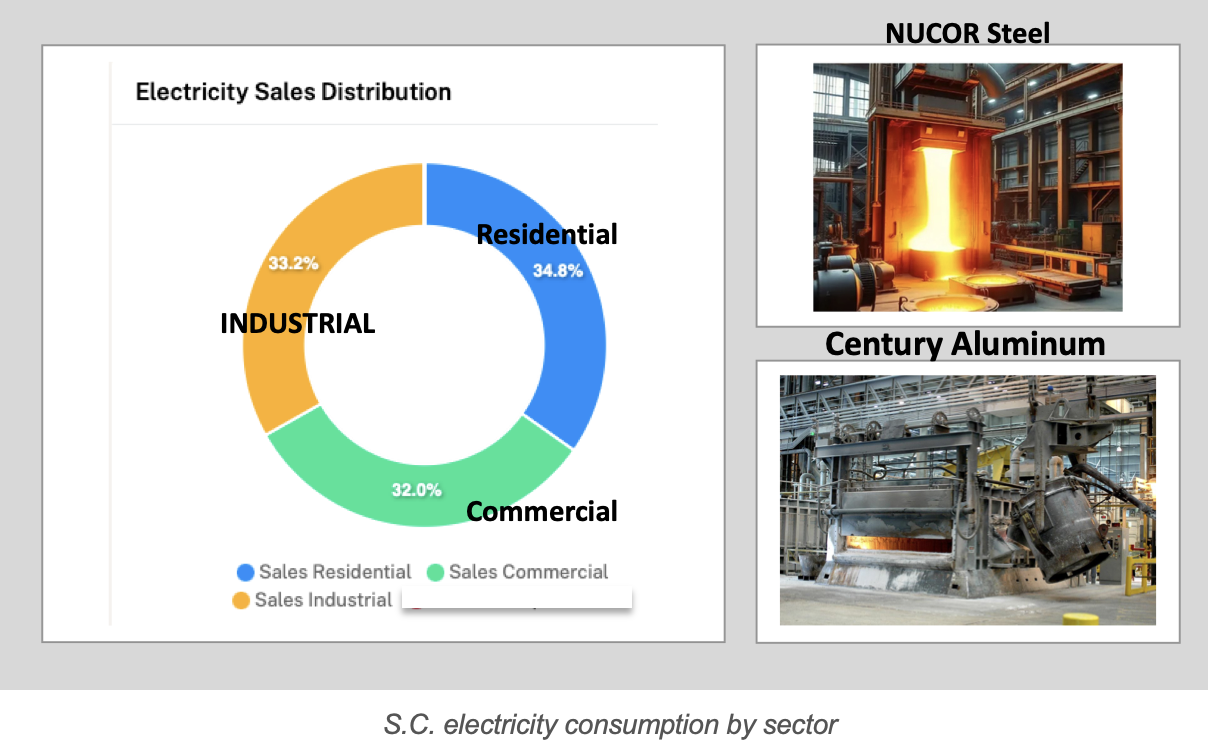
Industrial, Residential, and Commercial customers each consume approximately one-third of total S.C. electricity generation. NUCOR, Century Aluminum, and other industrial customers consume about a third of all electricity generated by S.C. utilities.
The Scale of Industrial Energy Demand
Aluminum and steel production are extremely energy-intensive. It takes approximately 6 kWh of electricity to produce just one pound of aluminum from aluminum oxide powder—and that is only to create raw ingots, not including the energy to refine bauxite ore or form finished products.
At full production, NUCOR and Century Aluminum together consume more Bulk Power on a given day than the entire island of Hilton Head uses during its highest winter peak-load demand day.
Affordable electricity supports economic prosperity, employment, and national security—in addition to keeping our homes heated and cooled.
Coal-Fired Generating Stations in The Low Country of S.C.
The Cross Generating Station, located about 100 miles north of Hilton Head Island, has four units built between 1983 and 2009 with a combined capacity of approximately 2,390 MW. All four units are equipped with stack-cleaning equipment; the visible stack plume is harmless water vapor.
Winter Storm Fern Proved the Importance of Coal-Fueled Electricity Generation
Cross and Winyah coal plants provided over 80% of the electricity consumed in the S.C. Lowcountry during the Winter Storm Fern peak demand period (January 26 – February 4, 2026). Natural gas and solar generation are also shown in the chart below. Not shown: the 322 MW of nuclear generation from Santee-Cooper’s one-third share of V.C. Summer Nuclear Plant.
The chart above is the actual “Bulk Power Supply” as generated by SCPSA, which provides the wholesale power to Palmetto Electric. Note that over 80% is from coal generation. Also, note the small contribution of solar. Not shown is the 322 MW of nuclear generation from Dominion Energy.
The Net Zero Carbon Mandate and Rising Costs
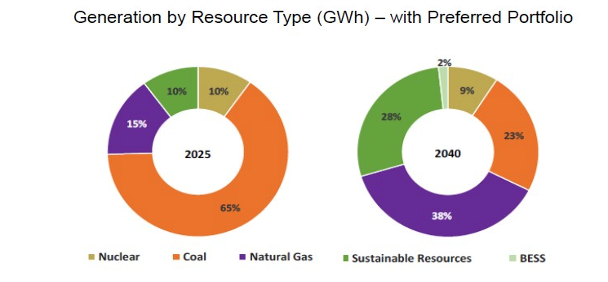
The least-cost fuels for electricity generation are coal and nuclear. However, SCPSA and other S.C. utilities have been ordered by the S.C. Legislature to transition away from coal toward Net Zero Carbon. The path ahead is described in the Santee-Cooper Integrated Resource Plan (IRP).
As can be seen on the portfolio transition, the plan is to reduce coal from over 55% to about 23% by 2040.
The S.C. Legislation to Increase Electricity Costs
South Carolina law (S.C. Code Ann. §58-37-40) directs the retirement of coal-fired generation:
Santee-Cooper’s analysis demonstrated that the Net Zero CO₂ by 2050 portfolio would be higher in costs and involve more risk for customers than the Economically Optimized Portfolio. Several supplemental analyses were performed reflecting the retirement of the Winyah generating station by end of 2028 or 2030.
This is the fundamental reason electricity costs will rise in the years ahead. The transition from reliable, affordable coal generation is a transition to higher-cost production. This is not a forecast—it is fact, based on the experience of countries and U.S. states already further along in the Net Zero transition.
Understanding Your Electric Bill
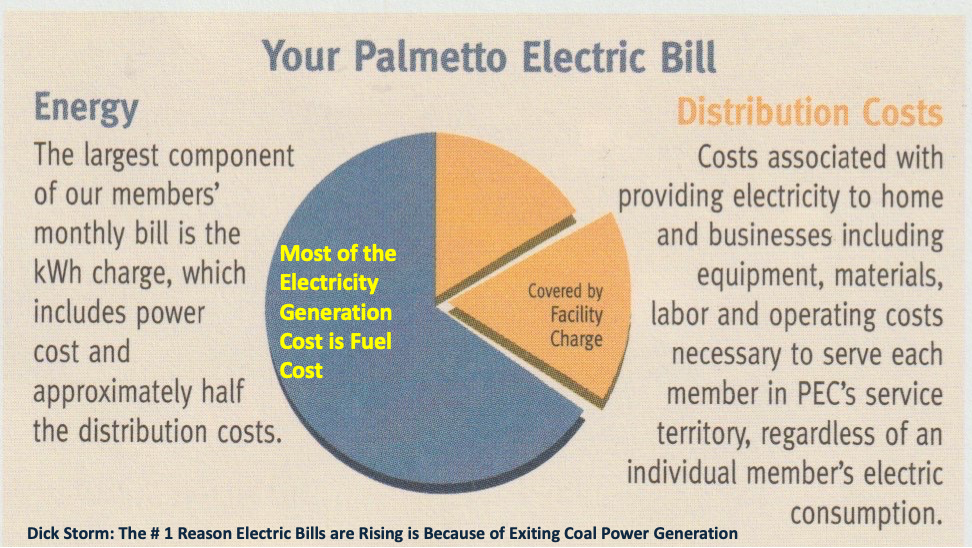
The major component of electricity production cost is primary energy (fuel). When wholesale power costs rise, retail electric bills follow. For a Combined Cycle natural gas plant, fuel alone constitutes about 90% of production cost. If natural gas prices double, so does the cost of electricity. Coal is a low-cost, price-stable source of primary energy, benefiting all ratepayers.
Why Transitioning to Renewables Raises Electricity Costs
The Core Problem: Backup Power
When the sun is not shining and the wind is not blowing, power must be supplied immediately by backup generation. In the U.S., that backup has primarily been natural gas. In some cases—Hawaii and New England—diesel, kerosene, and jet fuel have been used when other sources were unavailable.
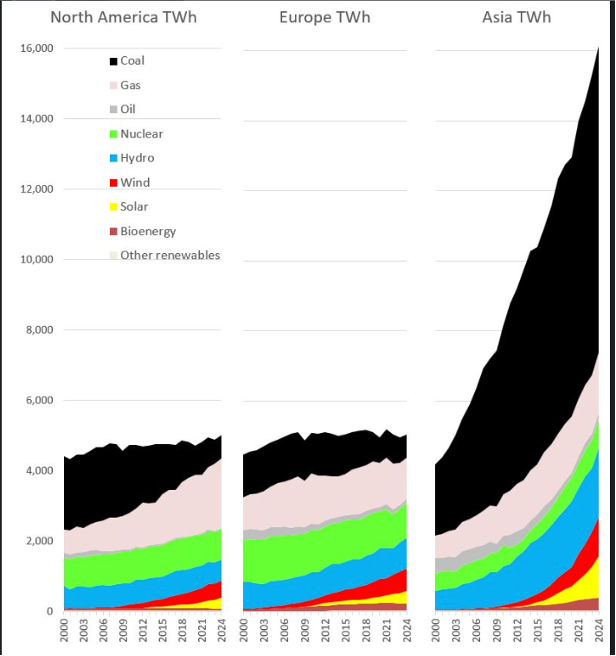
Electricity must be generated the instant it is needed. Wind and sunshine may be free, but backup power is not. The charts below show world generation by fuel. Note the coal consumption of Asia compared to the U.S.
This shows the absurdity of the path to Net-Zero Carbon when the entire world coal consumption is considered. If America’s coal consumption went to zero, it would barely make a difference in total CO2 emissions.
Credit for the chart above goes to Mr. Mike Caravaggio who prepared and posted on LinkedIn.
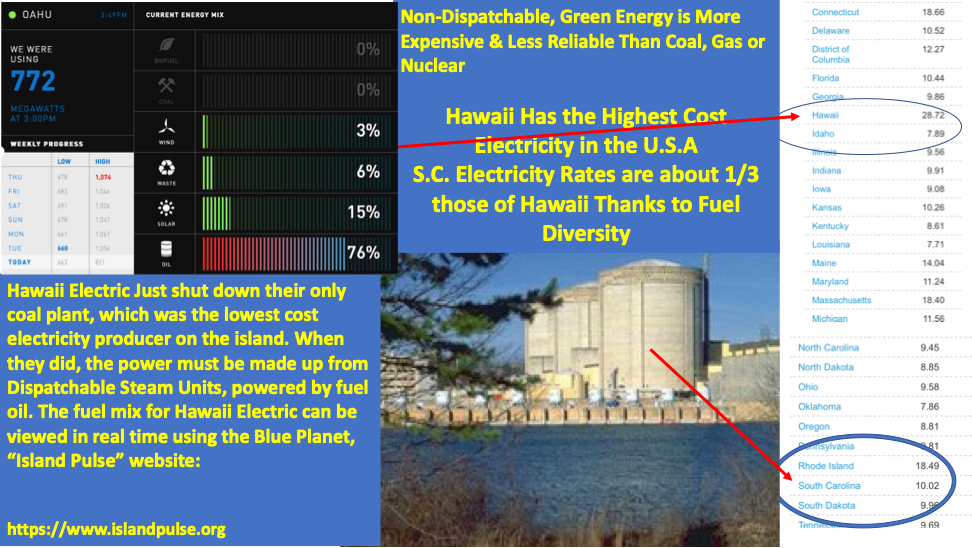
Case Study: Hawaii — An Energy Island
Hawaii is not connected to the mainland grid, making it a telling example. In 2021, 76% of its generation fuel was diesel. Hawaii once had a 180 MW coal plant that produced its lowest-cost electricity—even with imported coal. After transitioning to renewables, diesel backup became dominant when the sun set or wind dropped. Because diesel is among the most expensive generation fuels, Hawaii now has the highest electricity rates of all 50 states.
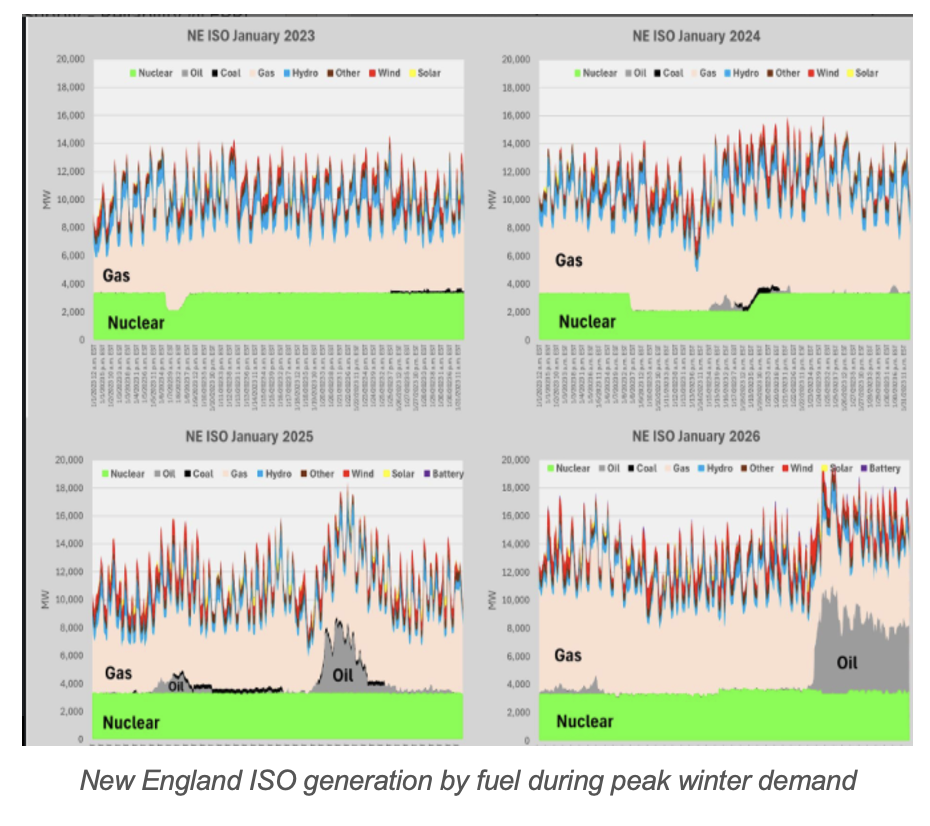
Case Study: New England
States that have retired coal plants have experienced sharply escalating costs, including California, Massachusetts, New Hampshire, Rhode Island, Connecticut, Vermont, and Maine. During Winter Storm Fern, New England generated roughly one-third of its electricity from diesel for several days. Their plan to import Canadian hydropower failed when Canada needed its own capacity during extreme cold.
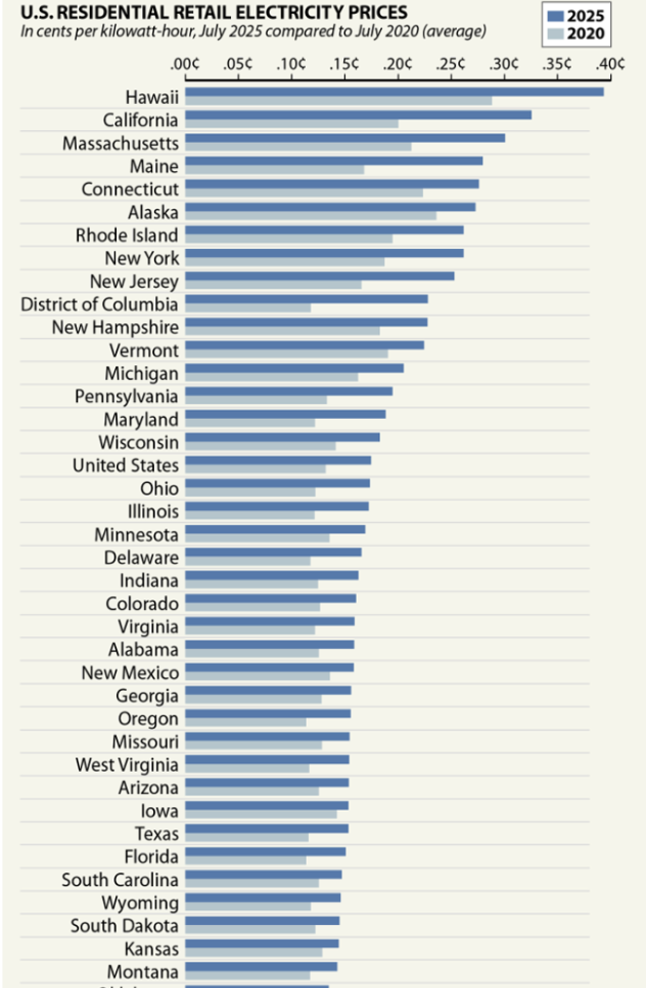
Electricity Costs by State
The pattern is clear: states with the least coal power tend to have the highest electricity costs.
The state of Tennessee for some reason was not included in the chart above. TN does in fact have some of the lowest electricity costs in the U.S. according to: https://findenergy.com/tn/ The low cost is attributed to a lot of old hydroelectric power, considerable nuclear and a still large coal fleet. TN average electricity cost is about $0.129/kWh.
Case Study: Germany
Germany began its coal transition in 2011 under the Energiewende policy. Once Europe’s strongest manufacturer, Germany has experienced de-industrialization driven by skyrocketing electricity costs—now approximately $0.33/kWh, even higher than Hawaii.
Dr. Lars Schernikau is an energy expert and knows a lot about European energy policies, including Germany. Here is a quote from Dr. Schernikau in the Engineering News:
Schernikau was bluntly pessimistic about the true financial viability of wind and solarenergy on a grid scale.
“There is no way you can make honest money with wind and solar. It’s not possible. When I say honest money, I mean without somebody else’s money, because you are living off somebody’s subsidies, which is paid by taxpayers,” he said.
He illustrated this by pointing to the economic problems with high solarpenetration in markets such as Germany, where an oversupply of solarenergy has led to a significant drop in prices. In May, for example, the price of solarenergy in Germany fell by 50%, reducing the earnings of solar producers. Negative power price days are at an all time high in Germany and other countries, Schernikau pointed out.
The impact of high electricity costs on households was another area of concern. Schernikau cited a March report from the German government auditor Bundesnetzagentur, which revealed that energy poverty in Germany had risen to 25%, meaning one in four households is now classified as energy poor.
So, I would ask. Why is South Carolina following the same Net Zero path of Germany?
Natural Gas for Electric Power Generation
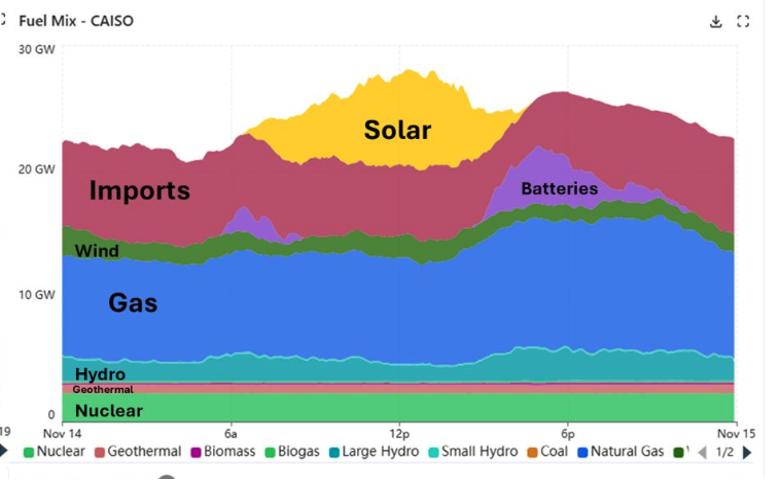
Intermittent sources like solar and wind must be backed up by dispatchable generation—gas turbines or reciprocating engines (RICE). The chart below shows a typical daily generation profile in California. Solar (yellow) is strong for about six hours; as the sun sets, Dispatchable power must ramp up sharply.
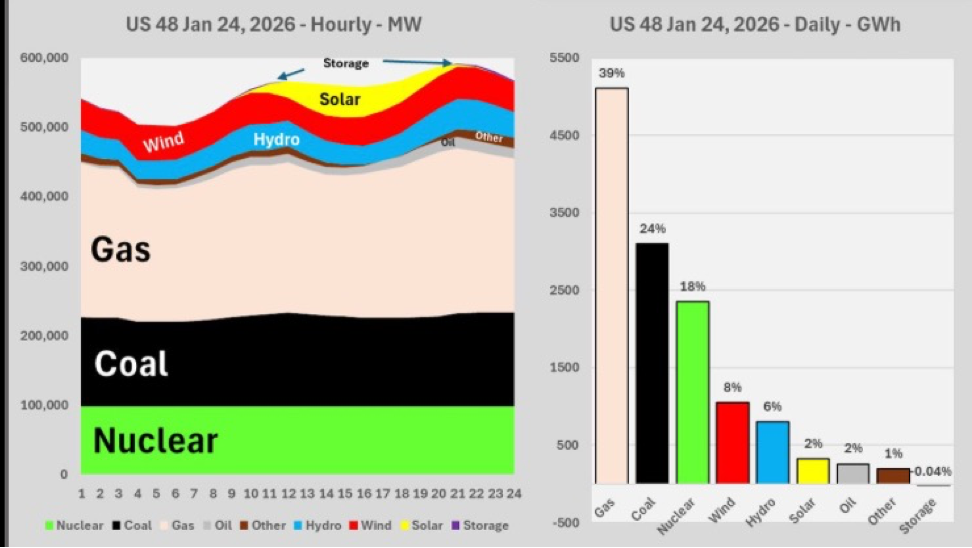
Here is the generation by fuel for the lower 48 states for the first 24 days of January 2026. Thanks again to Mike Caravaggio from EPRI for posting this on LinkedIn.
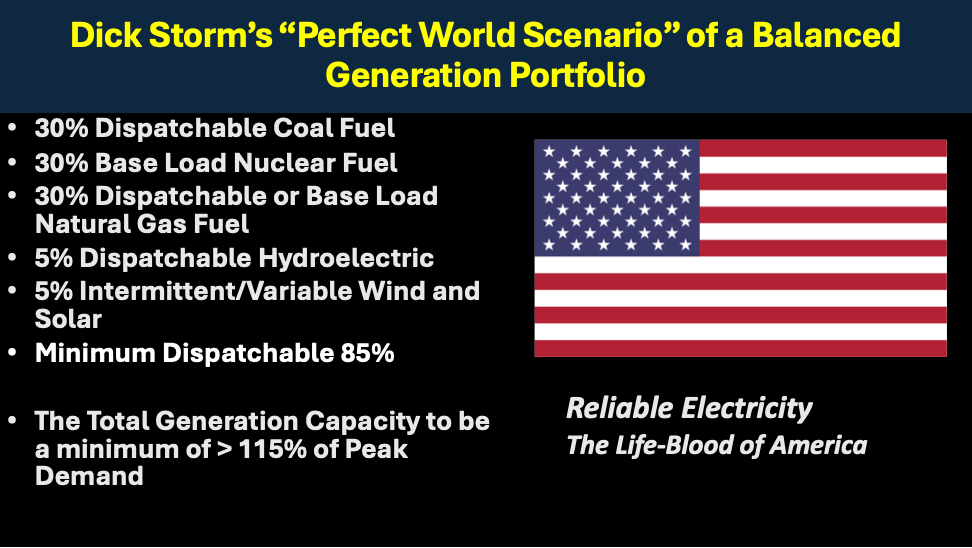
A reliable Grid should have a balanced generation portfolio. In my experience, 85% Dispatchable or Base load generation works well and has been proven.
A balanced generation portfolio works best with at least 85% dispatchable power generation capacity.
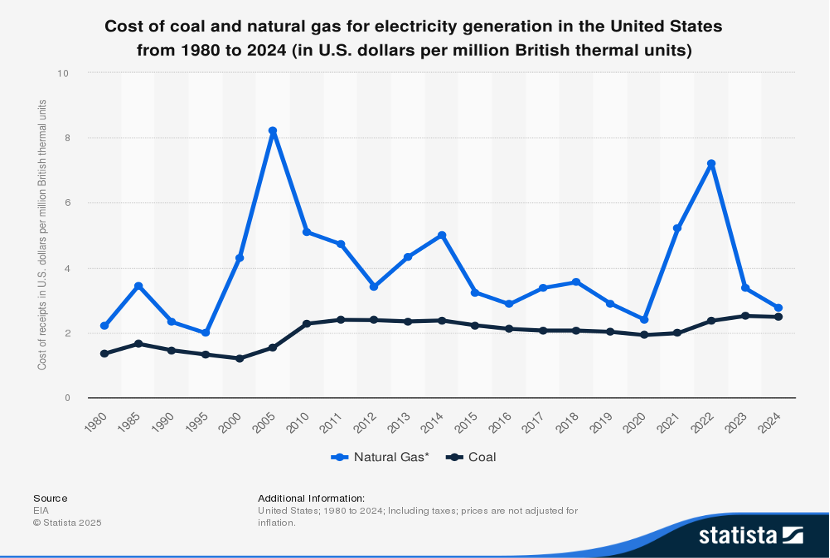
Fuel Price Stability: Coal vs. Natural Gas
Natural gas prices are volatile, especially during winter when home heating competes with power generation for pipeline capacity.
A key point on the generation of electricity: The fuel cost is the single largest component of the operating dollar for the production of electricity. So, if much solar and wind is installed, then it must be backed up with Dispatchable electricity generation. Usually in the U.S., that fuel for Dispatchable, backup power is natural gas. As can be seen from the examples of New England, California, Hawaii, Germany and the UK, the cost of that backup fuel matters when retail electricity prices are compared.
The chart below compares natural gas prices (blue) with coal prices (black) since 1980.
Conclusions
Coal provides the fuel to generate reliable electricity at amongst the lowest cost in the world. This is based on actual results and actual rates, not on economic models or expert opinions.
Modern coal plants like Cross are clean; their ash is recycled for cement and sheetrock manufacture.
Nuclear is excellent but new construction takes a decade and costs tens of billions (Vogtle 3 & 4: 10 years, $30+ billion).
Natural gas already provides ~43% of U.S. electricity (2025)—a high share for a pipeline-delivered fuel. Coal plants balance price volatility and store weeks of fuel on-site, an intrinsic grid security advantage.
The author recommends the S.C. Legislature repeal the Net Zero Carbon law and allow SCPSA and AI Data Center developers to pursue new coal-fueled generation
Part 2 will follow and show some more reasons why wind and solar although using “Free” fuel, cost more.
Coal power in America remains important and I wrote on that last week. This is a followup to provide an overview of the importance of coal as a form of primary energy in the rest of the world. The key phrase is Primary Energy.
Ron Stein and Nancy Perlman wrote an excellent article on the importance of providing primary energy to the six billion people on the planet that are living in poverty. Lifting them from poverty requires energy, just as energy powered the citizens of countries living in the Developed world.
“In poor countries, millions of those in poverty die every year. From indoor air pollution from having to burn wood, charcoal, grass, and dung, because they don’t have natural gas, propane or electricity for cooking and heating. From bacteria and parasites in their water and food, because they don’t have electricity, water treatment or refrigeration. From malaria and other diseases, because their substandard clinics and hospitals lack electricity, clean water, sufficient vaccines and antibiotics, even window screens. “
It’s disheartening that the wealthier country governments have chosen electricity generation “winners,” i.e., wind and solar, to generate electricity, paid with taxpayer funds, to support the Government Mandates and Subsidies.”
How about India and China?
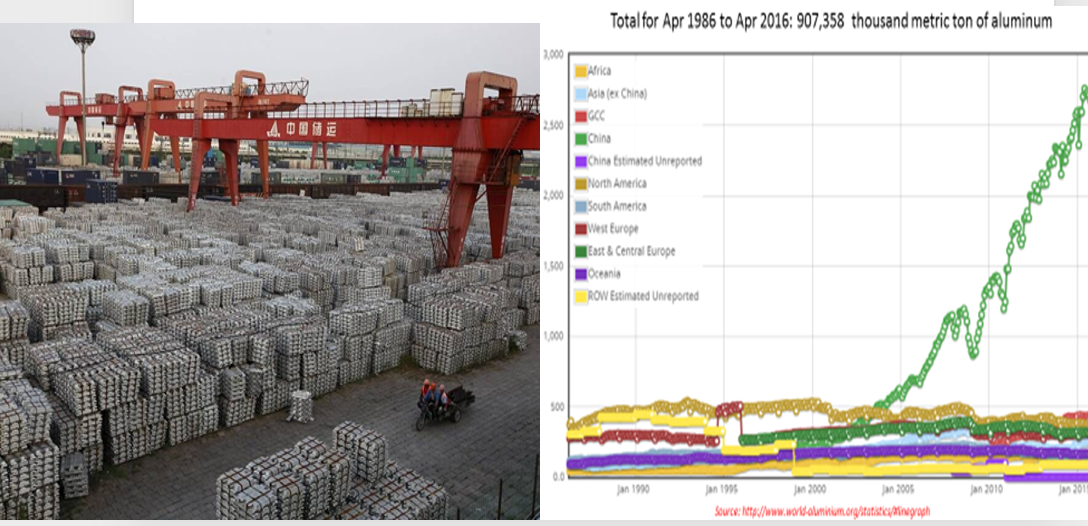
China did in fact lift millions from poverty since they entered the World Trade Organization and became the world’s leading country in manufacturing. One example is their use of enormous amounts of coal as the primary energy to produce aluminum. Before the year 2000 China was an insignificant producer of aluminum. Look what they did in 20 years.
How did China power their economy to become the world’s largest producer of aluminum, steel and most manufactured products in such a short time? They did it with coal power. Thomas Shepstone, Jr. and Duggan Flanigan also wrote about energy intensive aluminum production. Here is an overview of China’s energy production during this period of astounding industrial production growth. This chart below is from my July 2025 presentation to the Coal Institute.
China consumes over 50% of the world’s coal. They understand the sources of primary energy that are viable for affordable, Dispatchable and reliable electricity production, so does India. From the IER (Institute for Energy Research)
“China and India – both considered “developing countries” by the IPCC – are burning record amounts of coal and using more kinds of energy to keep energy prices affordable and increase the standard of living for their people. Wind and solar energy in China and India are complements, not substitutes, to their massive growth in energy, particularly in fossil fuels. Fossil fuels provided 82 percent and 88 percent of China and India’s energy, respectively, in 2022.”
How about India, Germany and the UK?
From the Economic Times: “India’s coal consumption could more than double by mid-century before plunging sharply as the country shifts toward cleaner energy, long‑term projections published by government think-tank NITI Aayog show.“
Germany’s path to Net Zero has created much loss of industry. Here are a few references:
WUWT on the Decline of German Chemical Industries due to High Energy Prices, and How Germany is Dismantling it’s Core, by Tilak Doshi.
Lars Shernikau’s blog post on the decline of German Industry due to missteps of Green Policies. Dr. Shernikau is a well respected author and world renowned energy expert.
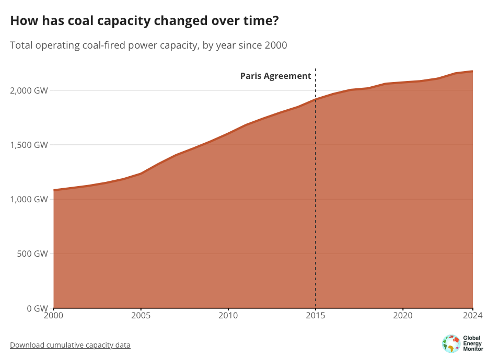
Coal use in the world has steadily increased.
So if Coal Is Such an Obvious Source of Primary Energy, Why is the West Self Sabotaging Their Economies?
I provided a presentation to the ENERUM Energy Forum in Columbus in 2022 to ask this question. A similar presentation to Liberty University in 2023. I am glad to send those presentations. upon request.
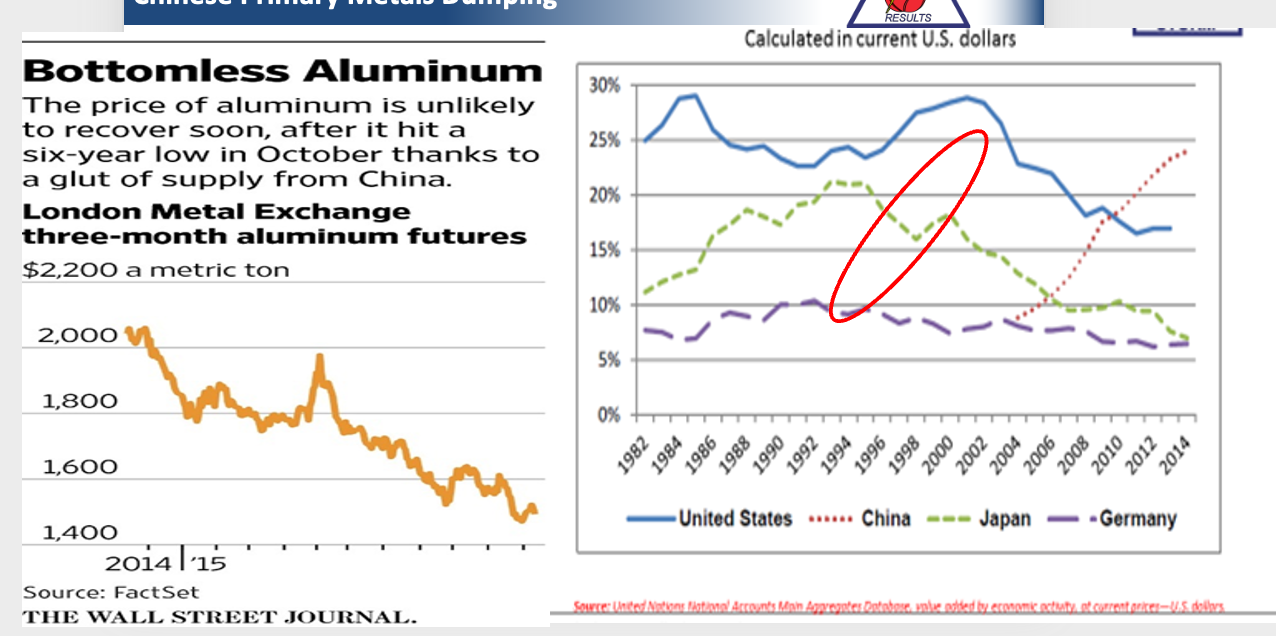
Getting back to aluminum production, here is a graph of U.S. and China production. As America shut down many coal plants and electricity costs rose, China was building new coal plants to provide reasonable cost electricity to smelt aluminum in huge quantities. Many folks, including me believe that China Dumped aluminum on the International markets in lieu of counterfeiting U.S. currency. Note the rise of aluminum produced in China during the years 2004-2014 (from chart above). Both of these charts are from a presentation to the Delaware County Bar Association in 2016 to discuss energy, the economy and how it impacts the Real-Estate Market. Yes, I know that sounds abstract, but reasonable cost energy = jobs, especially for energy intensive industries such as aluminum smelting, then the jobs impact the Real-Estate market.
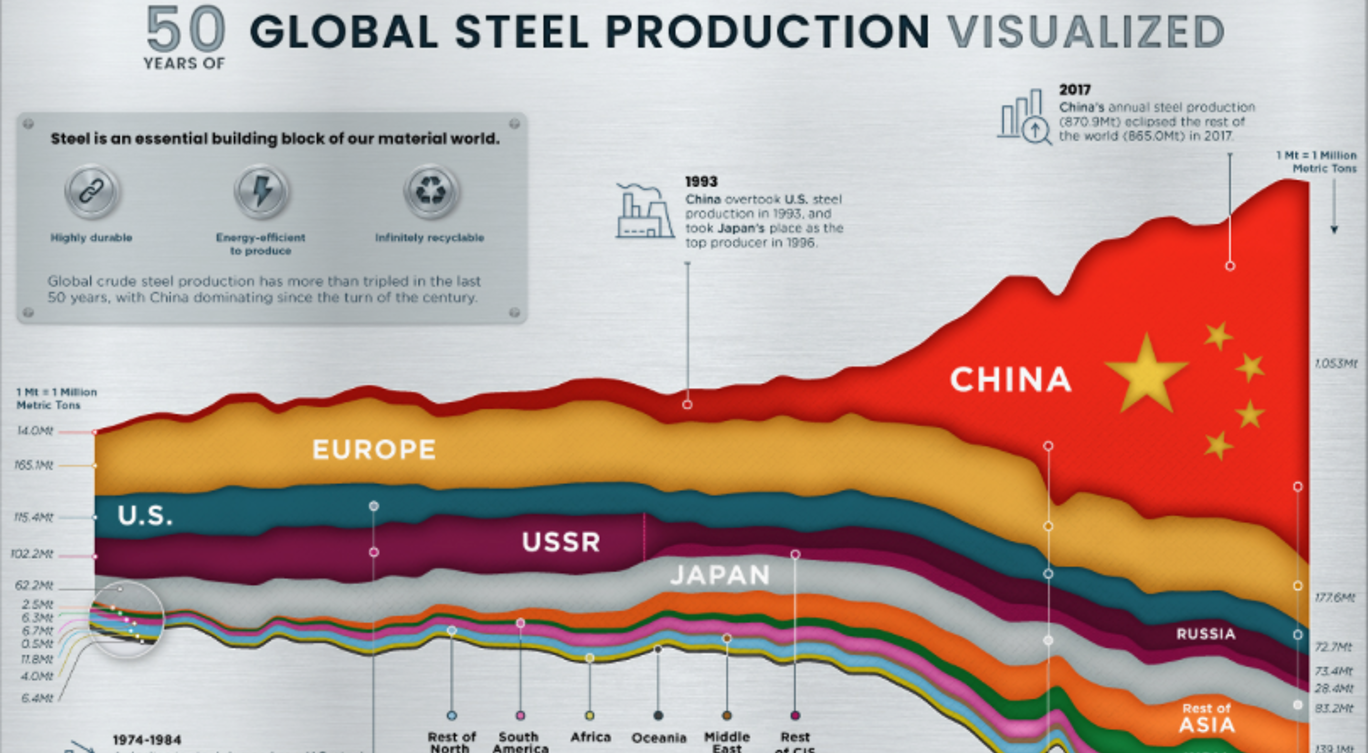
The Self-Sabotaging and excessive environmental laws of the U.S. have not only seriously (I hope not mortally) wounded the aluminum industry, but also steel and heavy manufacturing. Steel production by country is shown below. Why do western politicians continue to do their best to weaken their countries and force manufacturing overseas? It is not only the U.S. it is Australia, Germany the UK and more. President Trump is trying to correct the U.S. problem, but he has much opposition by the Democrats.
The west has been committing energy suicide. Here are links to several articles written by Professor Vaclav Smil, CO2 Coalition’s Gregory Whitestone and Ron Stein. Vaclav Smil for Fraser Institute, “Why Net Zero is Impractical and Unrealistic” and Scam of the Century: Ridding the World of Crude Oil Without a Replacement is Global Suicide”, by Ron Stein and Gregory Whitestone, July 2024. I have also written much with many credible other references on the Self-Sabotaging of the U.S. electric Grid. Here, here and here are three such articles.
Professor Samuele Furfari whom I admire and follow, has written much on the fallacy of hydrogen, wind and solar. Here is a short article he wrote for the CO2 Coalition. Here is an excerpt:
“Over the past ten years, the EU has reduced its energy demand by 6.1 EJ. In contrast, the rest of the world has increased its energy demand by 76.8 EJ – thirteen times more. This is not surprising given that the EU’s competitiveness is currently under threat from the Green Deal. This tragedy is even recognised by the Mario Draghi report, although it does not directly attribute faults to the Green Deal n order to remain politically correct. Instead, the report blames the increase in energy prices, which are nevertheless the consequence of EU energy policy. Outside the European Union, renewable energy sources such as wind and solar power have generated 8 EJ. This figure actually surpasses the change in energy demand within the EU itself. Nevertheless, over the past ten years, fossil fuel consumption has increased by 59 EJ. This means that outside the EU growth in fossil fuels has outpaced that of renewables by a factor of 7.3. In other words, while modern renewable energy is expanding, fossil fuel use is increasing at a rate more than seven times greater. Contrary to the commonly held belief within the EU that the gap between renewables and fossil fuels is narrowing, the reality is that the gap is widening. The evidence suggests that the EU has indeed achieved results in the energy transition, undergoing a profound transformation of its electricity sector and setting benchmarks for renewable energy integration and emissions reduction. However, the EU’s progress is not being matched elsewhere, and its leadership is merely symbolic because the rest of the world is accelerating its use of fossil fuels more than its use of renewable energy. When a leader realises that no one is following them, they must reconsider whether they are truly leading.” I emboldened the line which I thought was most important. It is not only the EU that has chosen the foolish path of Net Zero Carbon, but many other countries and states remain on this course. So, let’s take a look at Australia.
Australia
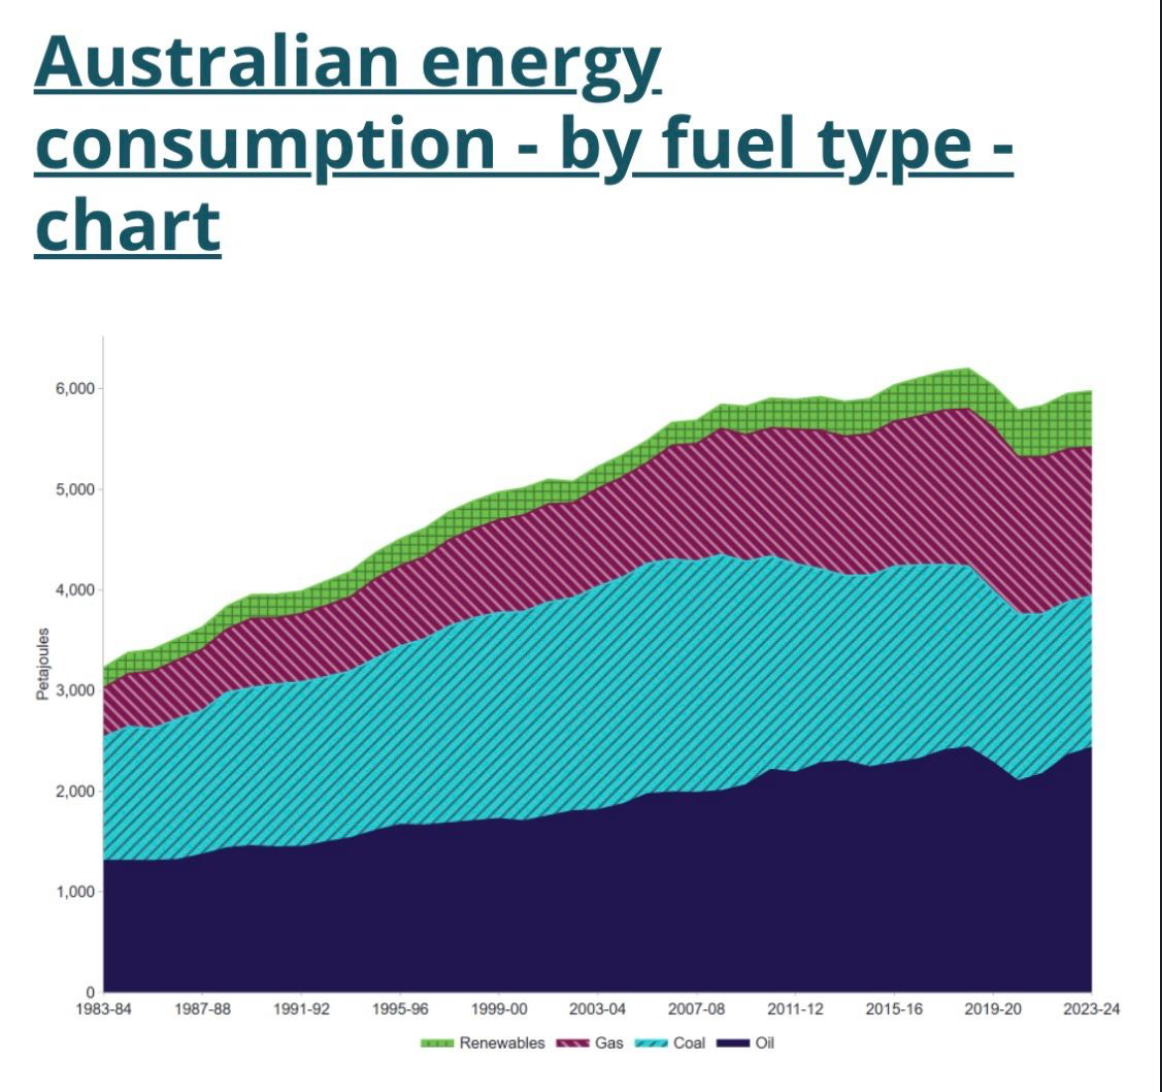
I saw Ben Tan’s post on LinkedIn where he showed the primary energy used in Australia 1984-2024. It is copied below. This shows the constant need for coal power, steady since 1983.
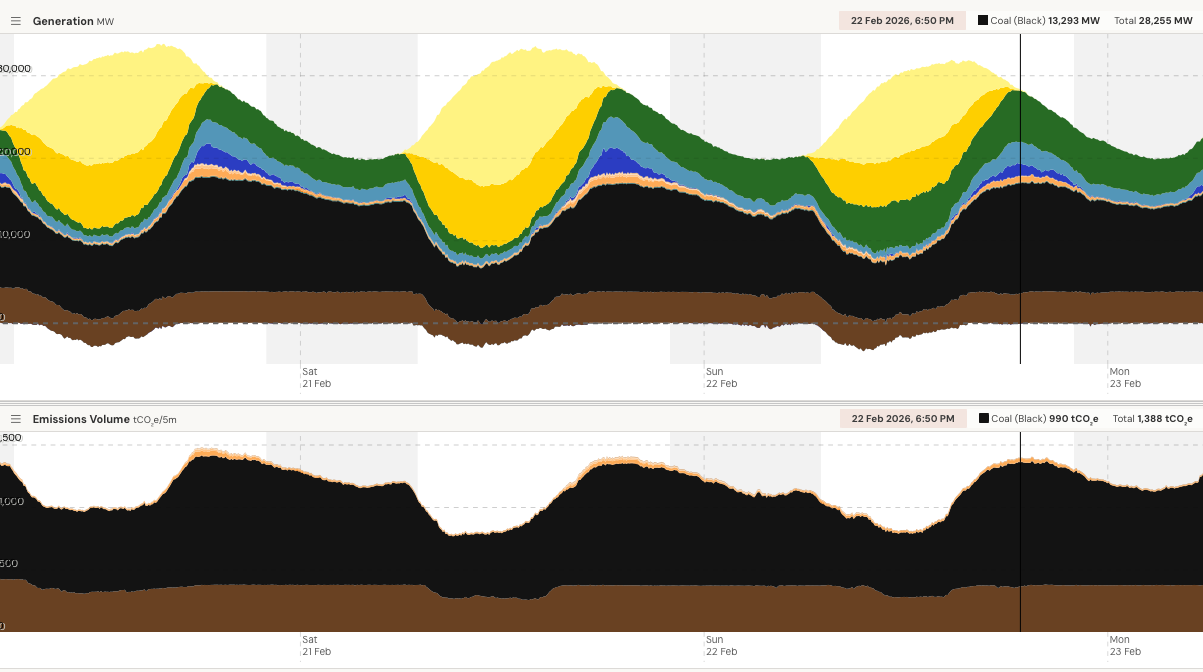
Two other Australian sources for up to date enelectricity generation by source are Rafe Champion and Ben Beattie. I thank them for their articles, links and information. Here below is the Australian Grid generation by fuel for Feb. 22, 2026. Note that it is over 50 % coal. (at one point 38.5% Black coal and 13.2% Brown Coal) Solar and wind were producing 45% at this same moment. Solar does very well during the sunshiny 6 hours or so of the day and wind does well when the wind is blowing, but the voltage control, base load, sudden increased demand requirements (like turning on a 150 MW electric furnace in a steel mill). Also, the rotational inertia and Grid stability are provided by the coal and gas plants.
Numerous references are included at the end from Rafe Champion, PA Pundits and others on the problems with wind and solar. Although electricity generation is complicated, it is not rocket science. If the politicians would do just a little bit of reading and research and maybe even ask folks like us that do understand, they could make right decisions. However, across the west politicians insist on weakening their countries. Just like the U.S. presidents Obama and Biden (before President Trump began the Herculean job of correcting anti-American Energy policy) and the German and UK politicians. Of course, even many Bureaucrats and state Legislatures to this day, are still stuck on the destructive path of Net Zero Carbon. Even my Conservative (Red) state of South Carolina. Here is a quote From the Santee-Cooper IRP: “As required by S.C. Code Ann. §58-37-40(A)(4)(c), Santee Cooper has evaluated a Net Zero CO2 “
This reminds me of Charlie Reese’s last column on how a minority of legislators and judges can force their Ideology on the citizens. Off topic but voter energy education and voter turnout needs to be improved. As I said, we even have misguided voters and politicians in the deep red state of South Carolina. We have got to improve the energy IQ of the voters.
Recent Articles to Support Building New Coal Power Generation Plants
Rather than repeat my same message, here are recent articles I have written in an attempt to explain the case for new coal plants, including two articles on the need to build new coal plants based on coal being the default source of primary energy. The default source of primary energy because the electricity growth is expected to out pace the production of gas turbines to provide for all new generation and nuclear generation, although a very good approach, will take a decade or more to provide the needed electricity generation capacity.
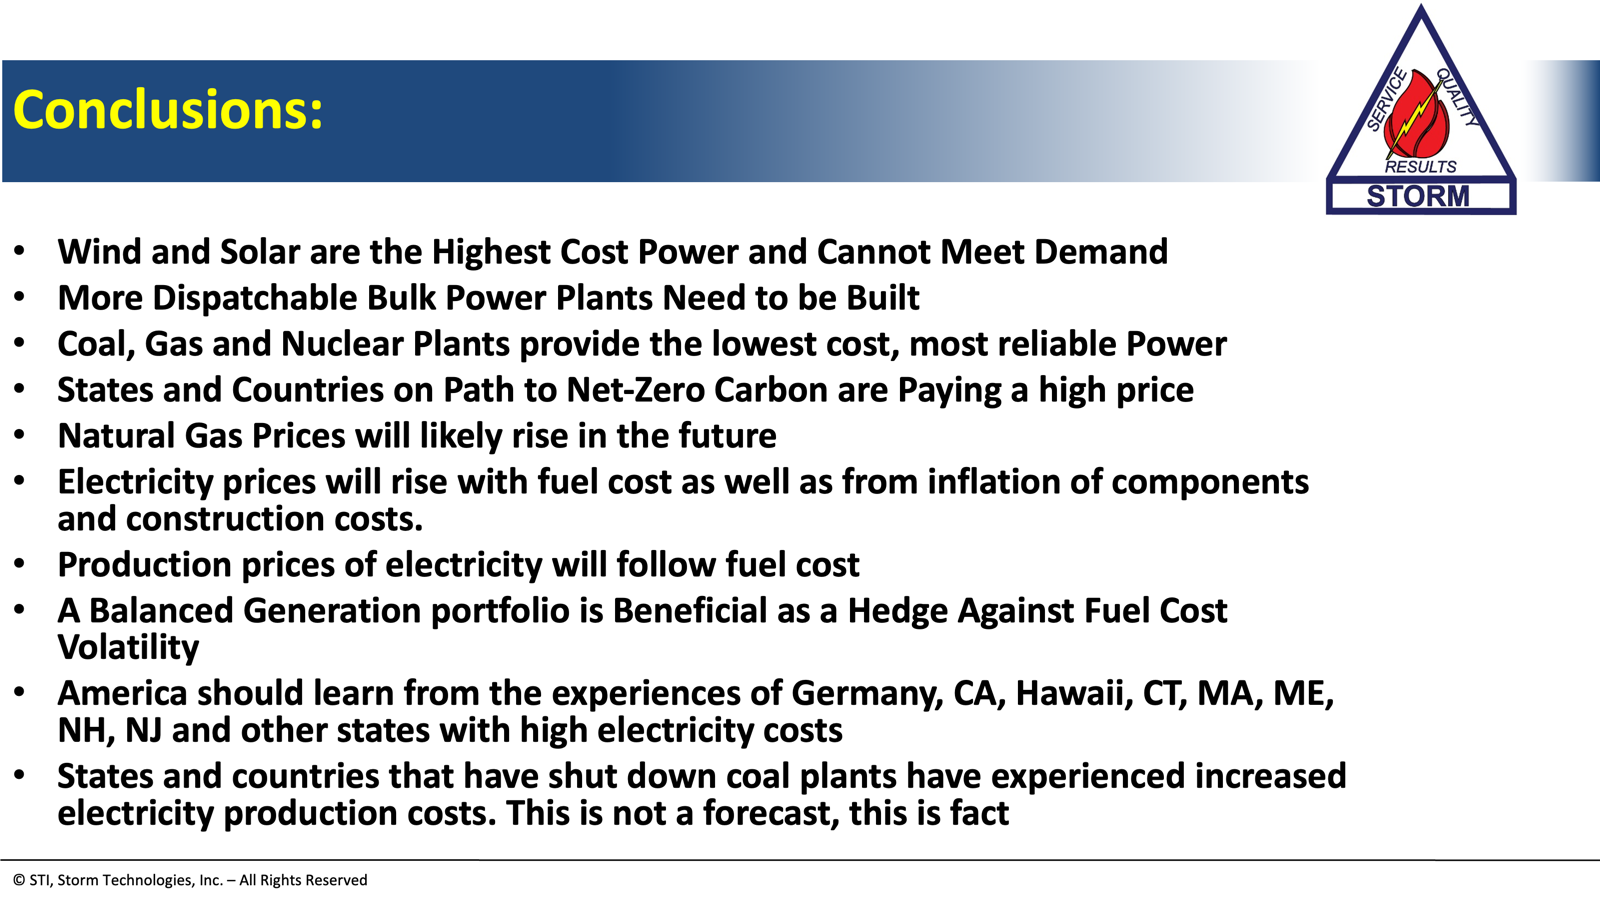
• Wind and Solar are the Highest Cost Power and Cannot Meet Demand, they are a risk to national security and when a region exceeds 30% renewables and the electricity rates are the highest
• More Dispatchable Bulk Power Plants Need to be Built
• Coal, Gas and Nuclear Plants provide the lowest cost, most reliable Power over the long term
• States and Countries on Path to Net-Zero Carbon are Paying a high price
• Natural Gas Prices will likely rise in the future
• Electricity prices will rise with fuel cost as well as from inflation of components and construction costs.
• Production prices of electricity will follow fuel cost
• A Balanced Generation portfolio is Beneficial as a Hedge Against Fuel Cost Volatility
• America should learn from the experiences of Germany, CA, Hawaii, CT, MA, ME, NH, NJ and other states with high electricity costs
• States and countries that have shut down coal plants have experienced increased electricity production costs. This is not a forecast, this is fact
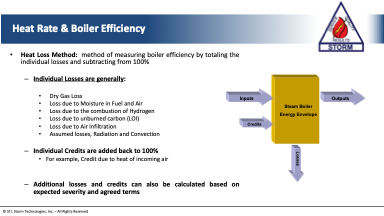
The thermal performance of the existing coal fleet can be improved by applying proven and reasonable cost mechanical tuning solutions. Coal power generation has many advantages when done with excellence in operations and maintenance. This article is based on my presentation to the EPRI Heat-Rate Conference last week and it is written for experienced electric power generation professionals, thus this is somewhat technical. The purpose is to show both the importance of coal power and to highlight some of the opportunities to improve coal plant thermal performance.
First, Apply the Fundamentals!
Our approach to coal plant performance improvement has always been: First apply the fundamentals which we refer to as the 13 Essentials for Optimum Combustion and the 22 Boiler Controllable Heat-Rate Variables. More on these later. After these have been applied, then consider modifications and upgrades of bottlenecking components.
The charts of coal use in the world below highlight the absolute importance of coal power as a major source of primary energy. Paraphrasing Mark Twain’s comment on seeing his Obituary, and applying it to coal: “The reporting of the demise of coal has been greatly exaggerated”...
Coal Remains Vital as a Source of American Primary Energy
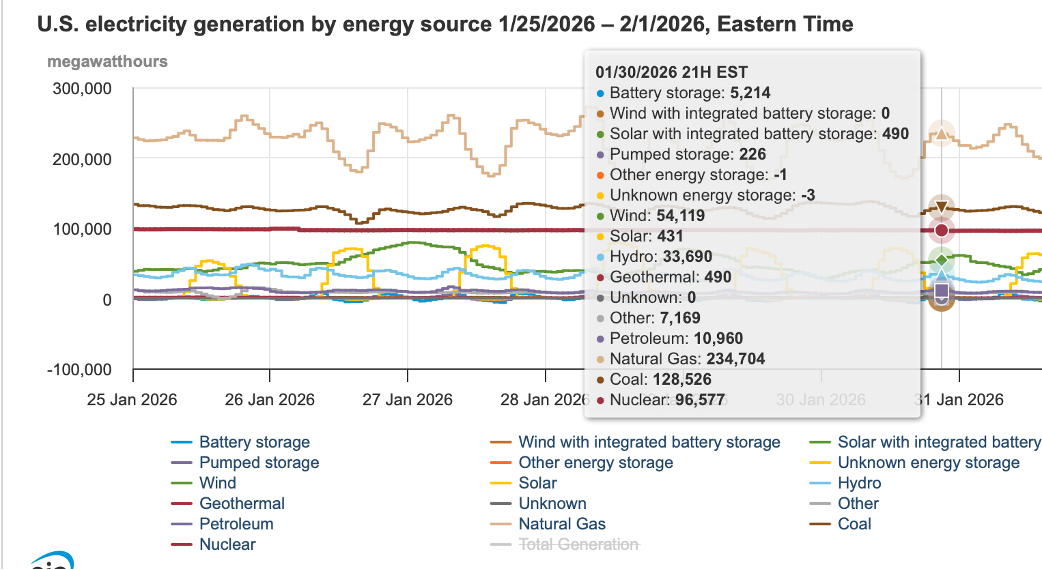
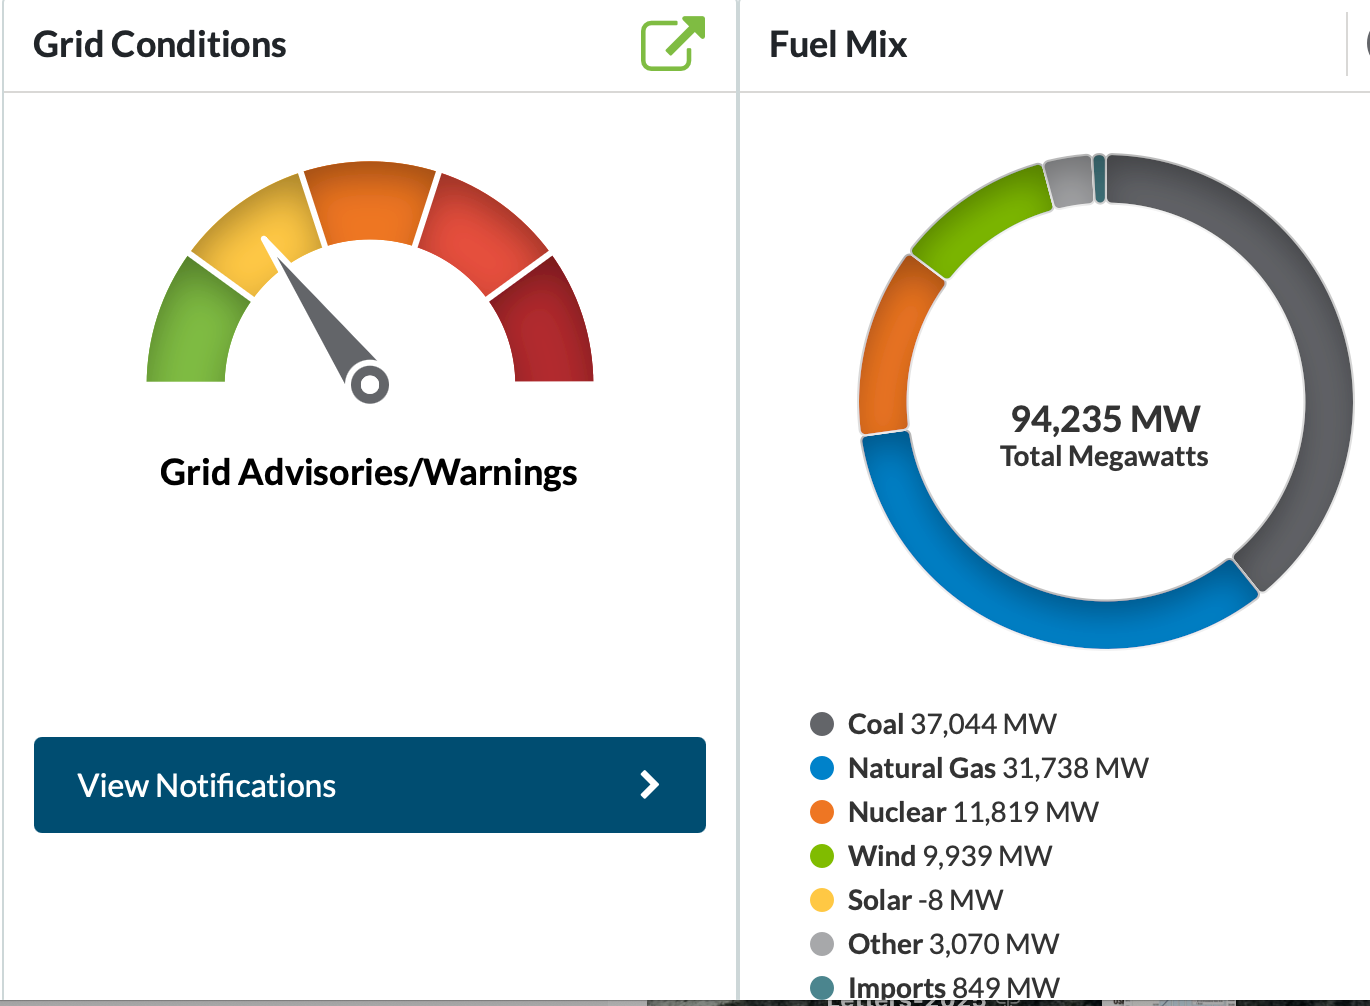
Some of us nuts and bolts practical engineers knew the importance for coal fuel to meet the demand of last week’s winter storm. The U.S. Grid Dashboard helped document that need. However, this seems new to many academics and government policy makers.
In fact, here is the U.S. electricity generation by fuel for January 30th. Note that coal is shown generating 128,526 MW. This is about 22% of the total generation. During this cold period, this is a very important 22% of Dispatchable and affordable generation.
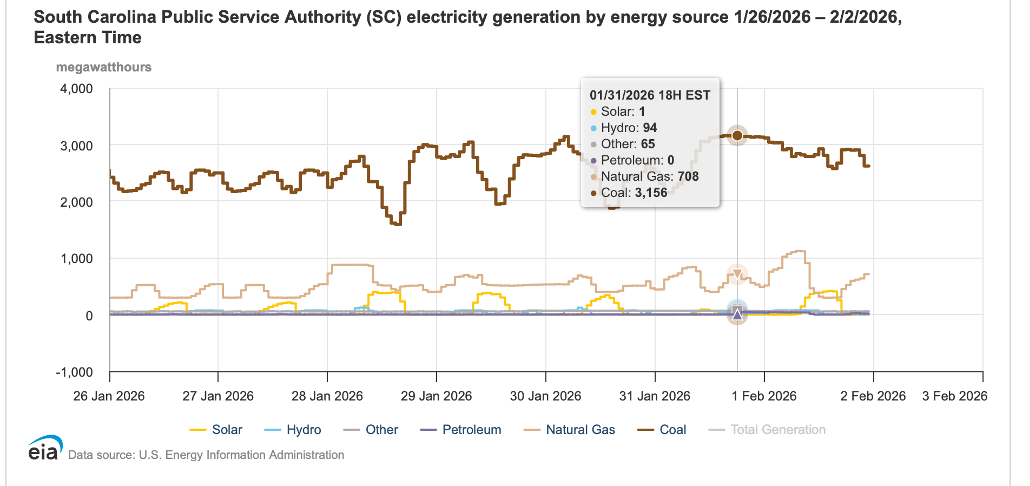
Coal powered well over 60% of the low country of South Carolina last week. To be fair, SCPSA owns about 322 MW of Summer nuclear plant and that power is not shown on the display below. Like many areas of the U.S. coal, nuclear and gas provided over 80% of the total electricity generation.
The chart below is a screenshot of MISOENERGY. For this region, coal was over 39% during winter storm Fern.
Coal literally saved the Grid during winter storm Fern. And, nearly all of the expert forecasts of electricity Demand show about 100,000 MW of new generation needed by 2030. So, my question is, why aren’t new base load coal plants under construction right now?
The charts above show the importance of coal as recent as last week. However, the Deep State Bureaucrats, NGOs. state Legislatures (including red states like S.C.) and much of the public still resist facing the energy reality that coal offers many advantages for at least the next two decades. Well, let’s move on to getting the best performance from the existing coal fleet by first, applying the fundamentals!
Getting the Inputs Right
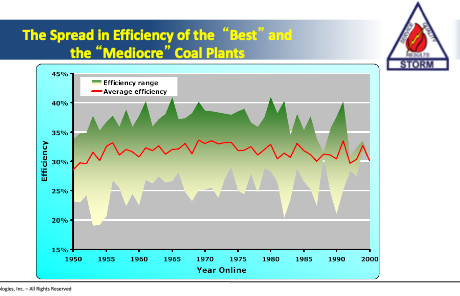
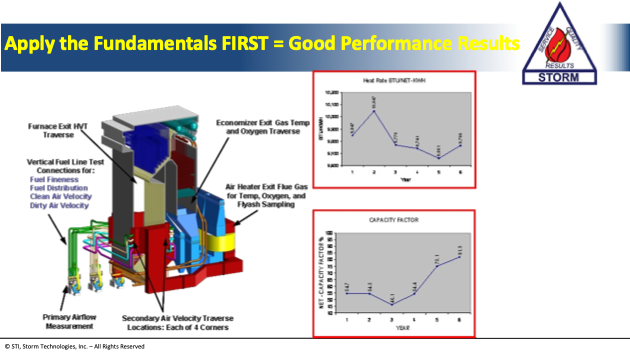
Achieving excellence in operating a coal plant takes hard work and vigilance of paying attention to the details. Rankine plants are tough, resilient and forgiving but when attention is paid to the details it can make a huge difference in heat rate. Here is a typical spread of plant efficiencies as performed by an NETL study.
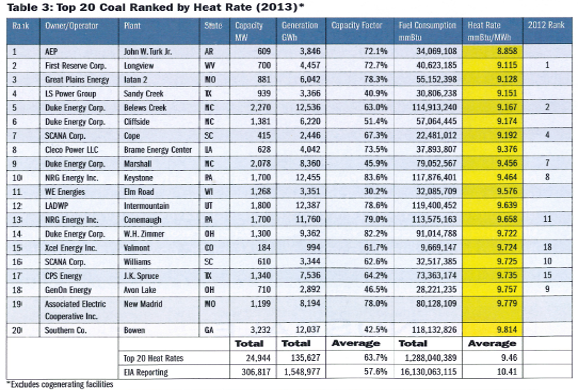
This is old timey data but, in my experience, it represents the spread between the Best Run and those that are run with Mediocrity. The chart below is from Electric Light and Power, Nov./Dec. 2014. This shows the top 20 Rankine Cycle coal plans for the year 2013. Net Heat-Rate for that year. Excellence in O&M as well as design. Notice, Turk Plant at the top of the list. More on Turk later.
I coauthored an article in POWER Magazine with Dr. Robert Peltier entitled, “How Stealth Losses in Combustion Can Lower Efficiency”. This article was based on experiences and proven results. It has been shown that by excellence in O&M, Heat-Rates can be influenced by as much as 1,200 BTU/kWh. Later a couple examples will be shown where the magnitude of 500 BTUs/kWh in Heat-Rate improvements were achieved by applying the 13 Essentials and the 22 Boiler Controllable Variables. This was accomplished by testing to identify the opportunities and then correcting them. Most of the improvements have been through optimizing primary airflow, improving coal fineness, correcting air in-leakage and reducing upper furnace exit gas temperatures (FEGT). The reduced FEGT then improves thermal performance by reducing S.H. and R.H. de-superheating spray water flow and reducing cycle losses from soot blowing.
Getting the Inputs Right!
The first step to optimizing combustion and heat rate, is to apply the 13 Essentials. All 13 are important, but nine of the 13 are pulverizer, fuel and fuel line related. This list of 13 essentials is the best and most important single document for optimizing combustion on a large PC Fired Utility Boiler. I am dead serious. These are NOT optional for a pulverized coal fueled boiler.
Some of the most common opportunities for improvement that we have found and then corrected for mechanical tuning with great results are:
Pulverized coal fineness
High Primary Airflow
High FEGT due to secondary combustion
Air In-Leakage
Air Heater Leakage
Fuel line imbalance
Secondary air imbalance
Burner tuning optimization
I know that there are other combustion tuning and controls manufacturers believe that airflow management to different zones of the furnace is not important, However, it is our experience that airflow management is in fact, crucial. We know from experience that these do work very well and where we have implemented the 13 Essentials they have always created a positive result for improved efficiency, reduced slagging, less tube metal overheating, best NOx performance, improved ESP (Electrostatic Precipitator) performance and more.
The correction of these individual items then complement each other to provide synergy which compounds the improvements. Such as: Reducing high primary airflows will usually result in better fineness, lower flyash carbon in ash losses, reduced upper furnace gas temperatures (FEGT), reduced sootblowing, less de-superheating spray water flows and reduced dry gas losses as a result of lowered tempering air flows. When all 13 Essentials have been earnestly applied and the O&M Team bought in on constantly maintaining them with vigilance, good RESULTS have been achieved. I will provide a couple examples later in this discussion.
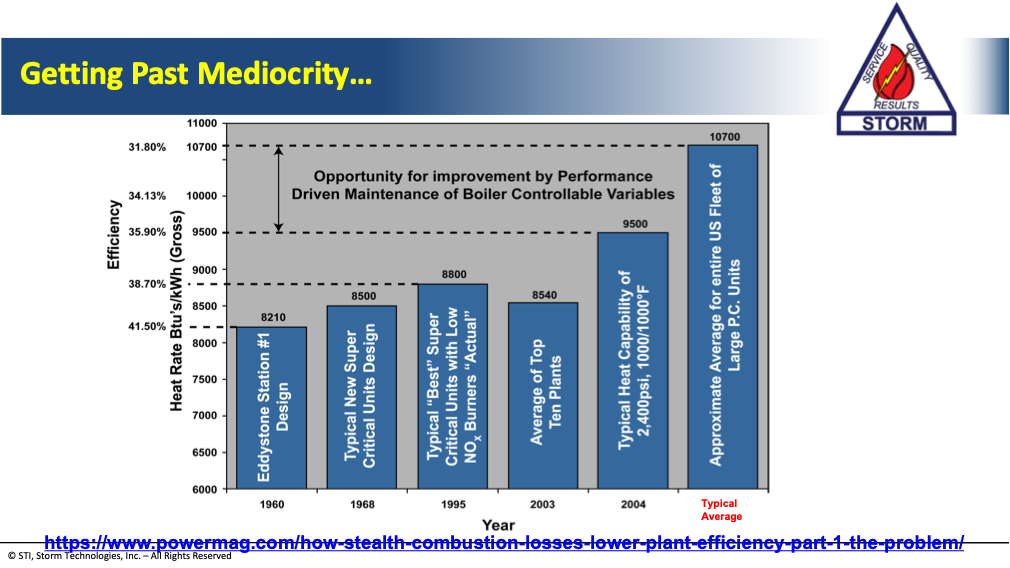
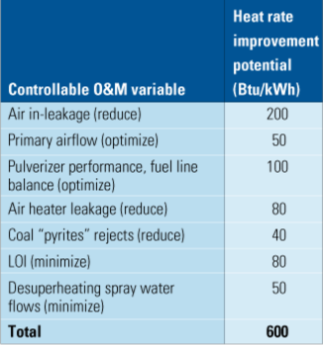
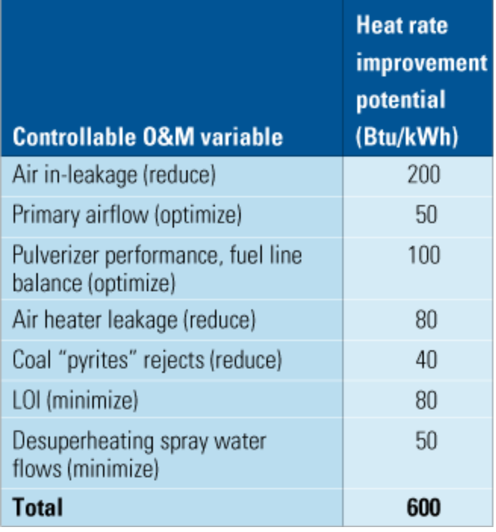
The potential improvements and the synergism between them is shown on the chart below to show how about 600 BTUs/kWh in Heat-Rate can be achieved by focusing on boiler and combustion optimization. The data and examples shown have been proven in full size coal power plants and in at least one complete Utility that adopted the approach over a several year period.
Here is a figure which shows several of the most important “Essentials” of optimum combustion. Key to best coal fineness, best airheater “X” Ratio, fuel balance and good reliability is, a repeatable and optimized Primary air curve. An example of a preferred primary airflow ramp is shown below.
Pulverizer performance is important and it has been our experience, that unless pulverizers are undersized, the fineness and fuel distribution can be corrected to within the parameters of 75% passing 200 mesh and 1.8 #air/#fuel and +/- 10% Fuel line balance. Truly, the pulverizers are the heart of a PC fired boiler.
One of the simplest tests to ascertain whether high carbon in ash is due to combustion issues or pulverizer performance is to run a three-part flyash carbon in ash test. First, obtain a representative ash sample and pass a measured quantity through a 200 mesh sieve. Then measure the LOI (Loss on Ignition) of the coarse and fine particles. If most of the carbon loss is in the coarse particles, then the high loss due to carbon in ash is pulverizer performance related. If high LOI in the fine particles, then fuel balancing, air balancing or high post combustion air in-leakage is the problem. I am not one to promote shortcuts, but this is an easy test to conduct and it is very informative with regard to combustion performance and pulverizer performance. However, the flyash sample MUST be Representative!
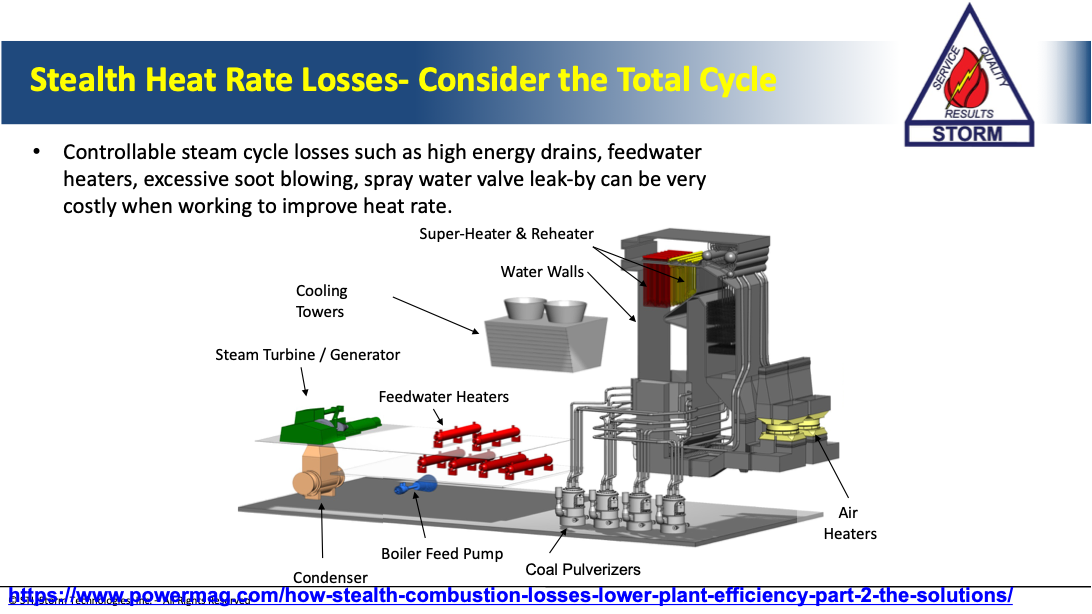
Stealth Heat-Rate Losses
Stealth heat rate losses are those losses in Rankine Cycle efficiency due to controllable losses, some are located at the Boiler Island. Here is a list of 22 Controllable Losses that are controllable by optimization of the steam generator and combustion system performance.
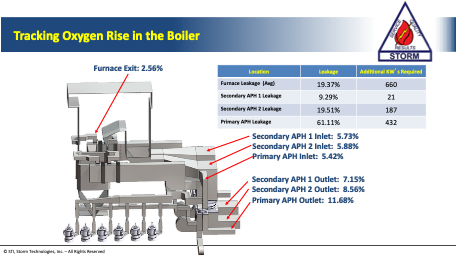
Application of these practical steps have been accomplished on numerous single units and on several total utility systems. All Utility boiler furnace exit gas temperatures should be in the range of 2,150 degrees F. to 2,,300 degrees F. Often, the first indication of a problem is in the use of an HVT probe with a 310 ss radiation shield and the metal and thermocouple literally melt. The melting temperature of 310 ss is about 2,900 degrees F. The pre-requisite for achieving good furnace performance is to apply the 13 Essentials as covered above and when the are, lower FEGT’s are attainable. (FEGT=Furnace Exit Gas Temperature)
The stealth losses compound together because of poor furnace combustion, this leads to flame quenching, overheated S.H. and R.H. tube metals, high S.H. and R.H. spray water flows, higher exit gas loss, slagging and fouling, increased draft loss, increased sootblower operation and consequent cycle steam losses, increased fan horsepower and carbon in ash losses. These seemingly small, individual issues when corrected, compound to create significant heat rate improvements as will be shown later. Never underestimate the adverse impact of poor pulverizer performance on overall unit Heat-Rate!
High primary airflow contributes to poor coal fineness, higher FEGT, increased NOx, high metal temperatures in the S.H. and R.H., requires increased soot blower operation, fouls the convection pass, air heater and SCR and much more. High primary airflows are very commonly found by our test teams. One of the most frequent opportunities for improvement.
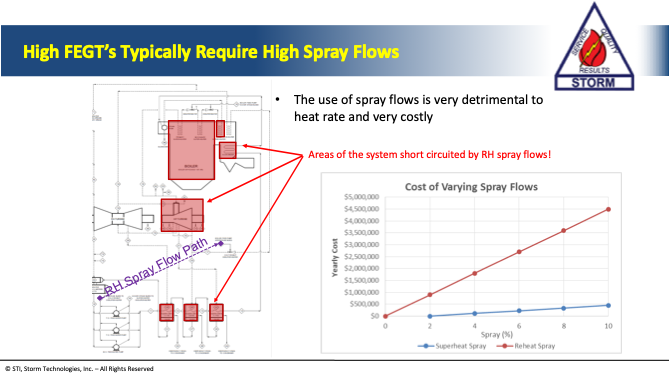
Non-optimized combustion then creates Rankine cycle Thermodynamic losses through increased de-superheating water spray flows. The R.H. sprays are particularly harmful to Heat-Rate.
Case Studies of Large Utility Steam Generator Successes
Here is an example of a 450 MW 2400 psi/1000/1000 unit which has a design best heat rate of about 9,200 Btus/kWh. In this case study the 13 essentials were applied but these alone did not correct the high FEGT. To correct secondary air imbalances windbox baffles and perforated plates were installed in the burner inlets. These secondary airflow system changes corrected secondary air maldistribution. The result was about a 300-500 Btu/kWh heat rate improvement.
However, the largest economic gain came from improved fuel flexibility where lower cost coal with a lower fusion temperature could be burned and this provided better generation economics and increased load factor operation, which also helped to achieve a better heat rate from the increased operational hours at higher loads.
The next case study is a 600 MW class 2400/1000/1000 unit in northern Kentucky. The heat rate was about 1,000 Btu above achievable. Again, first step was the application of the 13 essentials for combustion optimization. But also, a very effective team effort was organized by the plant manager to place priority on all of the heat rate factors on the steam generator and all of the balance of plant. Including the condenser cleaning and cooling tower fill corrections.
The results of the coordinated efforts of the operations and maintenance team plus the heat-rate engineer and Storm Technologies testing, resulted in a step change in heat rate improvement of about 800 Btus/kWh. The primary pre-requisite for this success was TEAMWORK! All of the O&M Team bought in on the approach and the end result was extremely gratifying to all.
The main factors in this unit’s success were: Pulverizer optimization, fuel balancing, optimized primary airflow program (reduced PA flows), secondary air balancing, correcting air in leakage, correction of cooling tower fill problems, reducing secondary combustion, reduced high spray flows, reduced soot blower operation, reduced air preheater leakage and reduced system losses.
The typical opportunities that are found are worth about 600 Btus/kWh in heat rate improvement. Here is a breakdown of where these opportunities are typically found:
A frequently found opportunity is air in-leakage. Especially on older boilers. Any air that enters the boiler setting without passing through the air preheater, constitutes a Dry Gas Loss. Also, if it is large enough, can contribute to secondary combustion due to low furnace oxygen content, upper furnace secondary combustion and high FEGT’s.
The air preheater is the last heat trap on 99% of all the coal plants we have worked. Improving the performance or ultimately replacing the air preheaters with newer, reduced leakage and higher efficiency preheaters can drastically improve overall unit performance.
For older plants and especially those that have poor performing air preheaters such as the Rothemuhle type, then installing an upgraded new air preheater can provide a step change in improved performance. It is my hope that New Source Review and any other restrictive Regulations against modifications to improve performance are gone forever.
Another upgrade option is to change the superheater and/or Reheater surface areas for optimum steam temperatures and overall performance. Also, possible changes in tube lane spacing, sootblower lane erosion protection and upgraded higher alloy tubing.
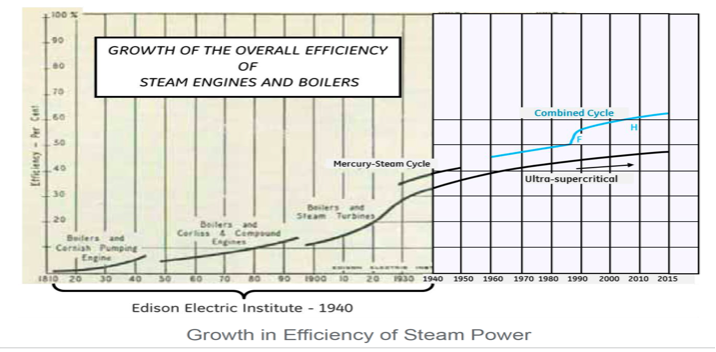
America’s last new coal plants went into service over a dozen years ago. Three of the newest and highest efficiency units are Duke’s Cliffside, AEP’s Turk and Kansas City Gas and Electric’sIatan. All of these are supercritical and capable of heat rates of about 8,300-9,000 Btus/kWh. About 38-41% thermal efficiency. https://www.powermag.com/plant-of-the-yearkcpls-iatan-2-earns-powers-highest-honor/ The Europeans, Japanese and Americans advanced the state of the art for Rankine cycle plants to approach 42% thermal efficiency. These improvements were in steam turbines, steam generator design and metallurgy. Then, we stopped building coal plants. The Chinese, on the other hand, had the advantage of applying all of the improvements that the west had achieved and then they kept on working to advance the state of the art even further. Indeed they have approached 50% thermal efficiency with their coal plant designs. However, the Chinese plant Heat-Rates are reported on a fuel LHV basis. To be a fair comparison to the Best units in America, such as Turk or Cliffside the efficiencies should be based on the fuel HHV. These Chinese units (and Turk and Cliffside) have been featured in Power Magazine.
The American advancement of coal plant design in the modern age, for the best thermal efficiency possible, began with the Eddystone Unit # 1 designed in the 1950’s.
Quest for Improved Thermal Efficiency
In my personal experiences, I began my career in the power industry in 1962. This is when Philadelphia Electric’s Eddystone Station was new. Eddystone started up in 1960. At that time, this was the most efficient power plant in the world. Steam conditions were at throttle pres. 5,000 psi 1,250 degree Superheat and two stages of Reheating at 1,050 degrees F. The design Heat-Rate from 1950’s technology was 8230 Btu/kWh or 41% thermal efficiency. Since that time, America’s coal fleet has held pretty steady for the “Best” coal plants. Eddystone was the “Best” in 1960 at 41% Thermal efficiency. The most recent U.S. Ultra-supercritical plants, Turk, Cliffside and Iatan are capable of about the same efficiency as Eddystone was. However, I should mention that today’s clean coal plants use much more auxiliary power to drive the Flue Gas Cleanup equipment. FGD, SCR, ESP’s, Baghouses etc. These were not yet invented when Eddystone started up and therefore were not installed at Eddystone. For new plants such as Turk to achieve similar thermal performance with the backend environmental cleanup gear represents a true advancement in the state of the art.
The above chart shows the Thermal Efficiency progress of heat engines, since the days of Edison, Tesla and Westinghouse. As can be seen on the chart, the U.S. gas turbine fleet has progressed amazingly well and has reached design capabilities of over 60% thermal efficiency.
At the end of my EPRI presentation I showed the POWER Magazine information on the Chinese Pingsham, Phase ll coal plant that is advertised as being nearly 50% efficient. This is based on steam conditions of 4,500 psi 1100 degrees F. steam temperatures with two stages of Reheat at 1100 degrees F. (close to Eddystone #1) The EPRI Heat-Rate Conference is a technical meeting and the people in attendance are very sharp. It was quickly pointed out that the efficiency attributed to Pingsham ll of 49+% is based on fuel LHV and not HHV. Thus, the performance of Pingsham is just a couple points above the AEP Turk Plant in Arkansas. The John Turk Ultra-Supercritical coal plant went into operation in 2012 and is about 39% efficient. The steam conditions at Turk are: 3500psi throttle, 1100 degree S.H. and 1100 degree Reheat. Design Heat-Rate of Turk is 8730 Btus/kWh (39% Thermal efficiency)
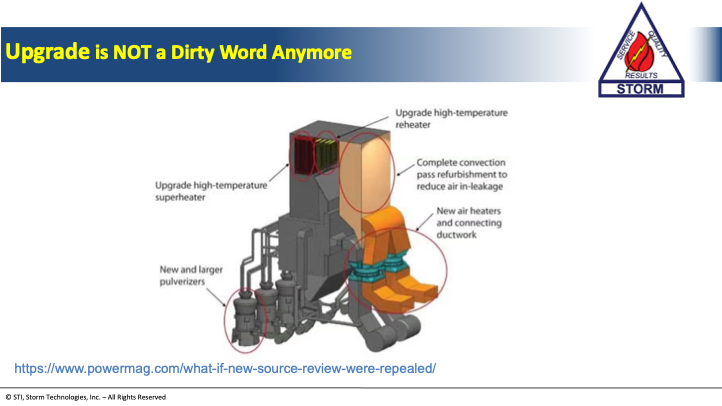
My point is, the Chinese have taken advantage of all of the engineering and operational experiences gained in the U.S. and Europe and built on these developments, experiences and knowledge to provide further advancements. Even though modest, the newest Chinese coal plants are in-fact more efficient than the U.S. newest coal plants. The Turk coal plant was started up in 2012 and only one other since then. Duke Cliffside #6, 2013, which is similar overall efficiency as Turk. Another outstanding coal plant of high efficiency, built around the same time is the Prairie States Plant in Illinois. Another point is the fact that the EPA restricted efficiency improvements for about 30 years. That is, if a U.S. coal plant implemented improvements to increase efficiency, they would be severely penalized. Now, with an energy friendly administration, the EPA “New Source Review” Rule, should not be a deterrent to implementing performance and even capacity improvements. In my view, the existing U.S. coal fleet should be capable of being upgraded in capacity, reliability, fuel flexibility and efficiency. In my Power Magazine article published in 2009, I showed several examples of plants that could be improved with new S.H. surfaces, larger fans, upgraded pulverizers and modifications such as these. The word “Upgrade” is or at least should not, be a dirty word.
The Demise of Coal Has Been Drastically Exaggerated
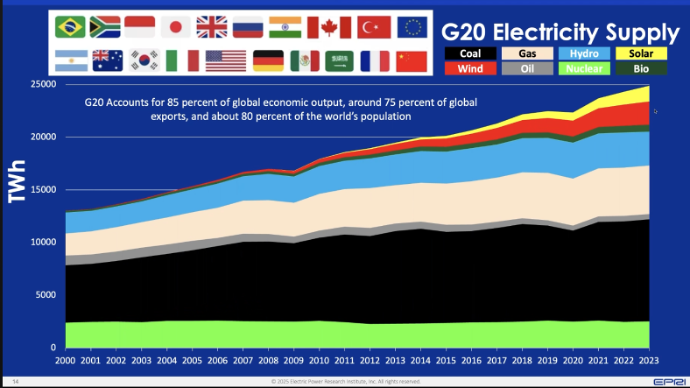
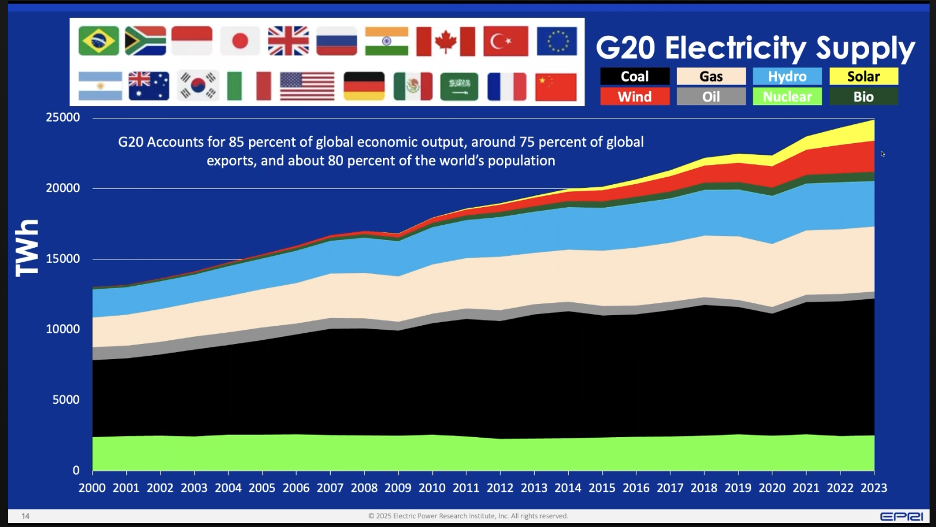
Borrowing Mark Twain’s quote on the premature posting of his obituary, coal is needed, it is being widely utilized and it will not be easily replaced as a form of primary energy. Here below is a chart of electricity generation 2000-2023 from the G-20 nations presented by EPRI. Electricity generation from all fuels has steadily increased and will accelerate the electricity growth during the next 20 years.
As mentioned above, the U.S. worked hard at advancing thermal power generation efficiency. Gas turbines and combined cycle plants have made great progress. However, the war on coal stopped American progress for improving coal plant efficiency which effectively stopped in 2012. On the other hand, China continued to improve coal plant efficiency. Here below is one example of applied excellence in obtaining coal plant efficiency. I should point out that the 49+% Thermal Efficiency is based on the fuel LHV. Still, a commendable effort and results to achieve overall thermal performance in the high 40’s% is the Best I am aware of.
Coal: America’s Treasure of Primary Energy, Why Not Use it?
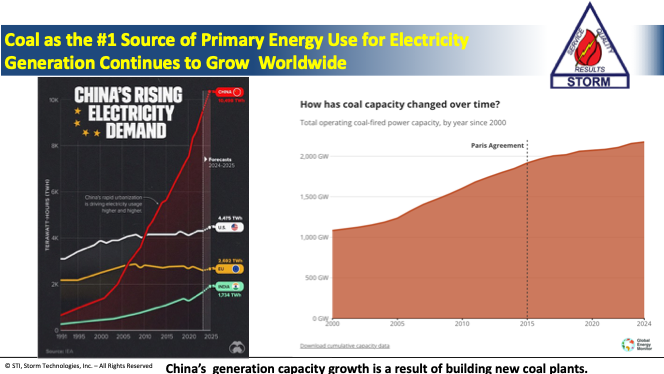
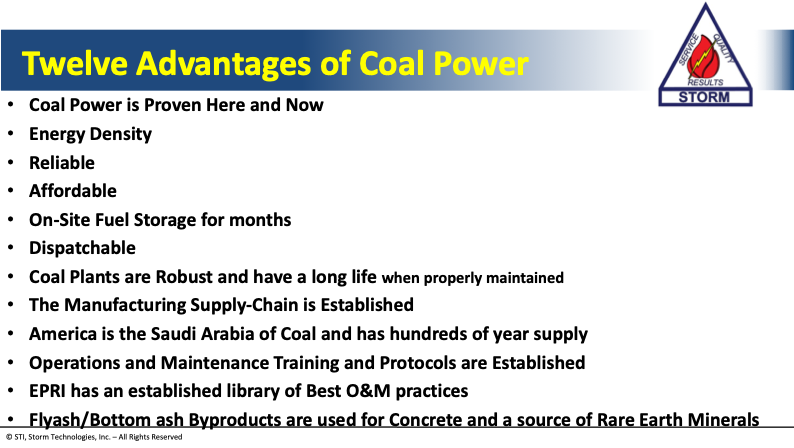
Coal power has at least a dozen solid advantages for electricity generation. Winter Storm Fern during the week of January 30, 2026 proved the importance and resiliency of coal plants. Even older plants that have not had the optimal maintenance once practiced. For reference, here is my list of the top dozen reasons that coal power is important.
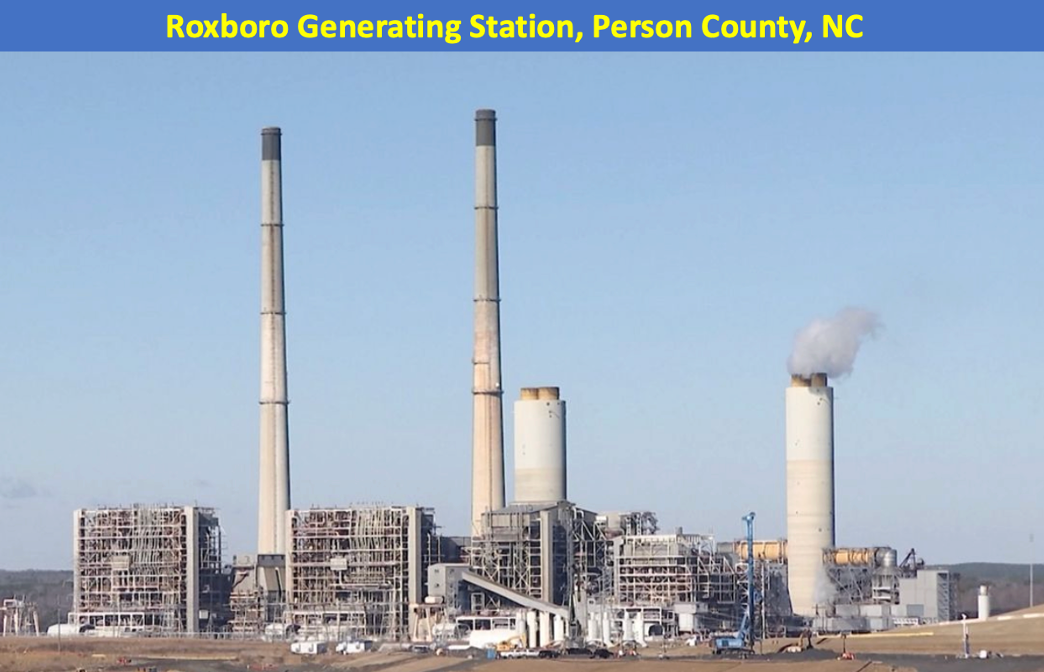
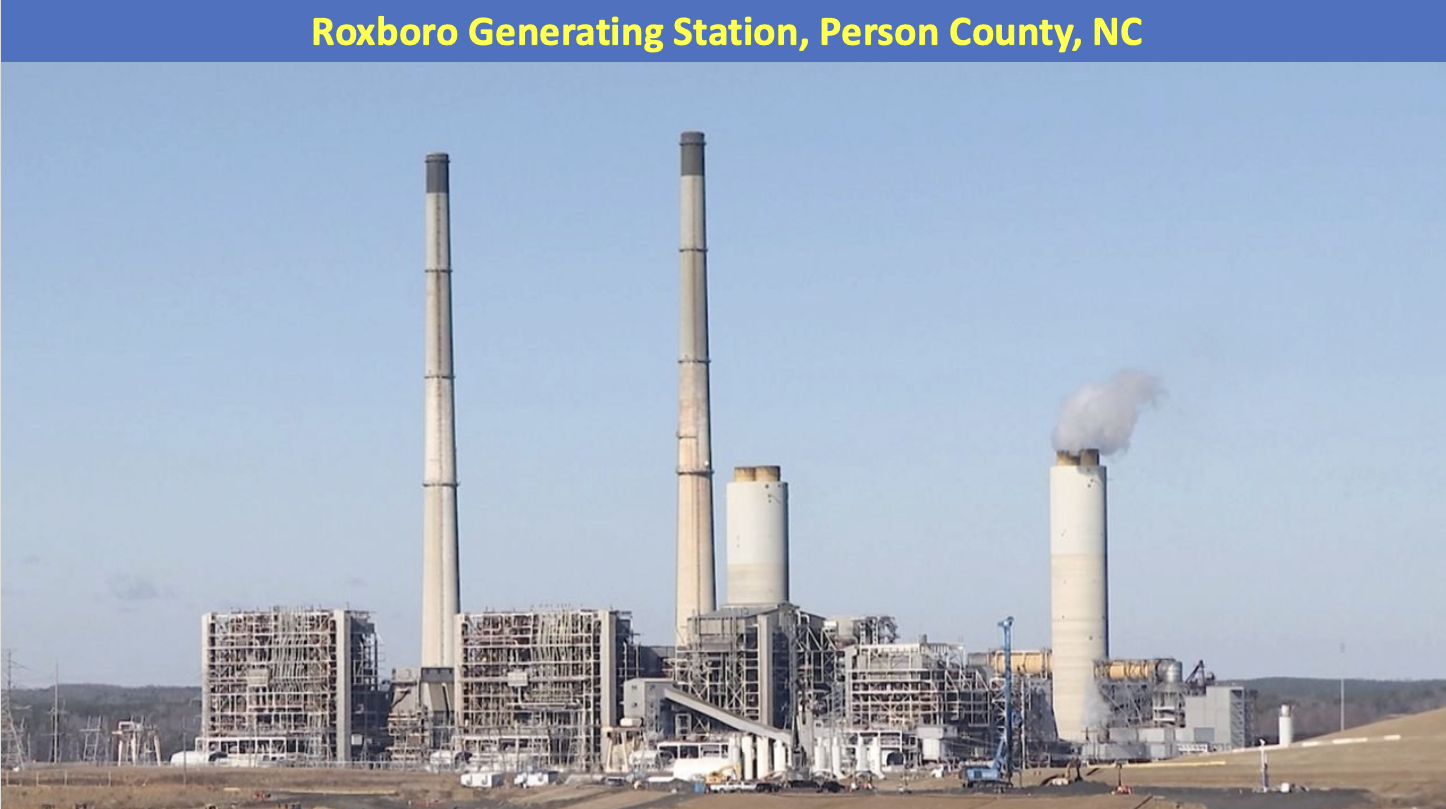
Another important reason for new coal plants is that to provide the future demand in electricity growth, it is the most viable sources of primary energy to be utilized. I wrote on this before here and here. The electricity growth forecasts all show increases of about 100 GW needed by 2030 and about 800 GW by 2050. This is a lot of power and not easily built in 25 years. For example, the Roxboro coal generating station is four units and is capable of about 2400 MW when it is in top condition. Here is a photo of Roxboro Generating Plant. The first unit started up in 1966 and the newest one about 14 years later. Over 16 years of duration from the first contract signing till the 4th and last unit became commercial. Picture building 40 plants like this in four years to achieve the needed 100 GW of new Dispatchable generation by 2030. We can hope and wish. Sadly, the limitations of the Supply-Chain of manufactured components and craftspersons make this an impossible task today.
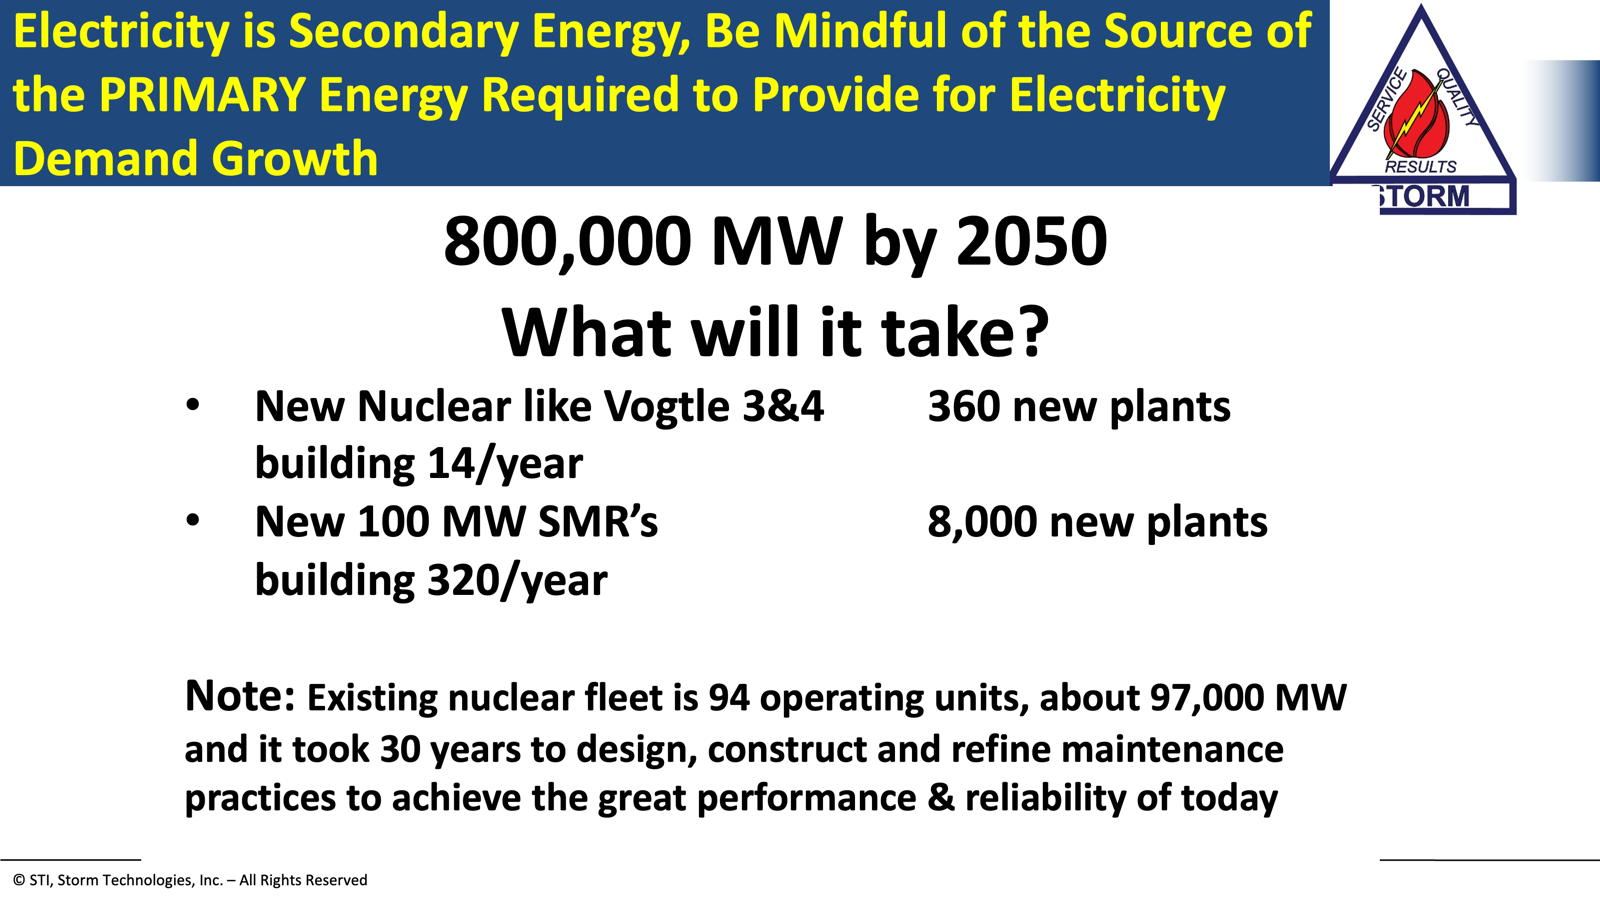
So, what are the alternatives? Here is my view of what it will take. Nuclear is loved by everyone today. However, it took Southern Company about ten years to build Vogtle 3&4 which is about 2,200 MW of new Base Load capacity. This is a great plant, now the largest nuclear plant in the U.S., but building 14 of these each year just doesn’t seem plausible.
Conclusions
Thank you for reading this. There are numerous additional articles listed below in the references.
Yours very truly,
Dick Storm, Feb. 7, 2026
The words “Modifyand Upgrade” re dirty words with the EPA for about 30 years. Thanks to a misguided EPA the U.S. existing coal plants were forbidden to be upgraded in any way other than back end environmental emission eqpment installation. Now, the EPA-NSR should no longer be a fctor. References and for further reading:
There are a number of states that are on a path to higher electricity bills and less reliability, including S.C. Why? Because the S.C. Governor and the Legislature are still stuck on Net Zero Carbon. I thought it might be informative to list 10 unpopular truths:
Hard Truths that Apply to S.C. as Well as All Other U.S. States
New nuclear plants will take decades to be built to replace existing coal and gas units
Electricity generation for Dispatchable Electricity Generation capacity takes years to build
Most of our electricity today comes from power plants that are more than 30 years old. S.C. examples: The Wateree coal plant began operation in 1970, Duke Energy’s Oconee nuclear plant, the largest in South Carolina, first unit started up in 1973, and the first Santee-Cooper Cross Unit began operation in 1984 and Winyah 1975.
The major production cost component of electricity generation for Thermal Power Plants is fuel
The proven lowest production cost of electricity is from coal, nuclear and gas
Coal prices have remained stable for decades
Gas prices are volatile and can fluctuate with market changes. Low gas prices into the future are not guaranteed
Wind, Solar, and Battery storage are higher-cost producers of Bulk Power. Forget the “Free Fuel Myth of Wind and Solar”. All states and countries that have taken the S.C. Net-Zero Carbon path now have high-cost electricity
South Carolina is on a similar primary energy path as Germany was fifteen years ago
It takes decades for the impact of energy policies to be felt by consumers and industry
Here is a presentation to the Beaufort Federation of Republican Men, which summarizes the S.C. path to higher cost electricity.
Bulk Power Supply and Demand Projections to 2052
The Supply/Demand Chart of Santee-Cooper is shown below. Note the plan to reduce coal power generation and replace it with gas, purchased power and variable renewables.
A Better Path: Build New Coal Plants
The low country of South Carolina has been well served by Santee-Cooper since 1934. Also known as South Carolina Public Service Authority. SCPSA is state owned and controlled.
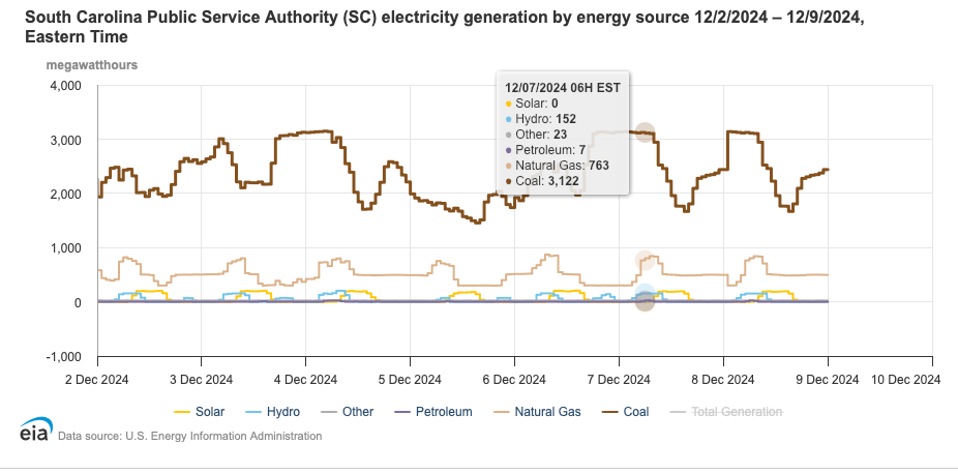
Like TVA, Santee-Cooper began with hydroelectric generation and as with TVA, the electricity demand rapidly increased to loads far in excess of the available hydroelectric capacity. Thus coal plants were built and for most of the last 80 years most of the electricity generation has been from coal fuel. This continues to be the case. The screenshot below is the electricity generation the week of December 2, 2024. The primary energy provided for the power production was 77% coal fuel at this time and it will be needed again this coming winter.
To this day most of the Santee-Cooper installed power generation capacity is coal power plants. Here is a list of their generating assets. Over 60% are dispatchable and proven to be affordable coal power. Electricity costs in our region has been amongst the lowest in the U.S. for decades. Thanks to coal fuel. As the transition to more renewables and more backup natural gas is made, the cost of Bulk Power generation will increase as it has in Germany, the UK, Hawaii, CT, MA, NJ and other states that are ahead of S.C. in transitioning from coal to more renewable energy. The so called “Energy Transition” is the root cause of increasing electric rates. Hawaii as a poster child example of a transition to expensive “Green New Deal” renewables.
What About Industry?
About a third of S.C. electricity is used by industry. This is important for U.S. security, competitiveness and for the jobs industry provides. For the low country of S.C. there are at least two very energy intensive industries; Century Aluminum and Nucor Steel. Both of these industries use hundreds of Megawatts for steel and aluminum production. The main reason the plants were built in S.C. was because of reasonable cost electricity provided by Santee-Cooper. The Century Aluminum plant at full capacity will use over 400 MW and each Nucor plant about 175 MW. These two companies alone represent 24/7 Demand that is about a quarter of the huge Cross Generating Station’s capacity.
Can We Learn From the Experiences of Germany, the UK, California, Hawaii, Connecticut and New Jersey?
Each of these states & countries have been working toward a transition away from coal and toward renewables. In each case the electric rates have escalated to the point that they have caused industries to shut down and harmed the industrial capacity of the countries or states. Electricity is the LifeBlood of an economy. Ask a knowledgeable German citizen about the results of their energy transition.
The high German electricity rates have caused many very well run and established companies to shut down and/or relocate manufacturing into other countries. Three examples are BASF, Krupp Steel and VW
The Optimum Future Electricity Generation Capacity
A Balanced generation portfolio is optimum as a hedge against fuel cost escalation, security of generation and reliability of generation. In my experience and based on the well documented experiences of other states and countries, a balanced generation portfolio of no more than 20% renewables with the balance of generation from dispatchable sources such as nuclear, gas and coal, is best. Plenty of references are listed below (also the chart above) which show the results of over-reliance on windmills solar and battery backup or BESS (Battery Electricity Storage and Supply).
Conclusions
The main point I wish to make here is that Bulk Power, that is huge amounts of electricity generation from large power plants take years, even decades to replace or to use the word more common today, Transition. Most of the vital 24/7 electricity supply to S.C. is provided by aging power plants. Examples, Oconee about 53 years, Wateree about 55, Winyah 50 and Cross about 40 years old.
As reliable, affordable and dispatchable coal plants are shut down the electric production cost will increase and along with the rising production cost, eventually increased rates.
Building new coal plants as once was planned at the Pee Dee plant site, was and still is a good idea. So is building more nuclear plants but that takes time.
My suggestion for the S.C. Legislature is to remove the Net-Zero Carbon laws that are on the books and to provide ample funds for maintenance of the existing coal plants serving S.C. so well.
Electric generation capacity of Dominion and Santee-Cooper about 12,000 MW of Bulk Power Capacity: https://datawrapper.dwcdn.net/hjyEG/5/ Duke Energy about 6600MW
The S.C. Legislature has laws on the books to exit coal power and depend on gas, nuclear, solar, wind and Battery backup systems (BESS). All of which are higher cost generation than coal. https://www.scstatehouse.gov/sess126_2025-2026/bills/3309.htm
Wind, solar and BESS systems need to be backed up by Dispatchable generation. Usually that backup (and planned for S.C) is natural gas fueled generating plants. Therefore, one reason electricity costs are higher with solar and wind is because two to four times the generation capacity is needed over a coal or nuclear plant. Solar and wind are intermittent generators dependent on nature. Solar averages about 6 hours per day of generation.
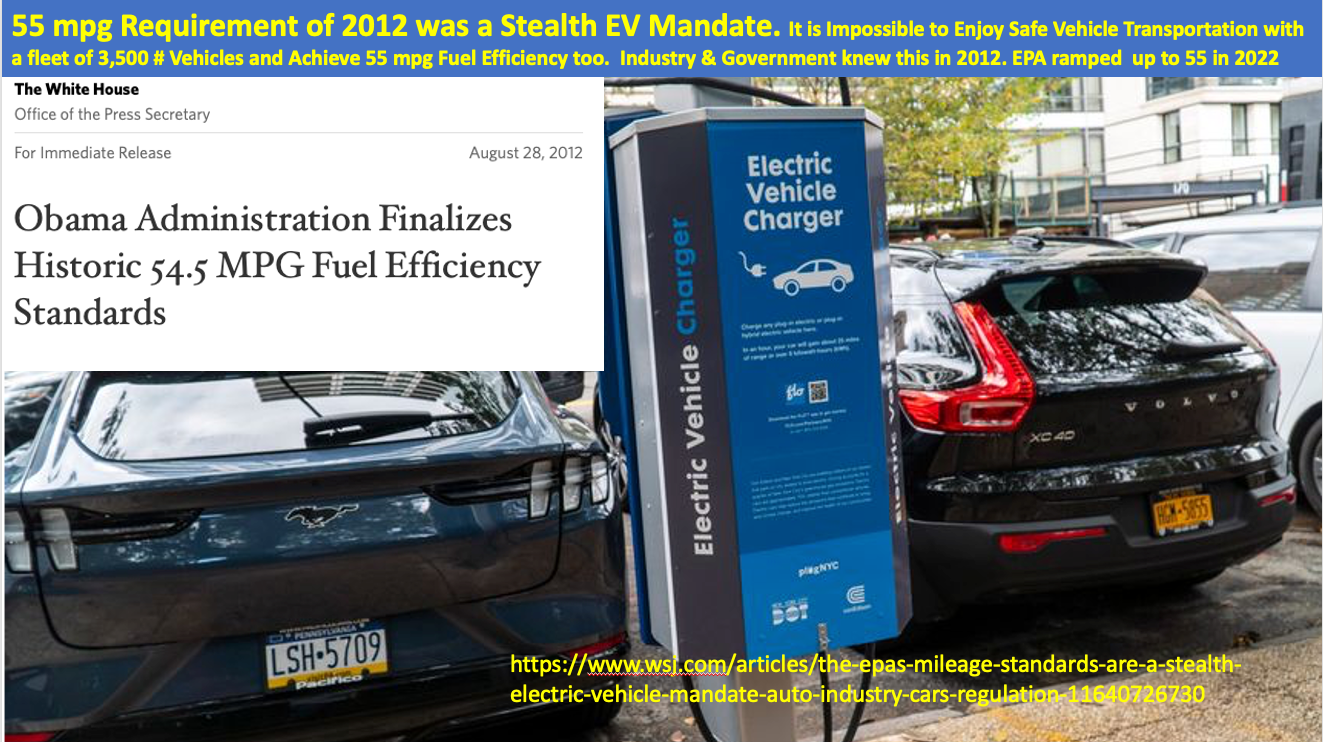
About three decades ago I became curious of those people and organizations that seemed to work in earnest against the best interests of the U.S.A. My interest began with EPA “Violations of New Source Review” How did they affect me? It was directly. Myself and our team were consulting and providing performance improving modifications (“modifications” was a dirty word with the EPA when NSR is considered) with numerous electric Utilities to improve capacity, fuel flexibility, heat-Rate (efficiency improvement) and to reduce emissions. What reward did we get for improving efficiency, reducing the cost of power generation and reducing emissions? The plant owners were fined and in some cases the plants were prematurely retired and shut down. As for my company, we just lost some business and moved on to the next opportunity. But….I remember at the time…wondering why the EPA rules that already seemed anti-American became even more restrictive and seemed to be headed toward outlawing coal for power generation? Ultimately EPA Rules leading to the “Self-Sabotaging” of our reliable power generation. That was a time when about 50% of America’s electricity was generated from coal fuel and the U.S. enjoyed amongst the lowest cost electricity in the world, the Grid was reliable and affordable. Then the Obama Administration boldly did move to literally demonize and outlaw new coal power generation plants with the “EPA Endangerment Finding” in 2010.
A reminder, Obama and his EPA created the EV Mandate in 2012. Then the escalated “War on Coal”.
Fast-forward to 2025 and now facts are coming out that perhaps the “Self-Sabotaging” of our electric grid was not driven by policies to clean the air and water. Perhaps a more sinister motivation? Here are twenty references that implicate certain U.S. politicians and China’s influence. The EPA Rules went beyond clean air and water and in my opinion, were anti-American.
The SWAMP is comprised of many nefarious actors, both foreign and domestic. Some are as innocent looking as TIME Magazine and Dan Rather on CBS News. Thank you Chris Martz, Tony Heller, James Woods, Krudkrew147, and John Stossel for these reminders of the greatest scientific hoax in history. The misinformation on science, demonization of coal and hydrocarbon fuels has literally crippled the industrial production of western civilization and helped to transfer manufacturing and the wealth it provides to China. Here are some of the domestic sources of the mischievous Climate propaganda.
A CBS News report by Dan Rather warns that if we don’t stop digging up ancient carbon and burning it, 25% of Florida will be underwater.
Posted on “X” by Krudkrew147 Captures the true facts in one meme. Was it a hoax or successful Propaganda by the CCP?
History of Energy Foundation China, according to Influence Watch
The enemies of common sense energy policies are not only foreigners. Note the American NGO’s listed in Influence Watch. To me, this is troubling, to see respected NGOs and American businesses that are aiding and abetting the CCP.
The Energy Foundation was founded in 1991 when three foundations – the MacArthur Foundation, the Rockefeller Foundation, and the Pew Charitable Trusts – recruited recent Stanford University graduates Hal Harvey, Tom Strand, and Eric Heitz to start an environmental initiative. Energy Foundation China was launched in 1999 with support from the Hewlett and Packard foundations. In 1999, the Packard Foundation helped to establish Energy Foundation China, with offices in Beijing. In 2020, Energy Foundation China separated from the Energy Foundation, whilst retaining the legacy EIN number.
Like others knowledgeable in power generation, I thought, these are actions to deliberately weaken America. They could not be done better by our country’s mortal enemies if they were in charge of the EPA themselves. So, that is where I am coming from. The purpose of this article is to review the history of Applied Political Science 1990-2023 enemies within the U.S. Some are foreign and some are domestic.
Here are previous articles that I wrote on Influencers of U.S. Environmental Policies that literally caused the Self Sabotaging of our power generation infrastructure.
The past fifteen years of anti conventional energy policies will be difficult to overcome. I applaud President Trump and his outstanding Cabinet members for their efforts to correct past anti-American environmental and energy polices. However, I fear that we have gone a bit past the tipping point of NOT building enough new generation capacity to replace that which has been shut down and in most cases, destroyed. The about 125,000 MW of coal power generation shut down since 2010 cannot be replaced by new coal or nuclear plants of similar capacity by 2030 due to supply-chain limitations. Obama, Pelosi, Biden and the Democrats have weakened our electric power generation infrastructure. Why do they seem to have a stronger allegiance to China than to the U.S.A.?
My hope and prayer is that the American people will wake up and force the Democrat politicians to begin to support Pro-American energy and environmental policies. Based on what I have observed over the past 15 years, this will be difficult for many NGOs, wealthy individuals, politicians and Bureaucrats to support restoring American Industrial productivity, as we had before Obama’s Presidency. Rebuilding the supply-chain of talent, manufacturing capacity and the “American Can Do” attitude will be hard unless the half of our country stuck on resisting Trump wakes up and supports America First.
Respectfully and very truly yours,
Dick Storm, August 7, 2025
83 References for further background (updated August. 8, 2025)
Chinese Companies listed on U.S. Stock Exchanges: As of March 7, 2025, there were 286 Chinese companies listed on these U.S. exchanges with a total market capitalization of $1.1 trillion. That valuation increased by $250 billion from the start of 2024, when this table tracked just 265 Chinese companies listed on U.S. exchanges with a total market capitalization of $848 billion. Since January 2024, 48 Chinese companies have listed on the three U.S. exchanges, raising $2.1 billion in combined initial public offerings (IPOs). https://www.uscc.gov/research/chinese-companies-listed-major-us-stock-exchanges
Sheldon Whitehouse’s new book where he will claim the opposition party does what he and his party have done very effectively, for decades: “The Scheme, where He accuses Republicans of using Dark Money”, when in fact, the Democrats do it much more: https://thenewpress.com/books/scheme
For most of the U.S. during high electricity demand periods, natural gas, coal and nuclear provide the Primary energy to provide over 75% of America’s electricity. Here is an example from July 29, 2025 during a peak load of about 745,000 MW for the lower 48 states.
The primary energy provided by gas, coal and nuclear on this day is 77%. This is for 48 states. MISO is even more dependent on gas, nuclear and coal. Here is MISO on the afternoon of July 29th. Over 79% gas, nuclear and coal. Coal was providing a vital 32.9% of total generation.
Another 250,000 MW of Bulk Power Required for 2030 perhaps 800,000 MW More by 2050
In my opinion, building 14 new large nuclear plants each year till 2050 is pure fantasy. So is building 8000 new SMRs, even though I think they are a good idea.
Natural gas plants are the easy route for Utilities to take. However, in my opinion, we have too much dependence on pipeline provided gas supply now. Also, the cost component of fuel gas for electric power production from gas turbines is about 90%. Therefore electricity production costs will nearly double if gas prices double. A Balanced Generation Portfolio is best. Here is my thoughts on a Balanced Generation Portfolio in Dick Storm’s version of a “Perfect World” of Bulk Power Supply.
The Importance of Coal Power
There are many supporters of coal power. However, we are in fact out-numbered and outshouted by many organizations that have perpetrated the Self-Sabotaging of the Life-Blood of America. I have written before on these SWAMP organizations and some links are included below for reference.
Suffice it to say, coal remains important to power America. As shown above in actual generation during this summer. Winter will prove that coal is even more important. Winter Storm Uri in 2021 showed (at least to me) the harm that premature shutting down of coal plants in Texas caused.
Increased Generation Capacity of 250,000 MW by 2030
If the U.S. electricity demand increases by 250,000 MW by 2030 and new gas turbine plants supply half of this, I suggest that the other 125,000 MW come from new coal plants. How many will it take? A lot. Here below is the Cross Generating Station of Santee-Cooper. This plant has a capacity of about 2350 MW. It would take over 50 new plants like Cross to produce 125,000 MW. Possible by 2030, probably not due to supply-chain weaknesses. However, we should start now!
Previously Published Thoughts Related to the Need for New Coal Plants in the U.S.
My comments to the American public and elected officials. It is time that you all wake up and do a little research into the primary energy that our country depends on. If competing with China is important to you, think about the advantages of using the God given treasure of energy that America has within our borders.
President Trump’s acknowledgement of the importance of energy at the Pittsburgh Energy and AI Summit is appreciated. My suggestion to Governor Shapiro and state Legislators in the Great State of Pennsylvania is: Remove the Regulatory Obstacles that stand in the way of building new coal plants. Just a day before President Trump’s Summit, I presented my analysis of the need for new coal plants at the Coal Institute. Not only the need for new coal plants, but also the fact that the primary energy of coal is the only source to use for major Bulk Power generation, 24/7, affordable, Dispatchable, storable and proven, before 2035.
Coal remains an important source of primary energy. If the laws of Physics, Common-Sense and Economic sanity prevailed, America would be building at least a hundred fifty green field or updated design HELE coal plants to serve Pennsylvania and the growing U.S. Demand for electricity across all 50 states. At the end of my presentation to the coal Institute I included sobering facts and data on the use of coal by China. For the U.S. to win the competition with China for AI dominance and to reshore manufacturing to the U.S., more new plants delivering reliable, affordable, Dispatchable coal power are needed.
There is One Source of Primary Energy that Can Provide Fuel for the Extreme Growth of Electricity Demand in the next Ten Years, Coal!
The growing electricity Demand will be difficult to generate without significant additions of new Dispatchable generation. Natural gas is the predominant fuel of choice, the easy path for Utilities to add generation. However, there are limitations to continued growth of gas generation to let’s say 100,000 MW or more by 2032. Meanwhile, electricity Demand is soaring at over 2% per year and by 2032 the increased peak demand is likely to be in the magnitude of 250,000 MW more.
There is One Fuel that Can Generate the New Power Demand
Natural gas is already providing about 43% of U.S. power generation, the supply-chain for new gas plants is limited and the risk of a single point of failure of “just in time” gas supply, doesn’t seem prudent to me. Nuclear is highly regarded and hoped for. I support more new nuclear generation. However, green field nuclear capacity additions in the magnitude of 250,000 MW will take decades to accomplish. Keep in mind the existing nuclear fleet which generates about 18% of America’s electricity now is from old nuclear plants most of which are over 40 years old. It took about 30 years to build the existing 97,000 MW of nuclear generation capacity. The Georgia Power Plant Vogtle additions of units 3 & 4 about 2,200 MW took ten years to design and construct.
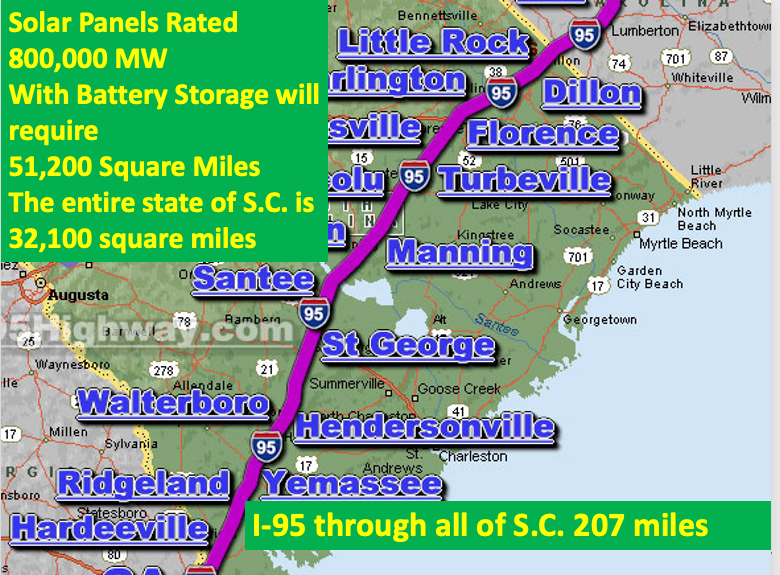
Solar capacity in this magnitude is not practical and should not be attempted due to the enormous land use required. The 800,00 MW expected to be needed by 2050 would require solar farms about the size of 1 1/2 states the size of South Carolina. So, solar has its limitations.
Planned Solar Generation in PJM
Chris Moran of PJM presented an excellent presentation to describe the operations of PJM and how the PJM Interconnection functions. A very informative and well prepared presentation. Near the end of Chris’s presentation he showed the planned new generation for the PJM territory. Here is a screen shot of one of the slides. Yes, 63% Solar.
Conclusions:
It is Impossible for Solar and Wind to meet the Demand for new electricity in Pennsylvania to satisfy the needs of new AI growth and electricity for the return of manufacturing to the U.S.
Natural Gas remains important, but PJM and most of America is already dependent on too much natural gas for Base Load generation
The Supply-Chain of equipment to build efficient gas turbine, combined cycle plants is already stretched to meet the surging Demand
New nuclear plants will take at least a decade to provide significant new Greenfield Bulk Power generation in the range of 10,000-20,000 MW’s of new capacity
Coal plants can be built in less than ten years
Pennsylvania, West Virginia, Wyoming, Illinois, Texas and other states have enormous reserves of high quality American Coal. We should use this Domestic Treasure of Primary Energy
It is my hope that Chris Wright and President Trump read this message. I strongly stand behind the talk I presented at the Coal Institute, this blog post and others that support coal power generation.
Several of my friends and myself have given presentations and written reports on how America has created energy and electricity generation policies that will Self-Sabotage electricity reliability. Last year I wrote on my blog, “Threats to the Electric Grid” with an emphasis on harmful U.S. EPA policies. At the time of writing, I was aware of Chinese mischief with large Utility scale transformers, but had not thought about the seriousness of this threat. Last week, I was contacted by my friend Dave Walsh and asked to join him and several others on a panel with Frank Gaffney for a webinar entitled, “Inside Our Wires: The CCP Has Penetrated Our Electric Grid, Will Xi Destroy It?” The question threaded through the discussion: “is this part of the CCP’s Unrestricted Warfare?”. The webinar is summarized below.
It is beyond dispute that the so-called “Green New Deal “– and the misleadingly named Inflation Reduction Act that has massively subsidized its adoption – has greatly weakened the reliability of America’s most critical of critical infrastructures: the electric “grid.” That has been the practical effect of the putative “sustainable energy movement” with its obsessive focus on reducing, if not eliminating altogether, coal-fired power-generation, nuclear energy and even natural gas-powered dual-cycle turbines.
Such problems are being exacerbated by governmental and commercial interest in artificial intelligence and the necessary, vast expansion in the number of data centers around the country, with their endless appetite for additional power for operating and cooling their server farms. Such demand is, in turn, translating into greater and greater reliance on the principal source of “green” solar panels, windmills and electric batteries, namely the Chinese Communist Party (CCP).
Recent revelations that inverters associated with such Chinese products have been equipped with “kill switches” that would disable or even destroy them remotely make the prospect of serious, sustained and/or catastrophic interruptions of power at the hands of the CCP a distinct prospect. Ditto the 400+ Chinese-manufactured high-voltage transformer that comprise the backbone of our grid, at least two of which have been shown to have similar “backdoors.”
The Committee on the Present Danger: China webinar May 22, 2025 explores how on earth these potentially nation-ending vulnerabilities were ever allowed to exist in the first place, let alone to metastasize to the clear benefit of our mortal enemy, the CCP, as they have. The panel will also consider what must be done immediately to mitigate them.
Moderator: Frank Gaffney, President, Institute for the American Future; Vice Chairman, Committee on the Present Danger: China
Panelists:
Col. Grant Newsham, U.S. Marine Corps (Ret.) – Topic: “The CCP Inside Our Wires: The Strategic Implications” Charles “Sam” Faddis – Topic: “The CCP’s Imbedded Trojan Horses: Donald Trump’s Effort to Shut Them Down; Joe Biden’s Reversal of His Directive”
Dave Walsh – Topic: “The Magnitude of the CCP Threat to Our Most Critical of Critical Infrastructures – The U.S. Electric Grid – and What Can We Do About It? ” Dick Storm – DickStormProBizBlog.org – Topic: “How Did the CCP Get Inside the Grid: The CCP’s ‘Old Friends,’ the Red-Green New Deal and the Challenge of Our Time”
As is often the case when one becomes involved in a meeting/discussion such as this, new and different perspectives are learned….as in my case. I came away enlightened from the experience of being with these gentlemen. The purpose of this article is to share the information that I learned last Thursday. I think it is important to do so.
My Take Aways From The Webinar
I will summarize my take aways. However, the full transcript is available for anyone interested in reading it and of course, the video link is included above. I will list those points that I think are very important and unfortunately, not very well known by the American people due to malpractice of the MSM.
The CCP has been working on penetrating our Grid for many years
The politicians that pushed the “Green New Deal” which morphed into the “IRA” may have been influenced by foreign Dark Money to deliberately create self sabotaging energy policies, referred to as “Climate Policies” See the Capital Research Center reports listed in the references at the end for more information
America’s Supply-Chain has been weakened by De-Industrialization of the U.S. and much manufacturing being transferred to China
China is the beneficiary of U.S. De-Industrialization
America’s Reliable and Dispatchable Generation Capacity has been steadily reduced since 2010
Over 90% of New Generation Capacity installed to replace coal plants, has been solar and/or wind
Electricity generation Reserves have declined from about 25% a decade ago to about 15% and are still declining
The Supply-Chain of Engineering and Craft Labor Talent, raw materials and manufacturing is NOT as capable today as it was in 2010
America’s Grid is vulnerable to nefarious actors, whether Russian, Chinese or other
A Reminder of the CCP Plan, Unrestricted Warfare
About February 2020 a friend sent me a link to a New Delhi news program, WION, – Gravitas, with Palki Sharma Upadhyay the reporter. The courageous lady presented a 15 minute or so program on how the CCP had spread the Wuhan lab created virus as part of unrestricted biological warfare. The book “Unrestricted Warfare” and its theme of increasing China’s strength in the world and overcoming U.S. strength was highlighted. I saved an MP3 version of that program. Interestingly, I could not find a live link of that particular program today. It appears to have disappeared? Here is another one from 2021 where Ms. Sharma discusses the CCP and unrestricted warfare plans about a year later.
The book “Unrestricted Warfare” is available on Amazon.
One of the better-known alternatives in this book is the idea of attacking networks. Networks are increasingly important in not only data exchange but also transportation, financial institutions, and communication. Attacks that disable networks can easily hamstring large areas of life that are dependent on them for coordination. One example of network warfare would be shutting down a network that supplies power.
If there is a significant failure in the power grid caused by the attack, massive power outages could result, crippling industry, defense, medicine, and all other areas of life.
Conclusions and Summary
For many years since Obama was President, I wondered what was he and the Democrats thinking? Why were they working to implement policies that would weaken America? The fact is, the climate policies of Obama, Biden and the key Democrats in Congress, whether intentional or from green indoctrination has in fact, weakened America’s infrastructure and made us vulnerable to outside nefarious actions. The reading list below will augment the video discussion of PresentDangerChina.org
Thankfully, now Donald Trump is President and we can pray that God will continue to Bless America. There is a lot of work to do to correct years of poor energy policies.
General Robert Spaulding on YouTube, discussing China’s “Unrestricted Warfare”: Robert Spaulding on China’s “Unrestricted Warfare” 2020 on YouTube https://www.youtube.com/watch?v=PT8LRZAonQA
Title of the prescient 2023 book by the late Mr. Donn Dears.
Mr. Dears wrote many books and several are listed in the references below. His last book, “Clean Energy Crisis” was written before the announcement of many Data Centers were to be built and would drastically increase the rate of electricity usage. Mr. Dears wrote much on the flaws and fiction of Net-Zero Carbon and dependence on electricity by carbon-free forms of power. In fact, his statements written in 2023 regarding “What would it take to replace Fossil Fuels” are listed below: Remember, this is before the advent of AI Data Centers.
Here is what Donn Dears calculated in power generation by 2050 from the combination of Wind, PV Solar, and Nuclear:
995,141 Wind turbines of 2.5 MW each
3,918,996 MW of PV Solar
881 new Nuclear Units like Georgia Power’s Plant Vogtle Units 3 & 4
In summary of this, Mr. Dears writes: ” It is not possible to generate all the electricity needed for electrification of the economy (including the replacement of ICE vehicles and BEV’s, and the replacement of natural gas for heating with electric heat pumps) by relying on wind, PV Solar, or nuclear power, whether alone or in combination”
Thank you Donn Dears, we miss your great engineering talent and visionary work. RIP my friend, your numerous published books, blog and voluminous published technical articles warned us. It is my hope that the state and Federal Bureaucrats who create laws and regulations, will read your books and all available publications.
The Importance of Coal Power
Previous articles by me and others have highlighted the importance of coal power. Especially during peak Demand in the winter. As this is written, it is May and the period between March and May, in the U.S.A. lower 48 has always been a period of low demand, due to the mild weather not requiring much heating or cooling. The crisis periods are peak summer, July-August and winter December-February. Coal has unique and proven benefits for power generation. Such as long term on-site storage.
Here are a dozen articles that cover the importance of coal power for electricity reliability, affordability, Dispatchability and National security.
Generation of the power required for our country to remain the #1 world economy and to sustain our high quality of life will require much more electricity generation capacity. The EIA, NEMA and IEA forecast that electricity demand by 2050 will increase by 50%. (In my opinion plus the opinions of Stephen Heins, Chris Wright, Thomas Shepstone and others… this is conservative considering AI Data centers and plans to reshore manufacturing)
Satisfying this Demand increase will need to come from conventional forms of proven Primary Energy. Those proven forms of primary energy for electricity generation are natural gas, nuclear, coal and hydro-electric.
A 50% increase in capacity will be about 600 GW of generation capacity from the current 1, 200 GW of installed capacity. The 50% increase is also reported by NEMA report. So what sources of power can supply this enormous amount of growth of electricity generation Demand?
Let’s be realistic. For reliable, Dispatchable power, 24/7 that generation must come from coal, gas or nuclear. Here is my take on this. For gas power production G-E has reported record sales and the shops are full till about 2030. They hope to produce about 54 GW of power production by 2030. Let’s say with facilities modernization and expansion by 2050 they can produce say 300 GW more. That gets us to about 350 GW by 2050. Yes, I know there are also other Gas Turbine manufacturers such as Mitsubishi and Siemens. But….in my view we are already too dependent on “Just in Time” pipeline supplied gas. America is now about 45% dependent on natural gas for electricity generation.
Nuclear is well proven and has provided about 20% of our electricity for decades. However, expansion takes time and the Supply-Chain needs to be rebuilt. Back to Donn Dears forecast of 881 new nuclear plants by 2050. We must remember it took Georgia Power about ten years to build the 2200 MW expansion at Plant Vogtle. So, nuclear should be included in the portfolio of new generation. However, the entire U.S. Fleet of about 94 operating nuclear units took about 30 years to design and construct. 1957-1987. The current operating nuclear plants represent 97 GW.
I know this is rough, back of the envelope estimating, but so are all forecasts.
So, if gas plants can provide say 350 GW of new capacity and new nuclear units another 200 GW (I may be optimistic on doubling existing fleet capacity, considering the age of existing plants and the fact that some will be retired by 2050). Where do we get the remaining 50+ GW of required electricity generation capacity? I predict much more than 50 GW of new coal or other Dispatchable power will be required before 2050 and we must absolutely consider the retirements of existing coal plants. According to the Washington Times article, over 117 coal plants are scheduled to be shut down by 2030.
My suggestion is build at least 125 GW of new coal plants. This is about the same capacity as has been shut down and demolished since Obama was President. It will not be easy to do so.
A large coal plant can be imploded with explosives in about ten seconds and reduced to a pile of rubble as Green supporters cheer. However, to build a magnificent, Dispatchable, Reliable, and Affordable 600 MW coal plant will take about five years after the permitting is completed.
My next article will be on the challenges of building 125 GW of new coal plants.
Dick Storm, May 2, 2025
References and for Further Research using respected and factual sources
Thank you President Trump for your leadership and courage to support American Energy Independence and to start a new Golden Age of Economic Prosperity. A thriving economy today is powered by electricity and the electricity Demand is growing at the highest rate in decades. According to Utility Dive and Grid Strategies: “U.S. electricity demand could rise 128 GW over the next five years, driven by data centers and manufacturing growth primarily in six regions of the country, according to a report published Thursday by Grid Strategies. The “shocking” estimate represents a five-fold increase in load growth forecasts over the past two years”
POWER Magazine Headline in the April edition:
Nation’s Power Operators Warn Congress of a Coming Reliability Shortfall
“Explosive Load Growth Is Now a Certainty—Driven Largely by Data Centers and AI”
The forecasted shortages are serious. As this is written, it is “Outage Season” in April when electric Demand has typically been very low due to naturally mild temperatures not requiring much air conditioning and very little heating of the lower 48 states. PJM is a good example of the forecast for peak summer and winter loads in just the next few years. As published in POWER Magazine….
“Projected growth:PJM expects its summer peak to increase by approximately 70 GW-from 150 GW in 2024 to 220 GW by 2039-nearly 47% rise over 15 years. Winter peaks could climb to 210 GW by 2039, a 45% increase from the current winter peak of 144 GW.
What to Do?……..
My Suggestion: Build New Coal Plants
Here are my suggestions regarding a Balanced Energy Portfolio which uses coal for at least 30% of America’s electricity generation portfolio. Fred Palmer and Frank Clemente wrote an excellent article on the “Value of Coal”, here. Another, “Subsidized Solar and Wind Is Undermining the Grid, While Coal Provides Reliable Baseload Power, But Trump Is On It!” by Thomas J. Shepstone and the IER here.
Four of my previous articles on the importance of coal power as a significant source of primary energy are here, here, here and here.
The Importance of Primary Energy
America is facing a shortage of reliable, affordable and Dispatchable electricity generation. As summarized in Palmer and Clemente’s Value of Coal article, coal is a proven source of primary energy that meets all three criteria, affordable, Dispatchable and reliable. In addition, it is on-site storable energy. The experiences and end results of using renewables has been much higher costs and less reliability than coal. I wrote an article with electricity price comparisons of the states with the highest cost electricity compared to those states and countries using a high percentage of coal. The highest cost electricity is in states which are on a path to shut down coal plants and use more wind and solar, such as Hawaii, California, Massachusetts, CT, RI and Maine.
The U.S. electricity generation growth is expected to double by 2050. Remember the governments encouragement and EV policies to “Electrify Everything”? We cannot electrify everything, but the electric Demand is likely to double by 2050. Therefore, providing new generation capacity to meet that growth can and should be by the building of new American made coal power plants. Why not Nuclear? Sure, new nuclear plants should be built too. However, new nuclear plants are, in my estimation, more than ten years out due to limitations of the Supply-Chain and (even with President Trump) NRC permitting. The coal plant Supply-Chain and talent can, in my experience and opinion, be ramped up faster than nuclear. Thus, the case for constructing new coal plants ASAP. Back to primary energy. electricity is secondary energy. It must be generated by the use of primary energy and as I wrote in my commentary in POWER Magazine in 2021, “Thermal Power is #1”
Conclusions of How to Solve the Electricity Generation Capacity Crisis
The forecast of needing 128 GW of new electricity generation capacity by 2030 is very close to the total capacity (125 GW) of coal plant shutdowns since 2013. So, why not replace at least that quantity of electricity generation with new clean coal plants?
The Supply-Chain for building new coal plants could in fact be ramped up faster (but NOT Fast enough) than the Supply-Chain for new nuclear generation capacity in the same time period. The Gas Turbine Supply-Chain is already at capacity and new gas turbines have lead times of four or five years.
Building 128 GW of new coal plant capacity is a huge undertaking. I have written before about my personal experiences at the Roxboro Generating Station and other 2,000+ MW Coal Plants. It took over fifteen years to build all four units at Roxboro, (first commercial operations 1966-1980), Each unit required about 2,000 skilled craftsmen to construct the units. The 128 GW figure represents over 50 plants the size of Roxboro. To construct a 2,462 MW coal plant it would take about 80,000 tons of structural steel, a million tons of concrete and tens of thousands of miles of wire and yes, likely more than ten years to complete from permitting, design, component manufacturing and field construction stages through commercial operation. Just one of the four units, Roxboro #3 became a contract in 1968 and began commercial operations in 1973. It took two more years of debugging to reach full capacity. I know, I was the lead startup engineer. That was then and with a vibrant and capable supply chain.
From a skilled talent perspective, this is a lot of engineers for design, Boilermakers, Pipe fitters, Iron Workers, Instrument Technicians, electricians and many more skills for the construction. Than there is the manufacturing supply-chain. One example is the once magnificent Manufacturing facilities at Combustion-Engineering’s Chattanooga Works. Now this is gone. A previous article covered the power generation supply-chain of the 1970’s here…The challenge is formidable, we should start now.
Warm regards,
Dick Storm, April 18, 2025
References and Information for Further Research on “How we Got Here” the Importance of Primary Energy and more for your reading enjoyment and enlightenment of energy policies in America.