Category Archives: Basic Energy Knowledge

The Magnificent and Indispensable Heat Engine On Which Civil Society Depends Part 1, Heat-Engines 1-3 Million Horsepower

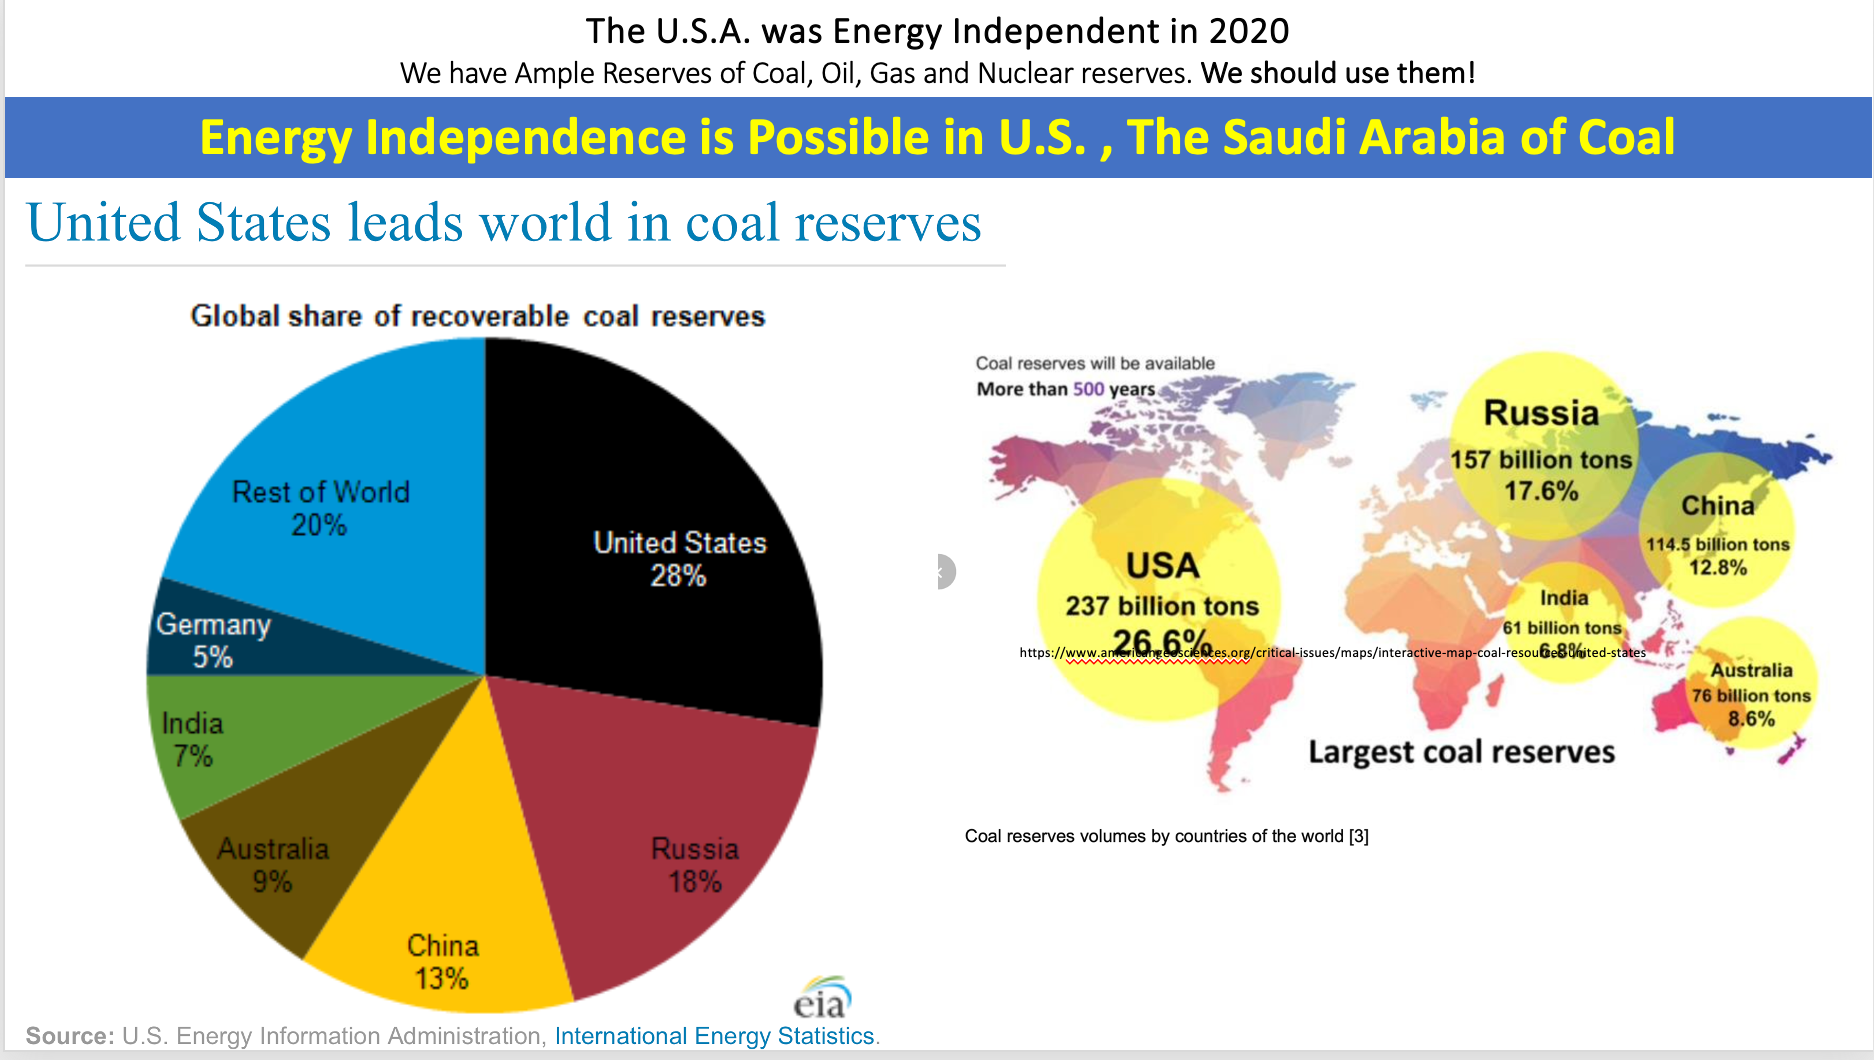
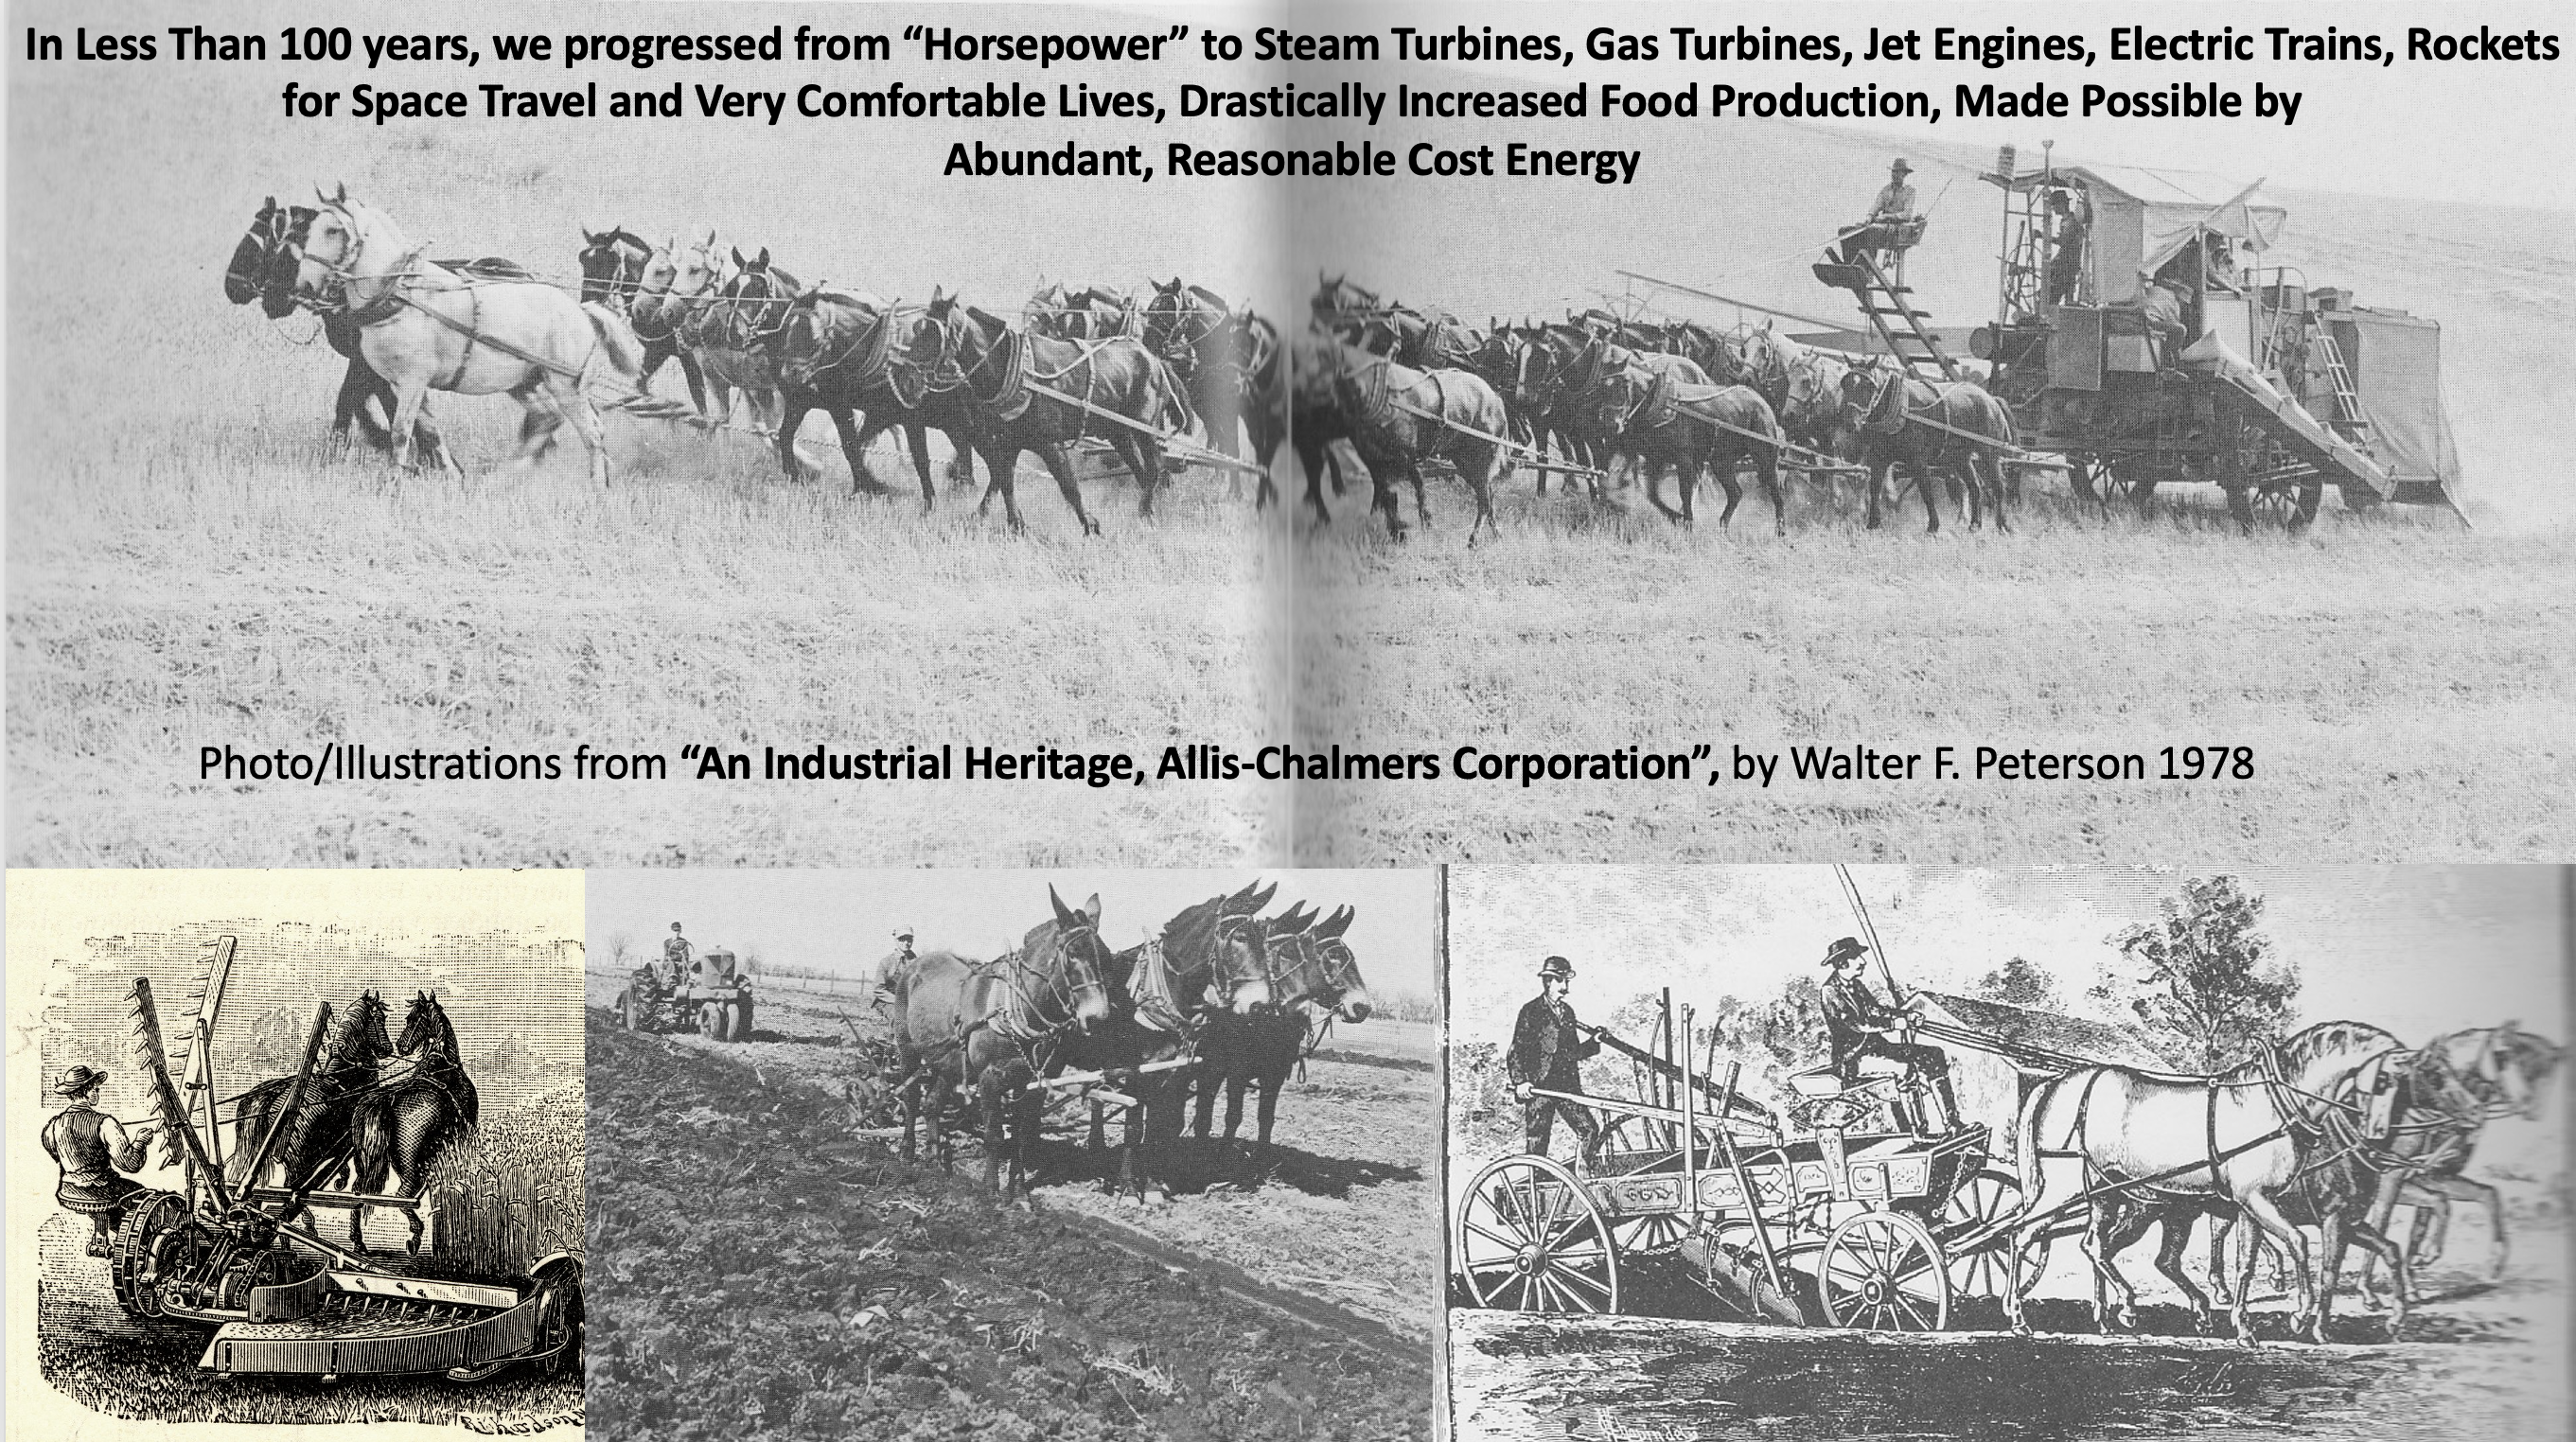
The 20th century began with much farm work, transportation, heating and home chores being done with muscle power and wood burning. As coal, petroleum, natural gas and later nuclear energy were applied to replace muscle power, our country experienced rapid growth in industrial production, food production, shipping, travel and a growing economy. Also, comforts and conveniences at home and work such as air conditioning, refrigeration, cooking, dishwashers, automatic washers, and more. A previous article on the history of energy is here. That 105 year period 1850-1955 yielded incredible growth in both industrial output and economic growth. The strength of the U.S. grew and expanded for the U.S. to become the Greatest country in the world, with the largest economy in the world. This was made possible by many factors, including; the Judeo-Christian work ethic of the people, Liberty, Capitalism, Free Markets, creativity, inventiveness, innovation and the abundance of God’s given treasure of Domestic energy resources. Including the richest deposits of coal in the world, natural gas and petroleum. America, the Saudi Arabia of Coal!

An important point, not often discussed. Wherever there is coal, so is there oil and gas. In 2023, the U.S. produced more crude oil than any other country.(24) This in spite of excessive Federal regulations and an out of control EPA.

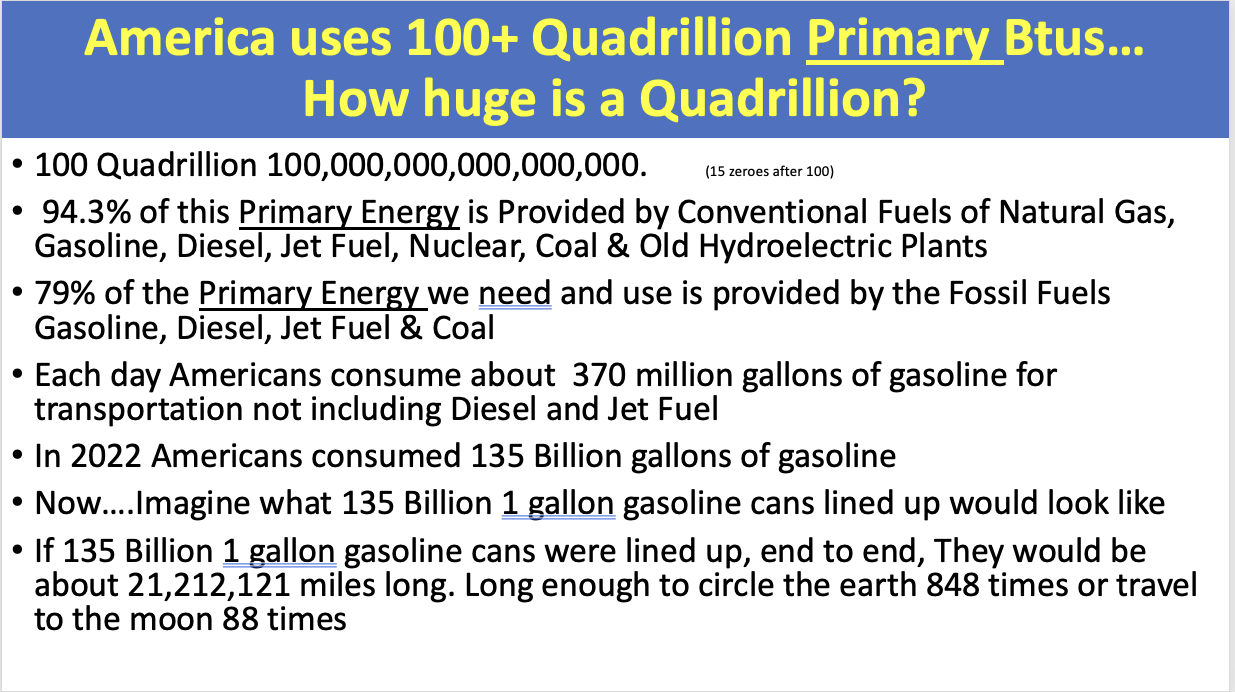
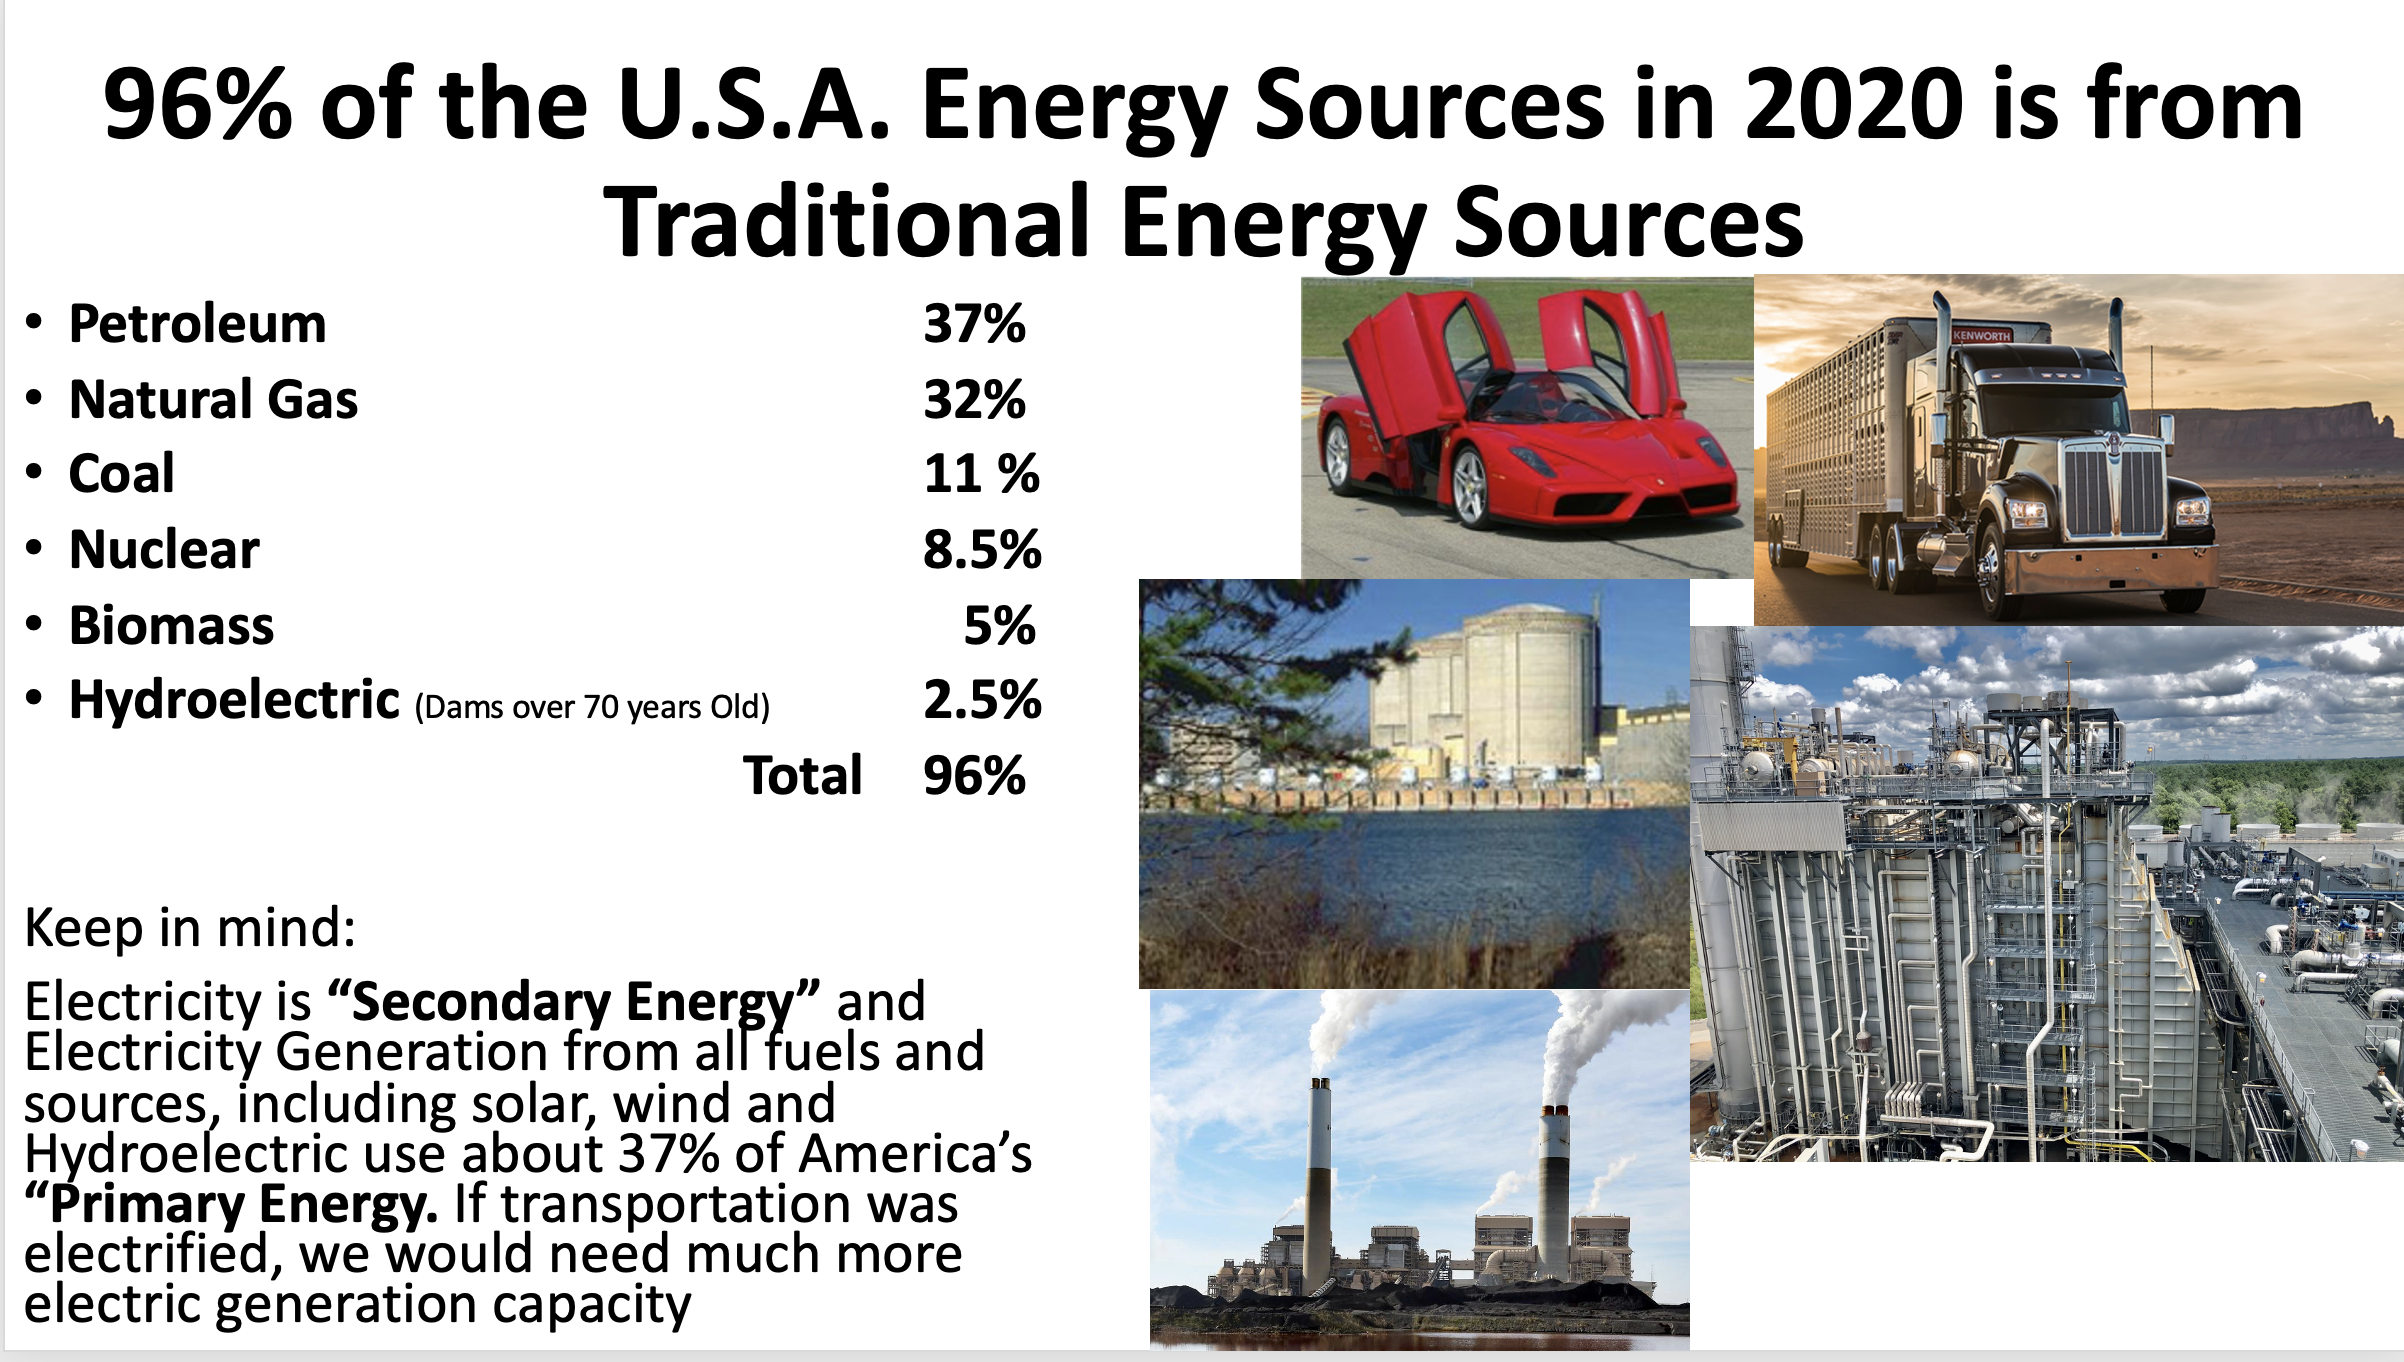
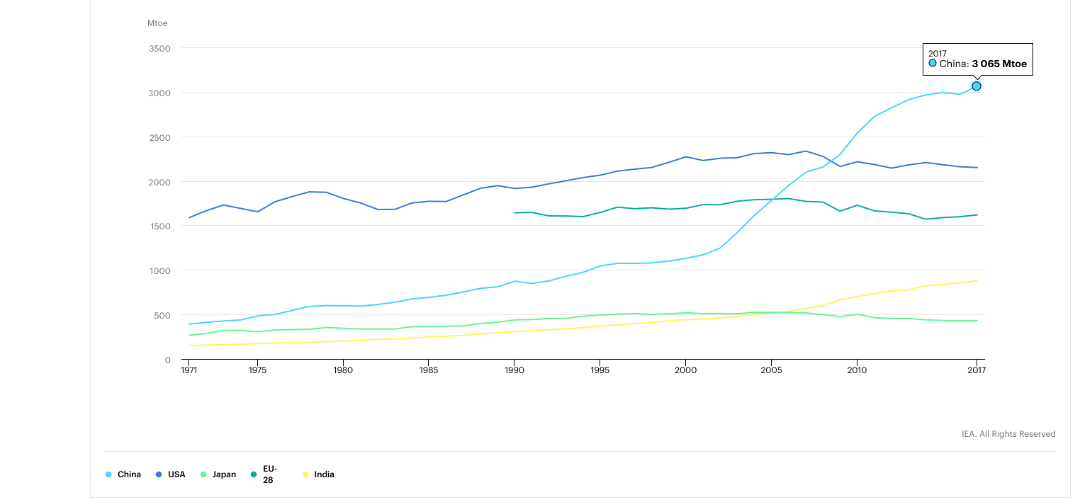
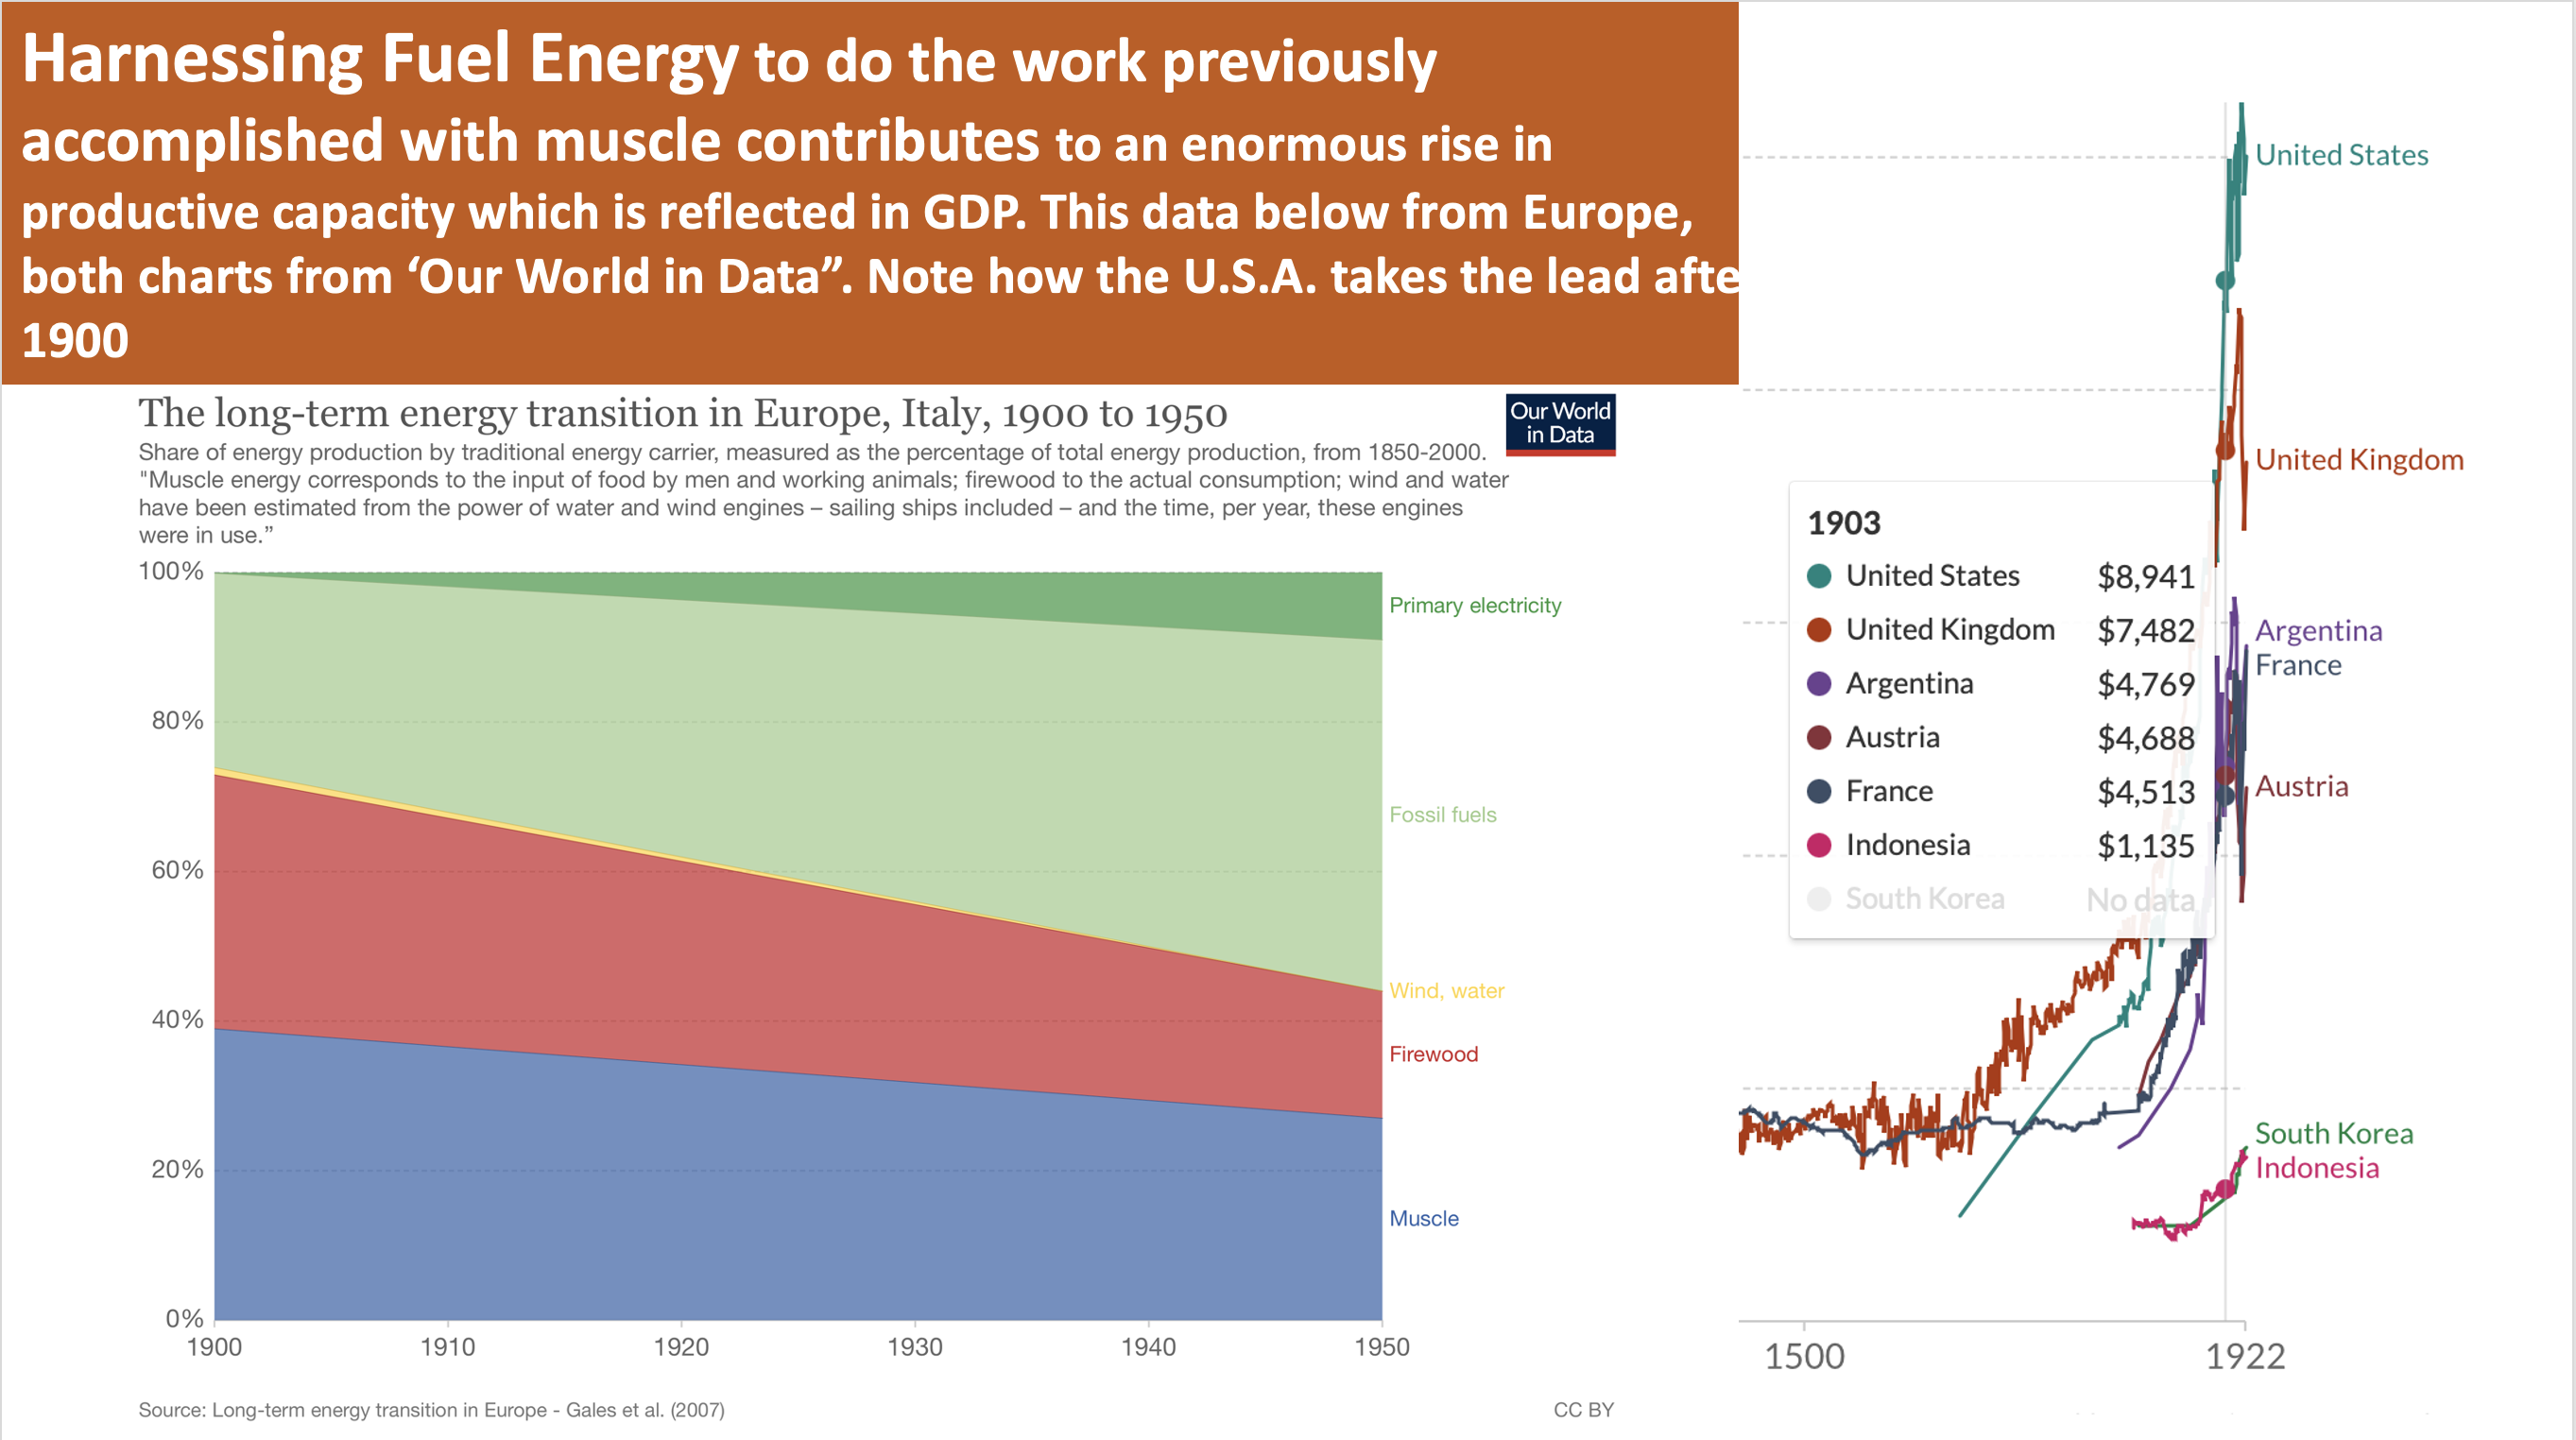
Reasonable cost and abundant energy was essential for America’s success, just as energy is essential for any other country’s success. America’s energy use is reported in British Thermal Units (BTU) and the U.S. uses about 100 Quadrillion BTUs each year. The Energy Institute and the International Energy Administration reports world energy use in Exajoules (EJ) and the world uses about 620 Exajoules per year. (0.947817 x 620 EJ= 587.6 Quadrillion BTU)

Why Horsepower?

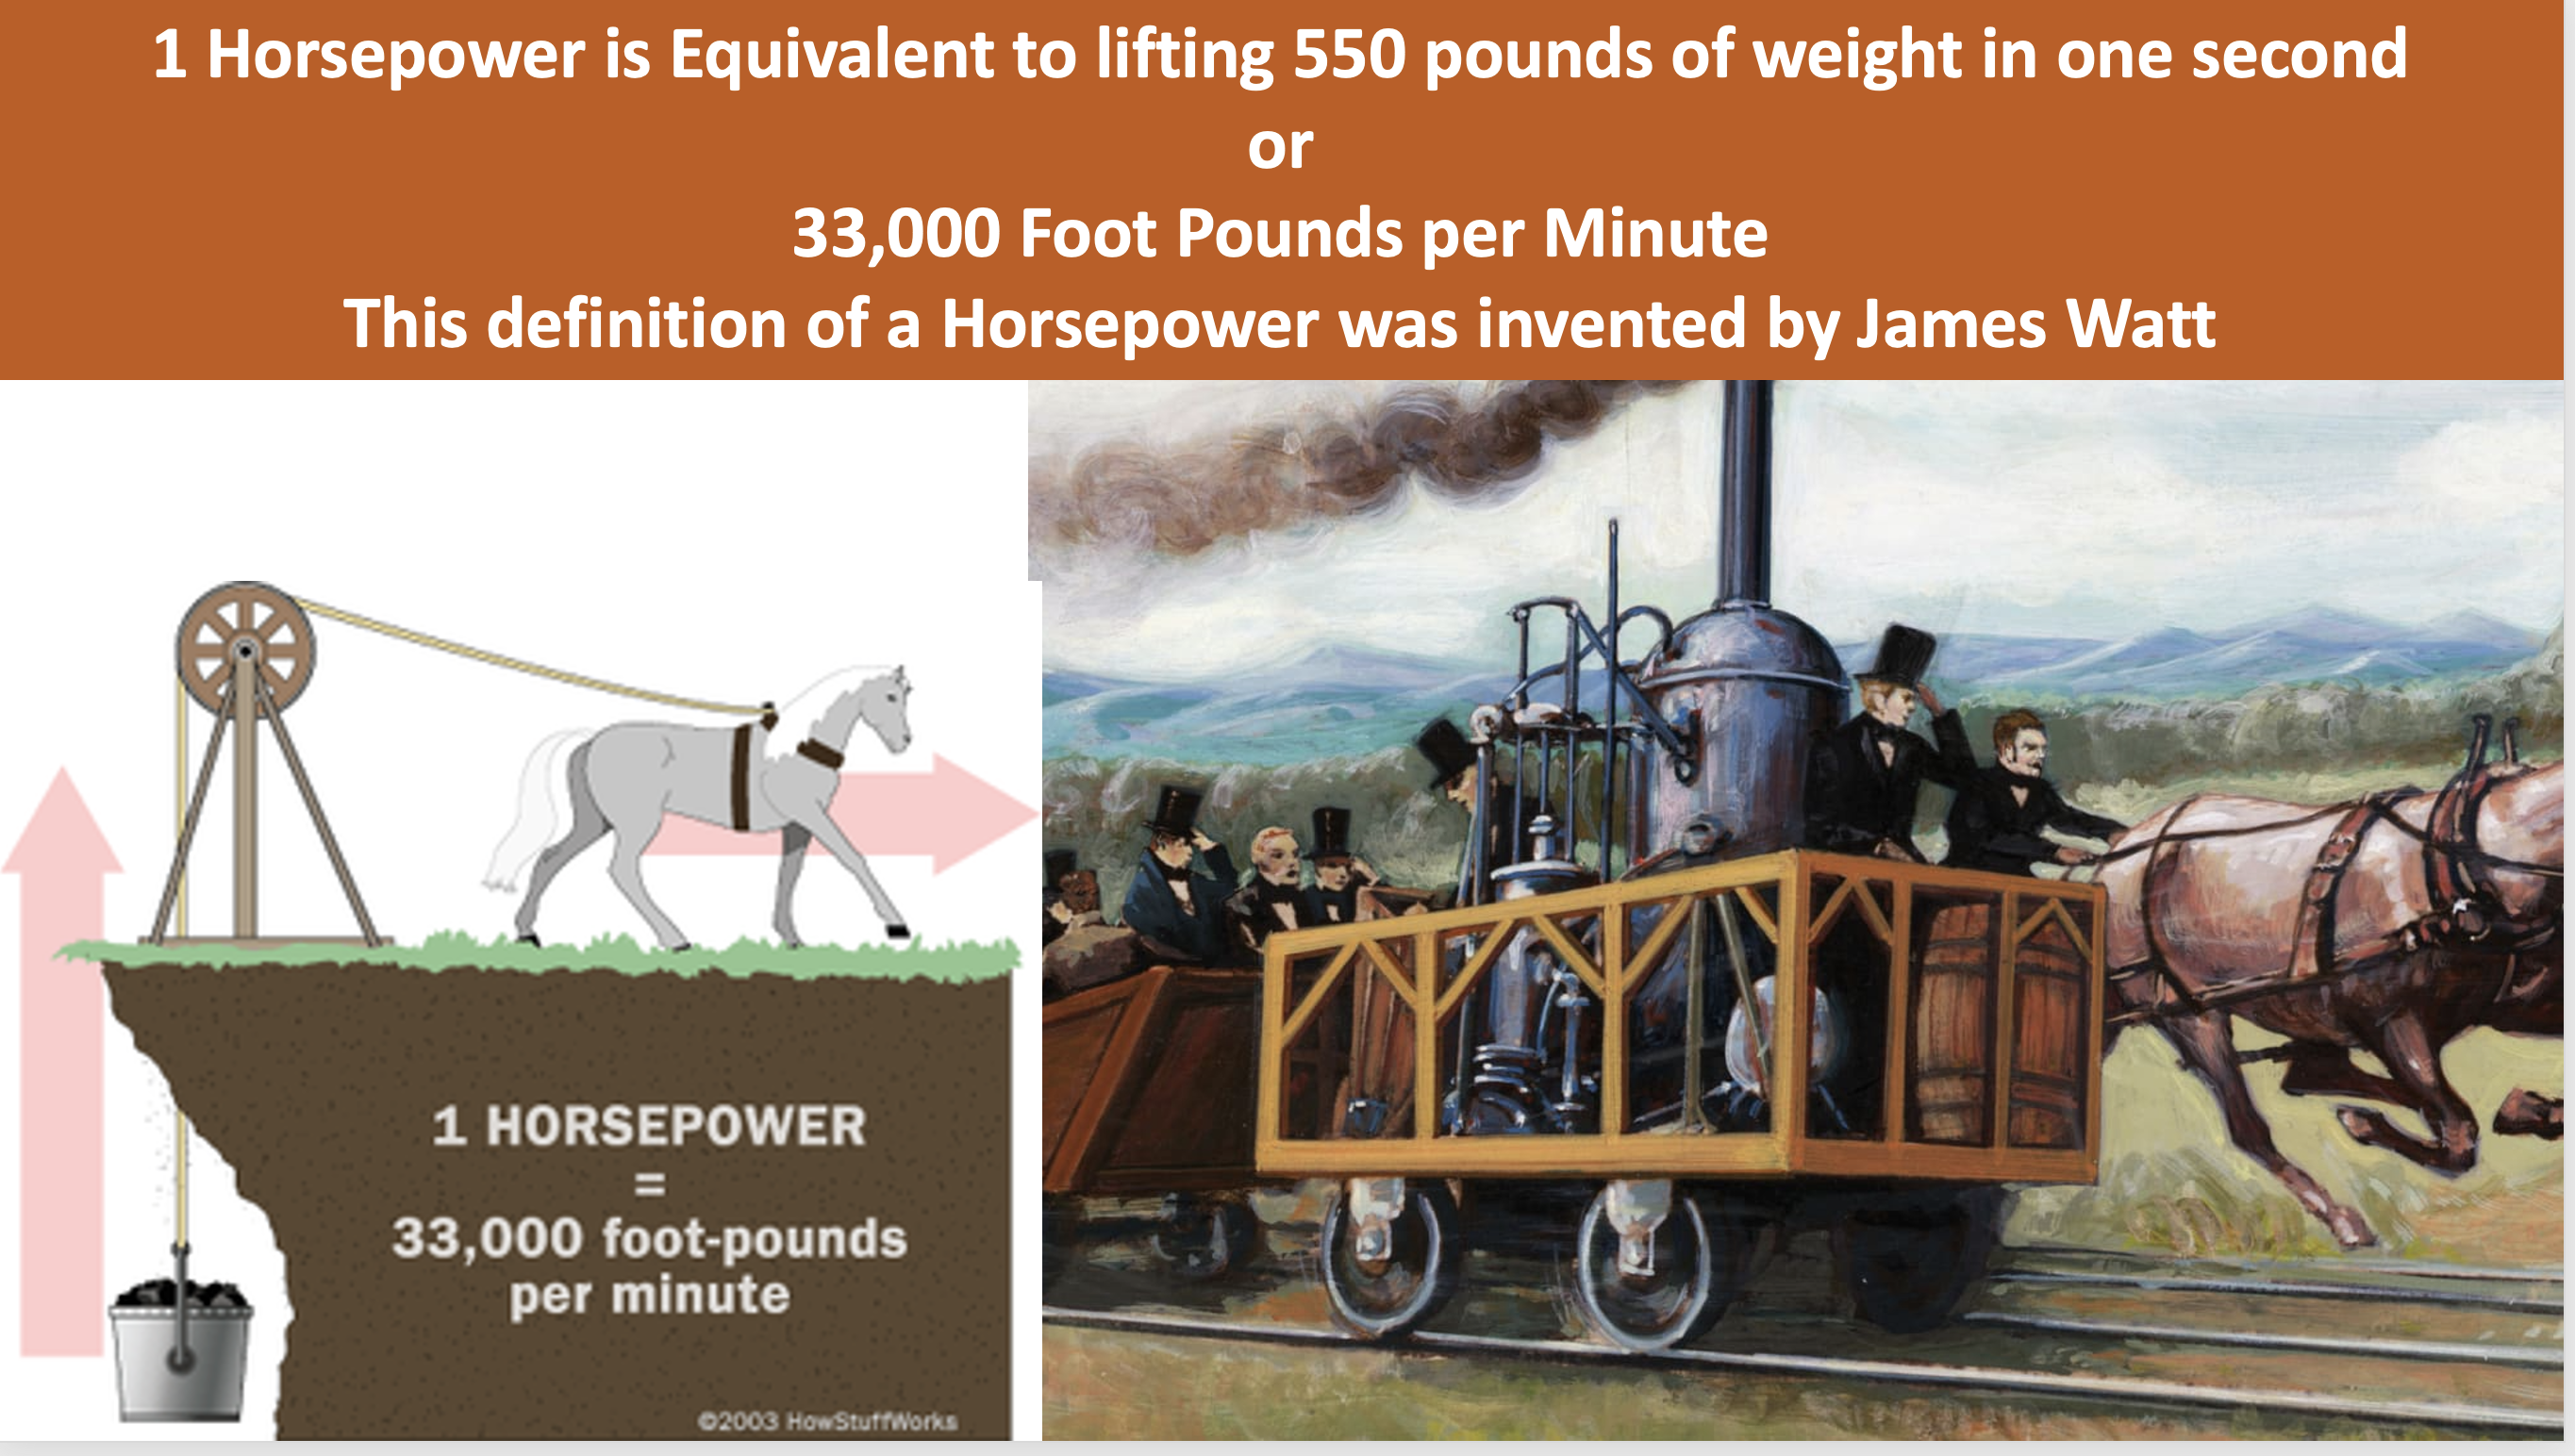
I have written on this before and had some feedback from readers and friends that “The general public doesn’t understand it when they are told they use about 850,000 BTUs of energy each day or the U.S. used 100 Quadrillion BTUs in a year”. Therefore, for this two part essay I thought I would express electricity energy in “Horsepower”. Rather than BTUs, kWH, Joules or Foot-Pounds, this article expresses energy production in Horsepower because, especially my family and friends, horsepower is a term most folks look at when buying a new car or truck, whether it is a 250 Hp Diesel fueled Ford F-150 or a 1020 Hp Tesla Model S. The fuel for each must first be provided by Primary Energy used to create either motive force or electricity.

Primary Energy

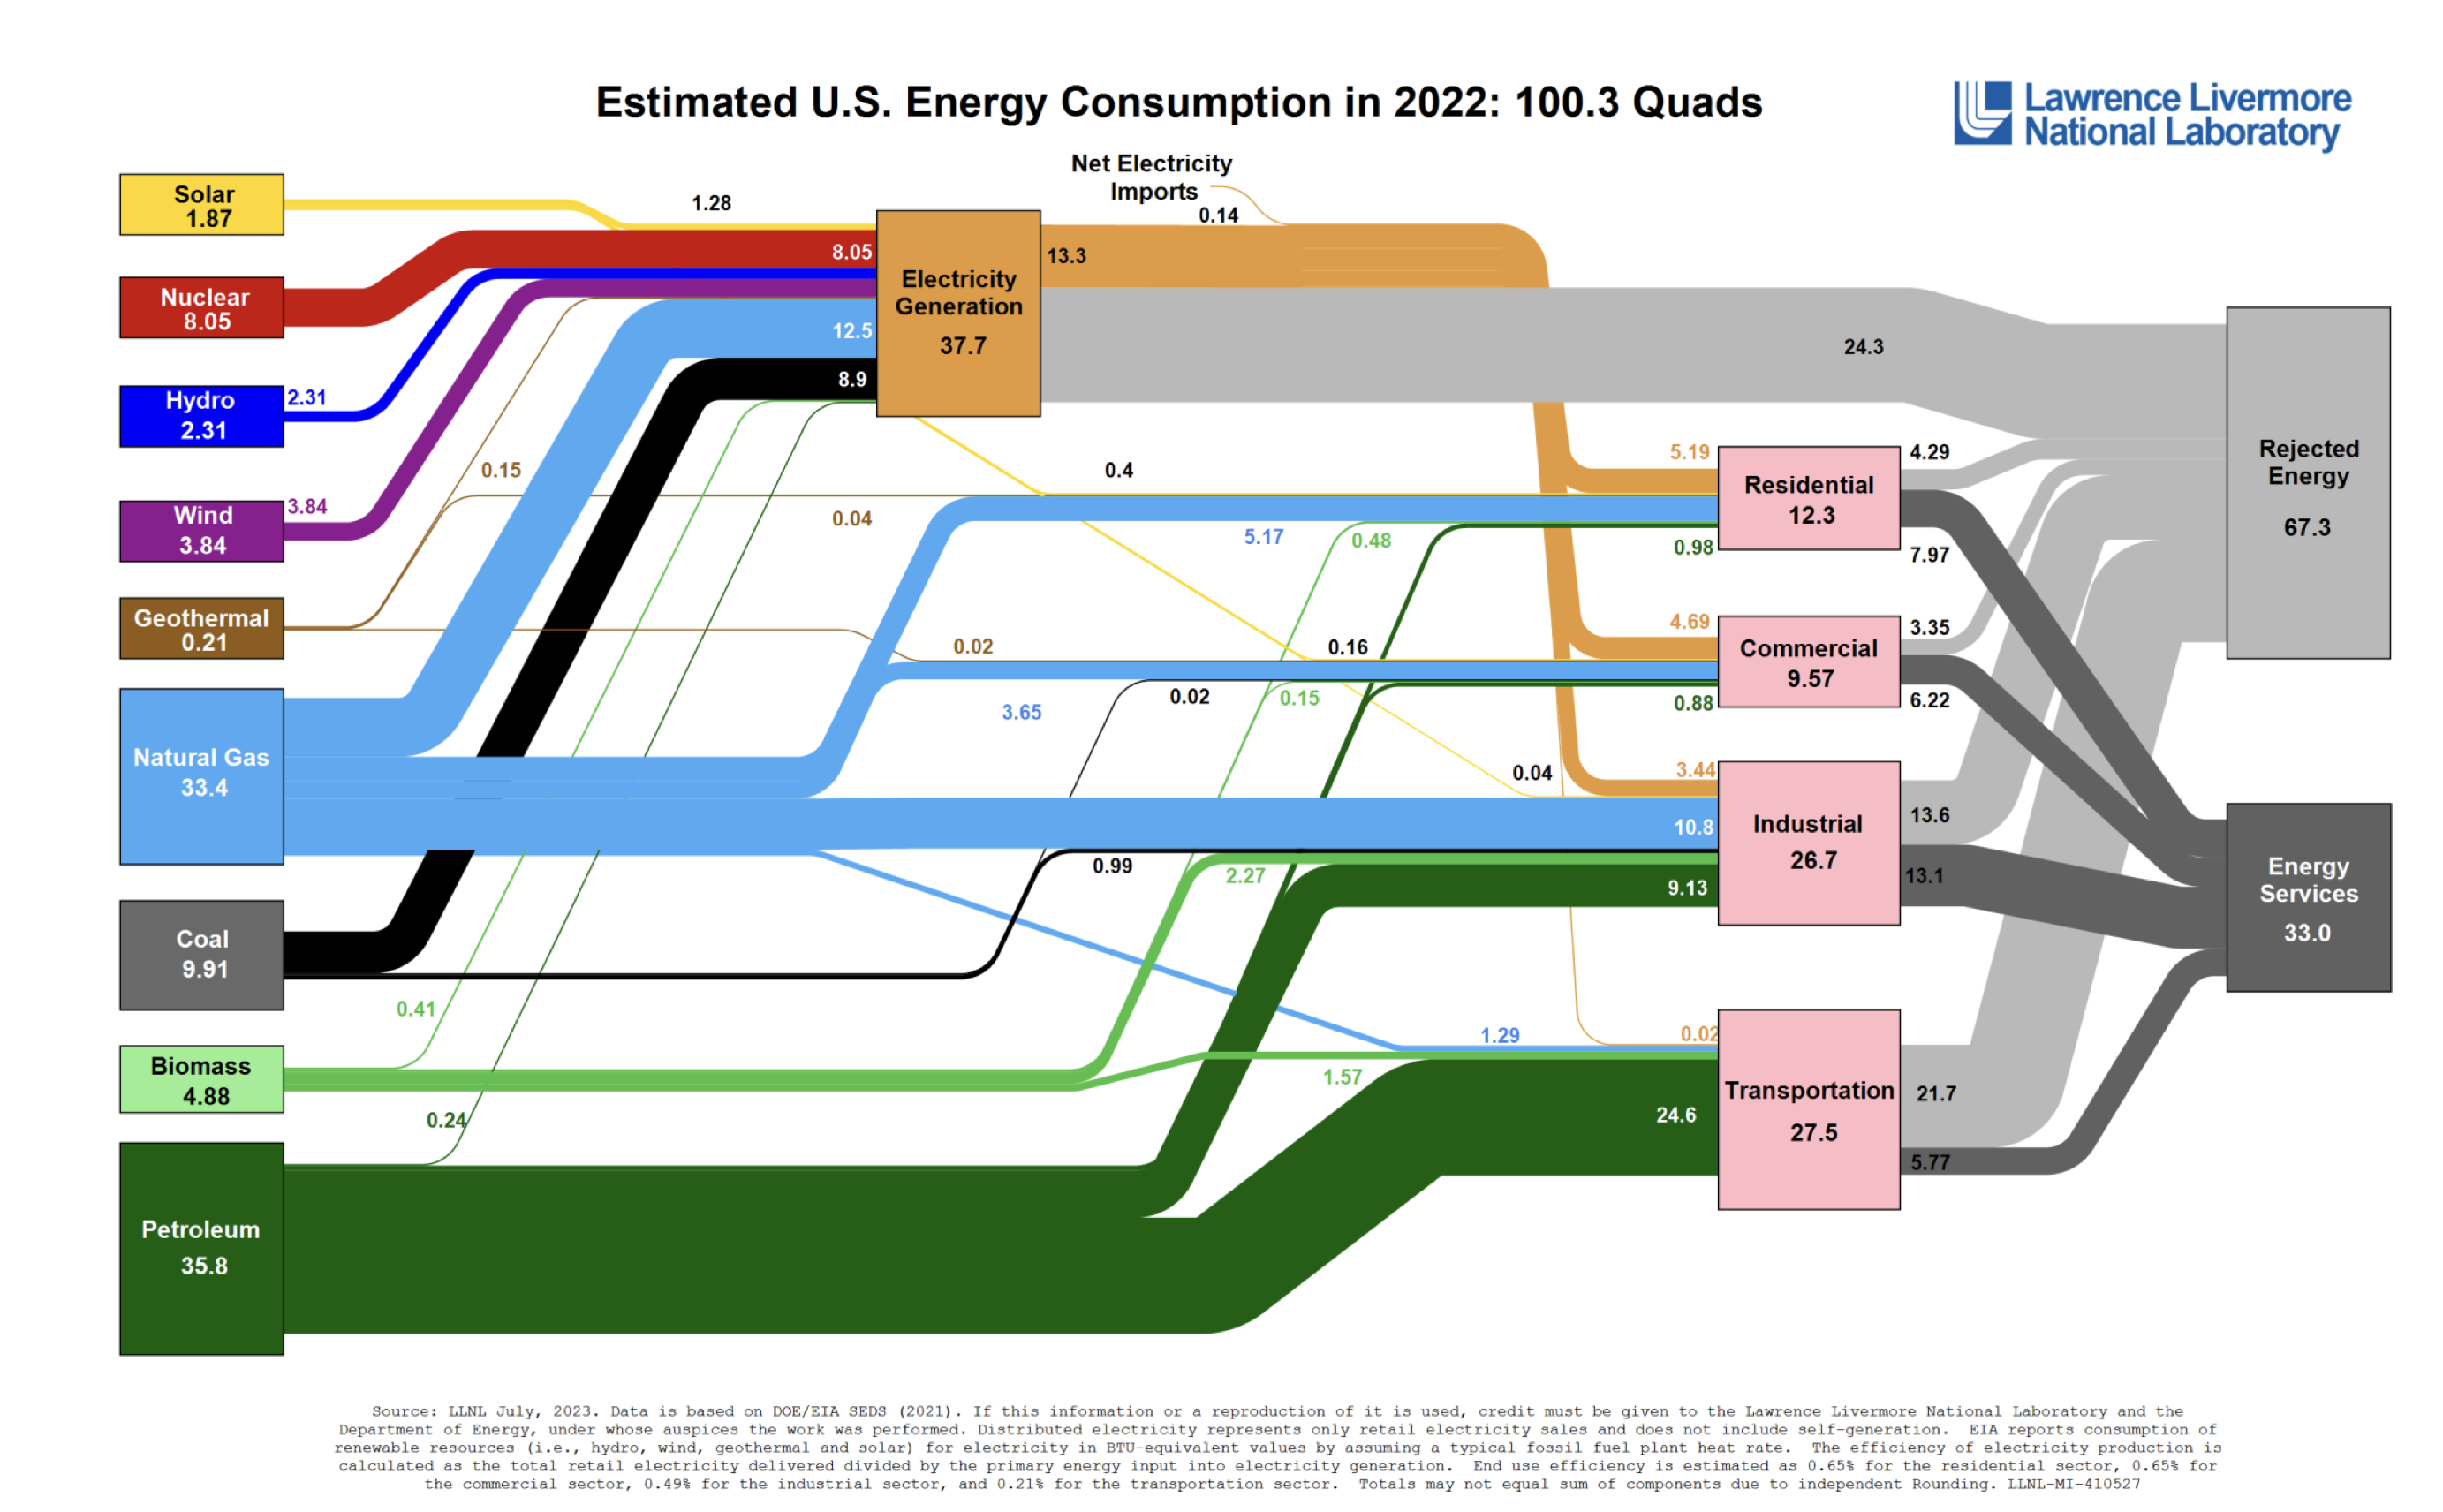
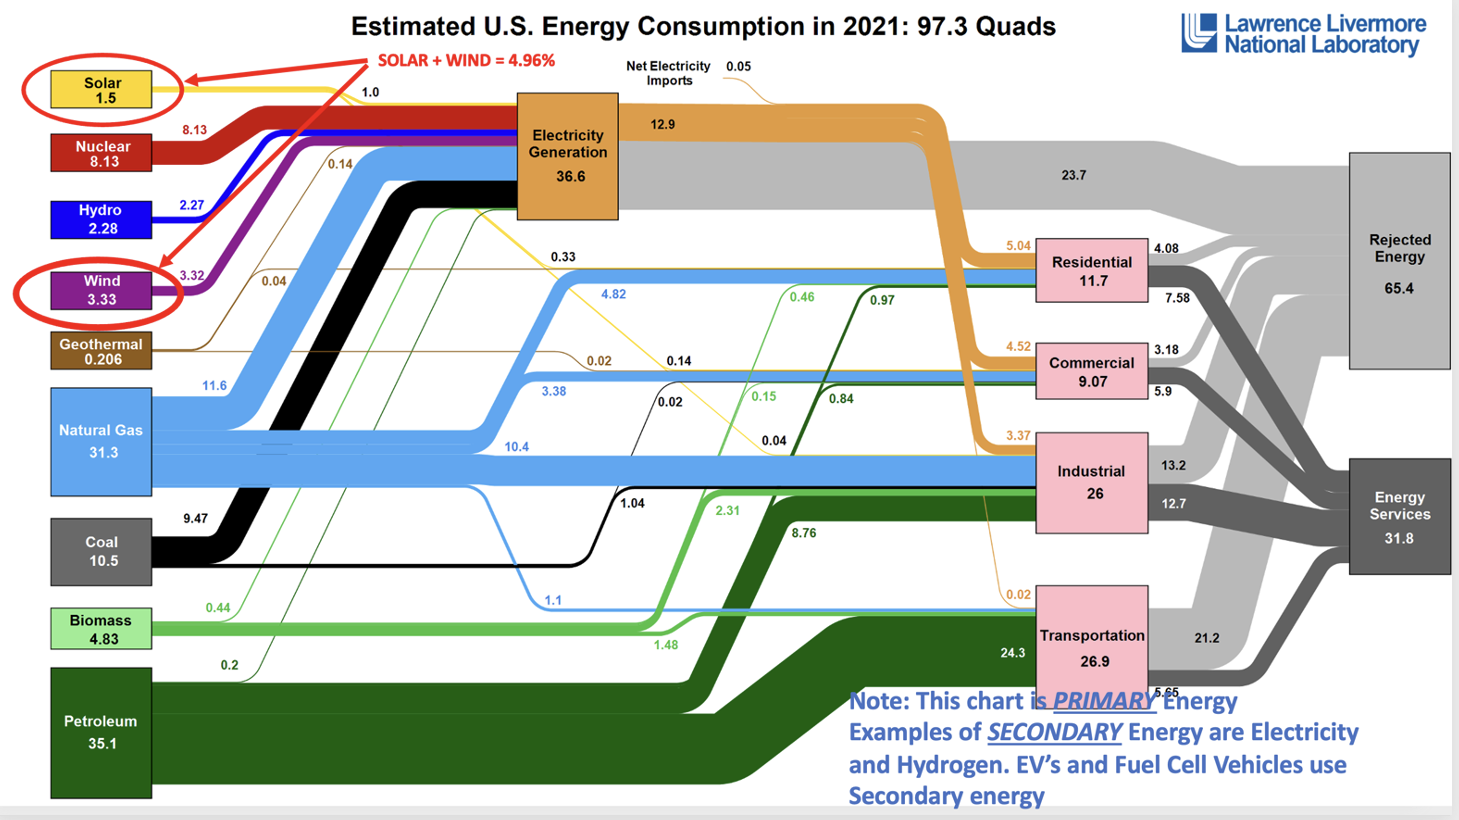
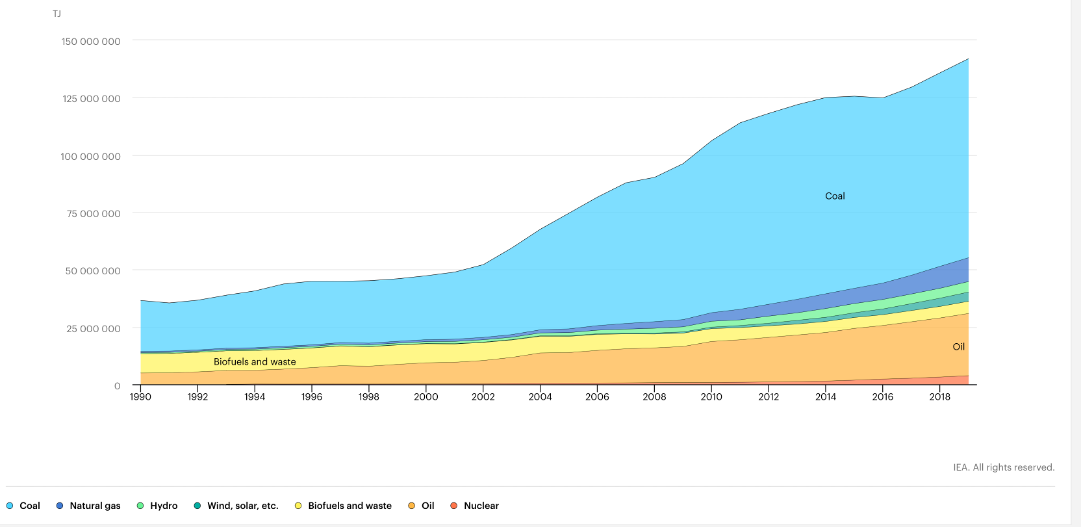
About 92% of the Primary energy used in America is used in Heat-Engines to power our high quality of life. About a third of the primary energy used in the U.S. is used to generate electricity. This article is intended to be a primer on the massive Heat-Engines that keep our Grid energized. Part 2 will include smaller heat-engines used for electric power generation and those used for transportation. It is my goal to keep the Thermodynamics simple so that non technically trained people can understand the importance of the 92% conventional Primary energy that we depend on. Past articles that I have written attempted to explain the differences of Primary Energy and Secondary Energy. Here, Here and Here. Primary energy flows in the U.S. for the year 2022 is shown on the LLNL chart here. The World use of Primary energy is shown by the Energy Institute here.

Common Large Heat-Engines

Definition of a Heat-Engine: A heat engine is a system that converts heat to usable energy, particularly mechanical energy, which can then be used to do mechanical work. Such as a Steam Turbine which converts the heat energy of steam into rotational force to spin a generator to produce electricity.

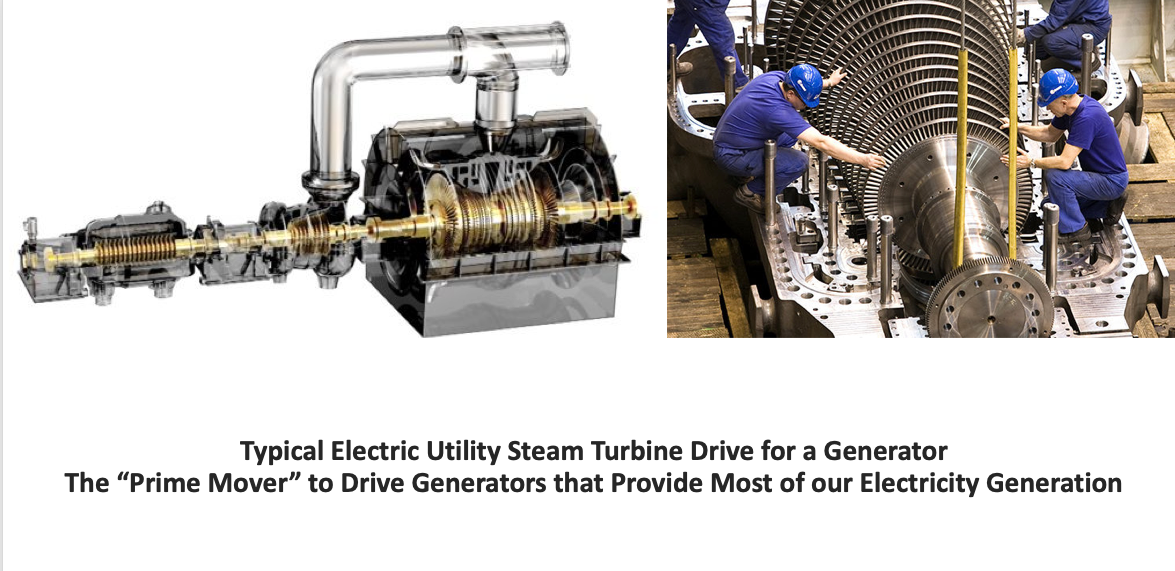
Also, a gas turbine or turbo-jet engine that uses heat energy to create rotational force to a shaft. A portion of the heat energy is exhausted as waste. The difference of the heat content of the steam or hot gas at the inlet and at the exhaust is the net work that has been extracted for useful purposes. In this article steam and gas turbines will be discussed. In a power plant the steam turbine or gas turbine is sometimes referred to as the Prime Mover. A previous article touches on Heat-Engines. The illustration below is a graphical description of the conversion of coal fuel to provide heat used to generate steam. The steam is then used to spin a turbine providing the motive force creating shaft horsepower to spin a generator and ultimately generating electric power. The heat source to produce steam can be coal, nuclear, natural gas, oil, biomass or municipal waste. The basic steam cycle remains the same, referred to in our industry as the “Rankine Steam Cycle”.

From Storm Technologies Large Electric Utility Boiler Combustion & Performance Optimization Course

Thermal Power is important for everything we do!

One pre-requisite to understanding Heat-Engines, is to understand the difference between Primary Energy and Secondary Energy. Covered in previous articles, here, here and here.

Types of Heat-Engines

Let’s start with one of the largest first. Here is a photo of the Zimmer Coal Plant. This plant shut down in 2022 but when started up in 1991 it was amongst the largest single unit power plants in the world with 1351 MW capacity, Dispatchable 24/7, rain or shine, summer or winter. This plant was one of my favorites and in my opinion, it is an example of one of the most magnificent heat engines ever built.

Zimmer Steam Turbine Generator 1993 from Wikipedia: https://en.wikipedia.org/wiki/William_H._Zimmer_Power_Station

The photo above is just part of the power plant, showing the Low Pressure Turbine and generator. There is also a High Pressure turbine and separate generator. The entire Zimmer “Heat-Engine” comprises the entire power plant shown below in an aerial photo. Although I have been in the power generation business for over 50 years, it still amazes me that so much of the equipment involved in the total electrical energy production starting with a coal conveyer moving 500 tons per hour of coal can be pulverized and burned, produce steam to the turbines and generate electricity to the Grid (the equivalent of 1.8 million Hp) through three skinny high voltage wires that are smaller than 2″ in diameter and 1.8 million horsepower of energy.

Photo from Cincinnati Newspaper about 1994

The Zimmer Coal Plant when operating at full capacity of 1350 MW’s is equivalent to about 1,800,000 Horsepower. To generate this much power about one million pounds of 11,000 BTU/# coal would be pulverized and burned in suspension in the furnace each hour. That is one reason why I refer to this power plant as a Magnificent Heat Engine. The million pounds per hour (Imagine five 100 ton coal cars/hour) of coal is converted into electricity that flows through three high voltage conductors to the transmission lines feeding the Grid. The water flow to the steam generator is equivalent to about 20,000 gallons per minute. An Olympic swimming pool holds about 600,000 gallons. At maximum capacity the Zimmer steam generator will evaporate the equivalent of two Olympic swimming pools full of water each hour and heat that water to steam at over 3,845 pounds per square inch and 1,000 degrees F. The single turbine driven boiler feed water pump is powered by a 50 MW (67,000 Hp) steam turbine which is about as powerful as all the power consumed on a hot summer day in my old town (about 20,000 people) in Albemarle, NC. Fifty Megawatts is the power to drive just the feed water pump.

These are a few reasons why I consider Zimmer to be a magnificent Heat Engine. An excerpt from the POWER Magazine 1993 feature article is copied below.

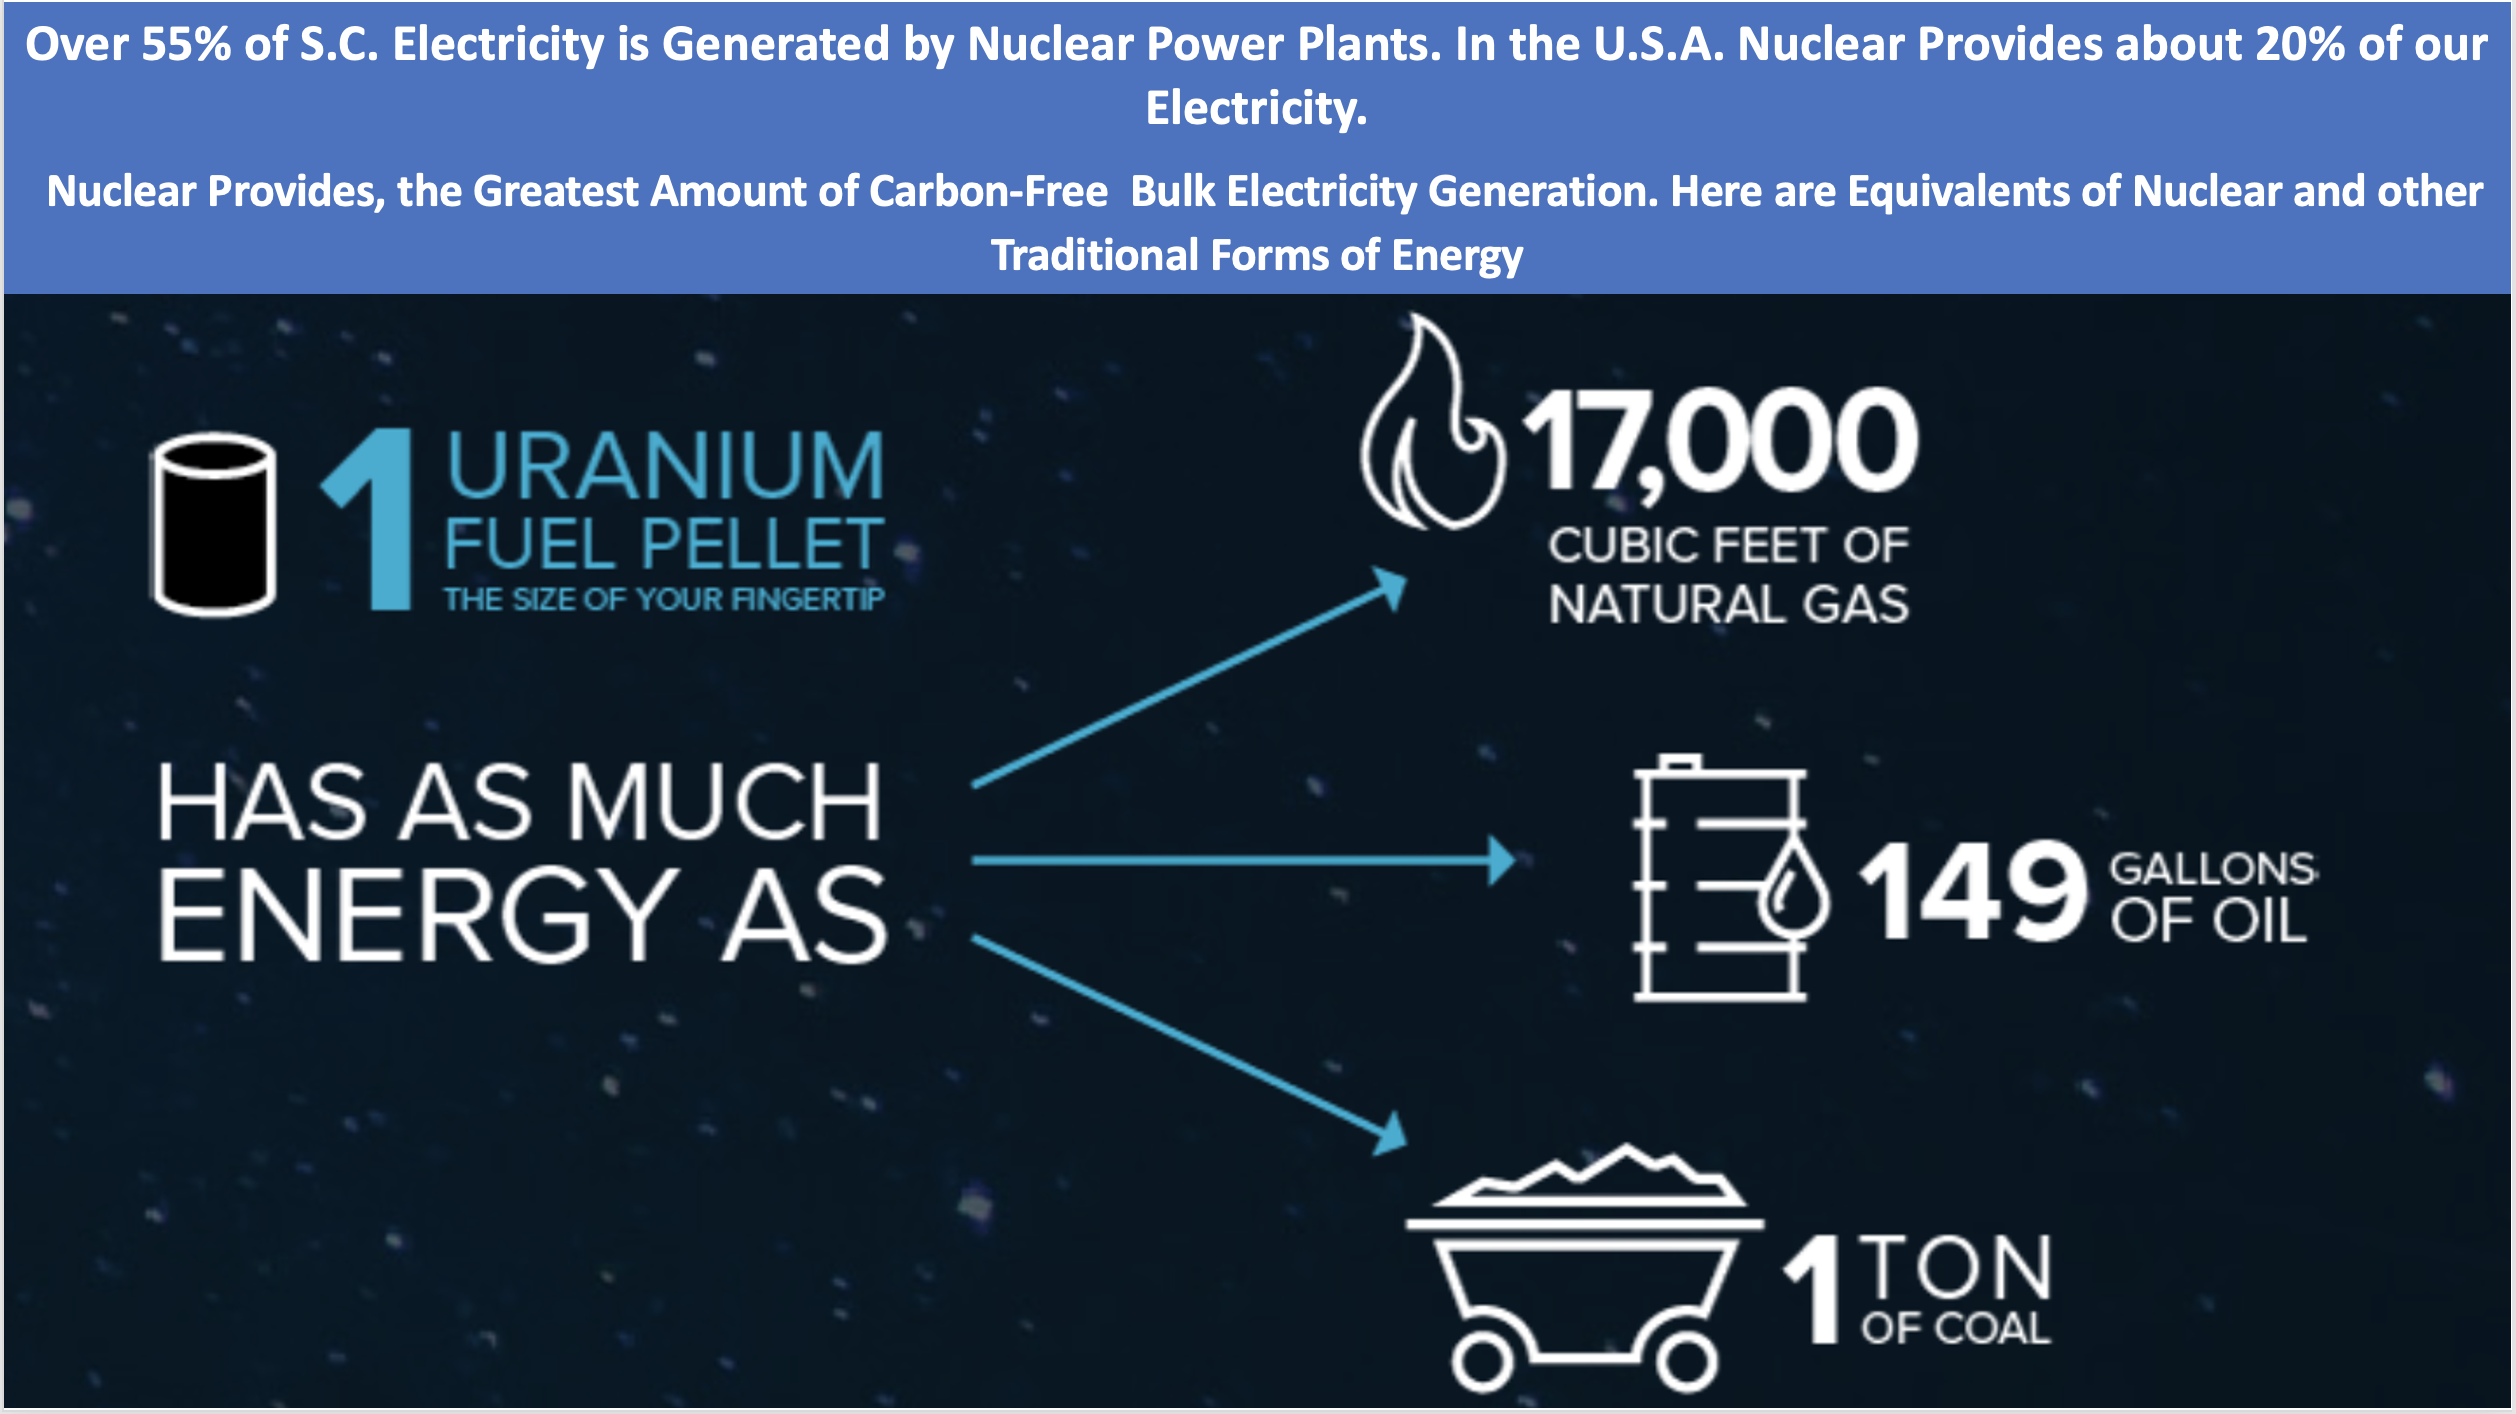
Nuclear Power Generation

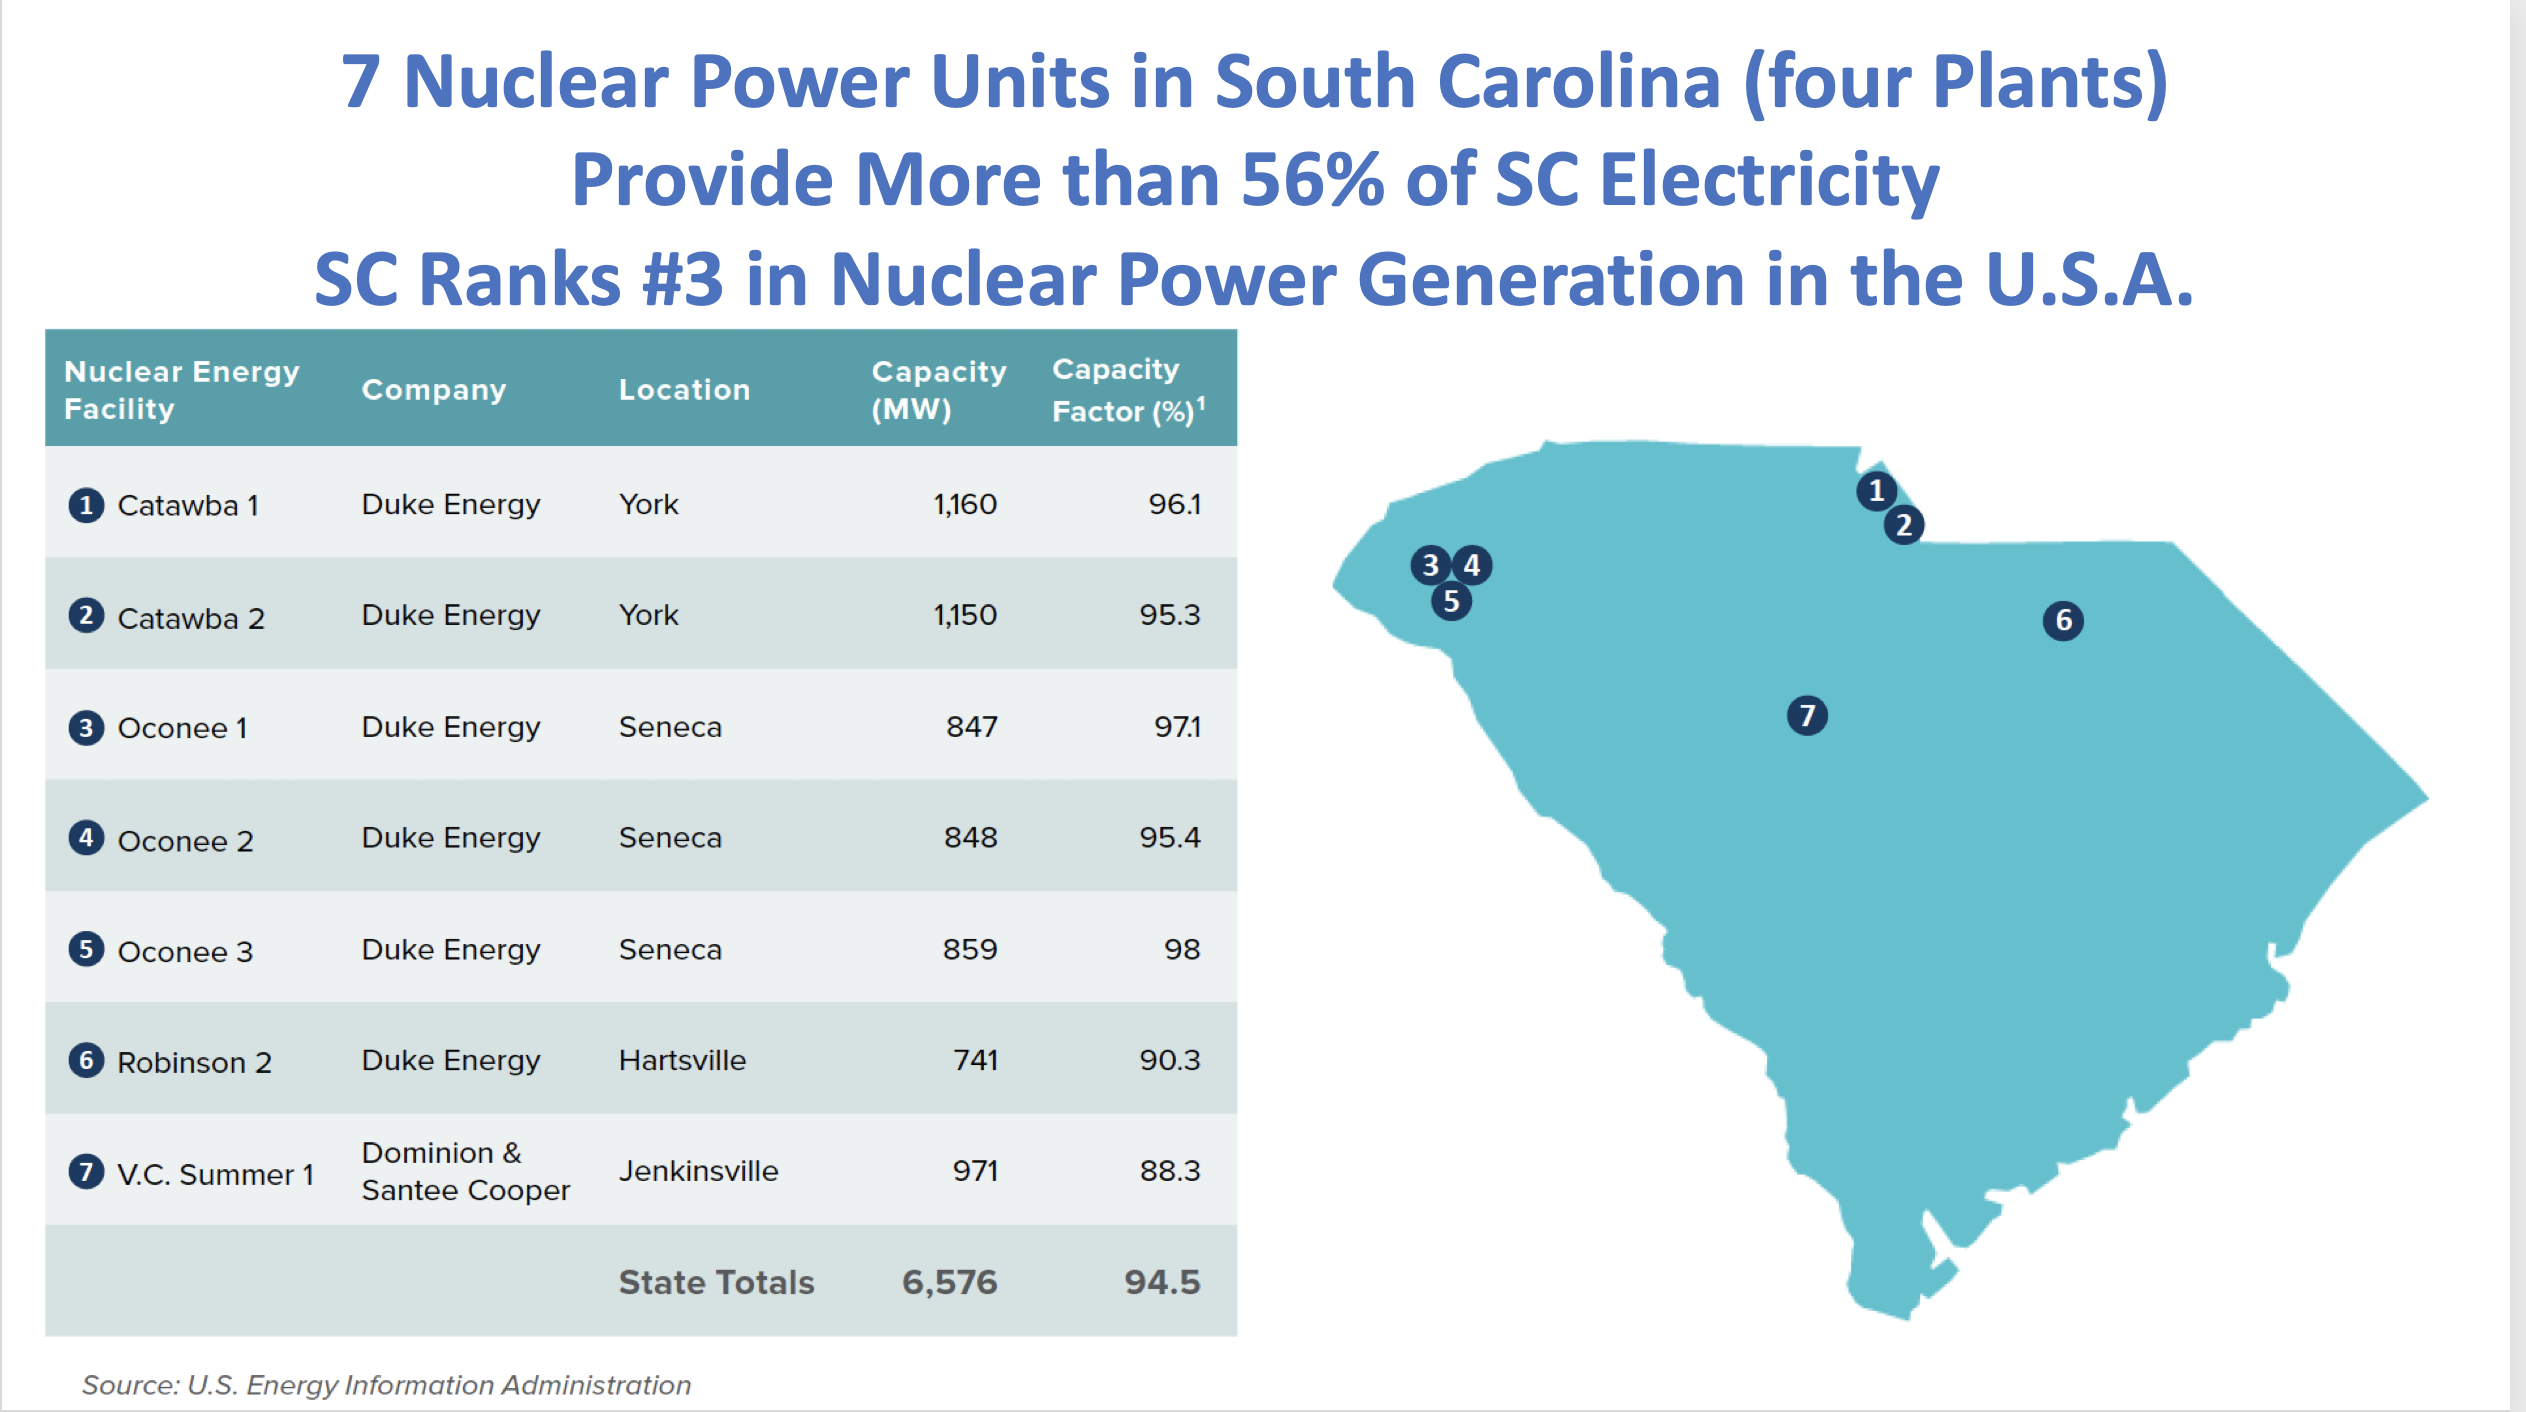
The Oconee Nuclear Plant is another example of Thermal power generation. Allow me to also call this a heat engine. Three units with a total capacity of 2,554 MW. The illustration below is from the Duke Energy Fact Sheet.

https://www.duke-energy.com/-/media/pdfs/energy-education/oconee-nuclear-station-fact-sheet.pdf?rev=8dd993b38d0a4e2fbbd0bc0d5db8e56b

This three unit nuclear powered “Heat-Engine” is about twice as large in total output as the Zimmer Coal Plant discussed above. Expressed as Horsepower, the three units together represent the equivalent of over 3.3 million horsepower.

Both the Zimmer and Oconee plants utilize the Rankine Steam Cycle.

Natural Gas Turbines

Modern gas turbines used for power generation are referred to as “Aeroderivative” Why? Because the gas turbine technology used is derived from jet engine designs. I wrote on the history of power generation in a previous article here. Two engineers, one German and one British are credited with the invention of the jet engine which came to be in the mid 1930’s. The first gas turbine application to power generation is generally thought to be by General Electric at the Belle Isle Station in Oklahoma, about 1949. The simple Gas Turbine single cycle is called the “Brayton Cycle”. An illustration of a modern Gas Turbine is shown below.

The generator is not shown in the above illustration but it will be similar to the generator shown above at the Zimmer coal plant. The point is that heat energy is used in each example thus far. For Zimmer coal is used to generate steam supply to power steam turbines as prime movers. Oconee uses nuclear fission to provide the heat to generate steam for the steam turbines there. Both use the Rankine steam cycle. The gas turbine shown above utilizes the Brayton cycle to create hot gases that flow through the gas turbine as the prime mover for the generator shaft.

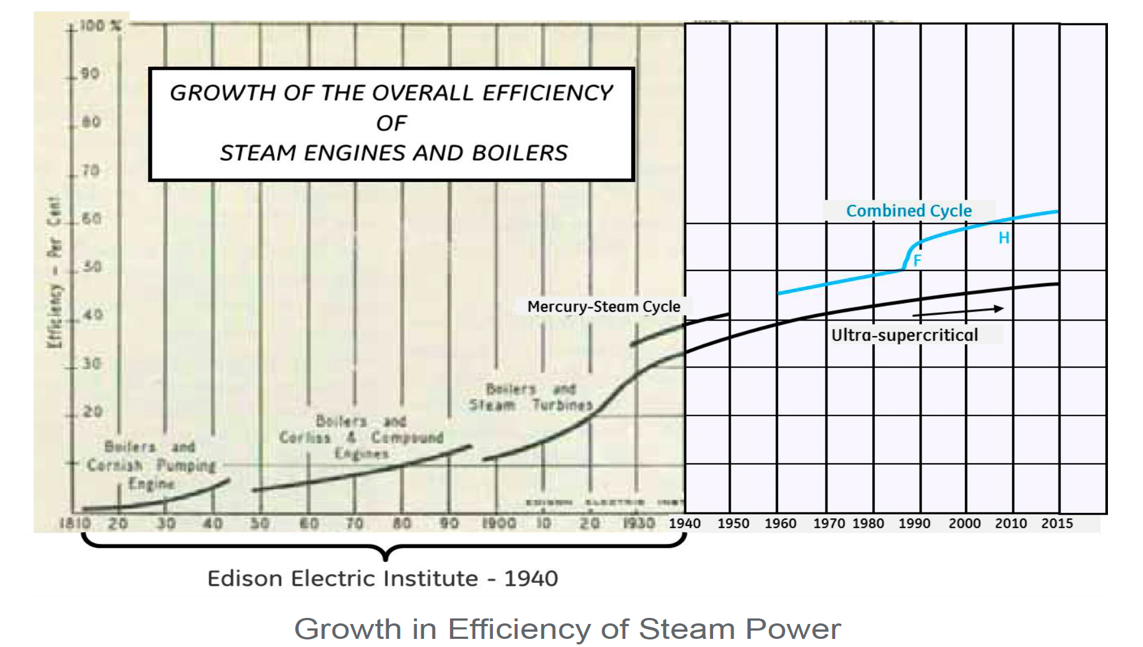
Gas Turbine Combined Cycle Plants (GTCC)

One of the major advancements in the last twenty years or so has been the commercial application of gas turbines and steam turbine cycles working together. That is using both gas turbines with a shaft connected to a generator and then exhaust heat recovery of the gas turbine in a boiler to generate steam to provide a steam supply to a steam turbine which is the prime mover of a second generator.

By combining the gas turbine and steam turbine cycles, a much greater overall efficiency can be achieved. Modern GTCC plants achieve up to 65% thermal efficiency.

The plant below is 697 MW capacity. Fueled by natural gas.

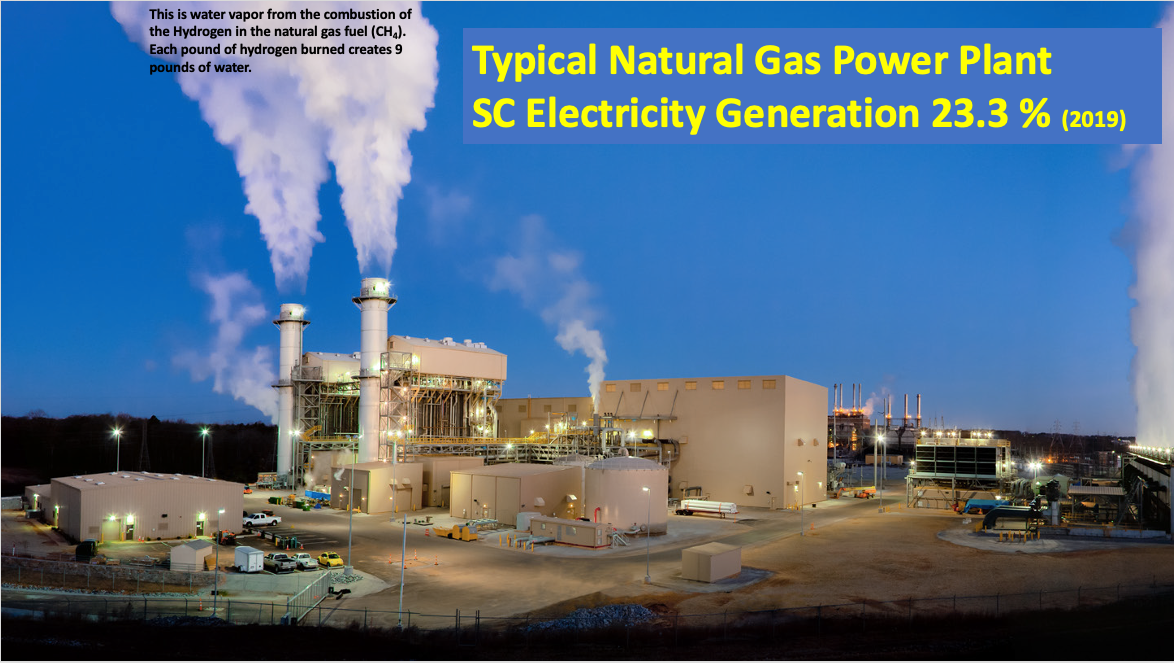
The GTCC plant electrical output of 697 MW is equivalent to 927,000 Horsepower.

Summary

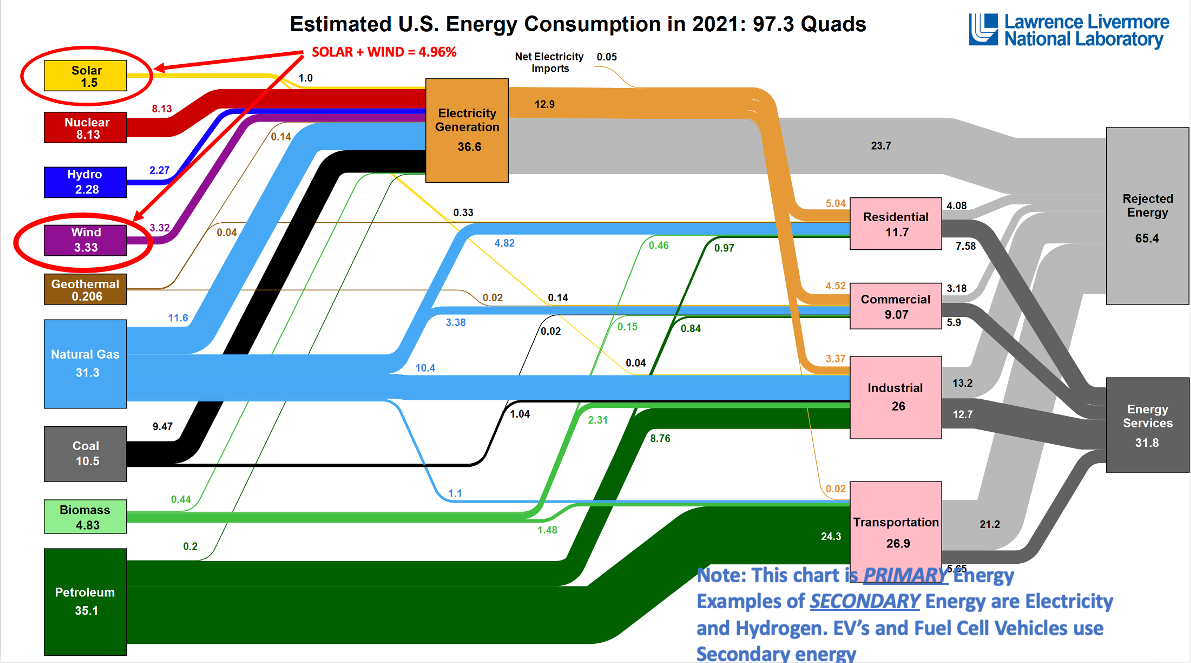
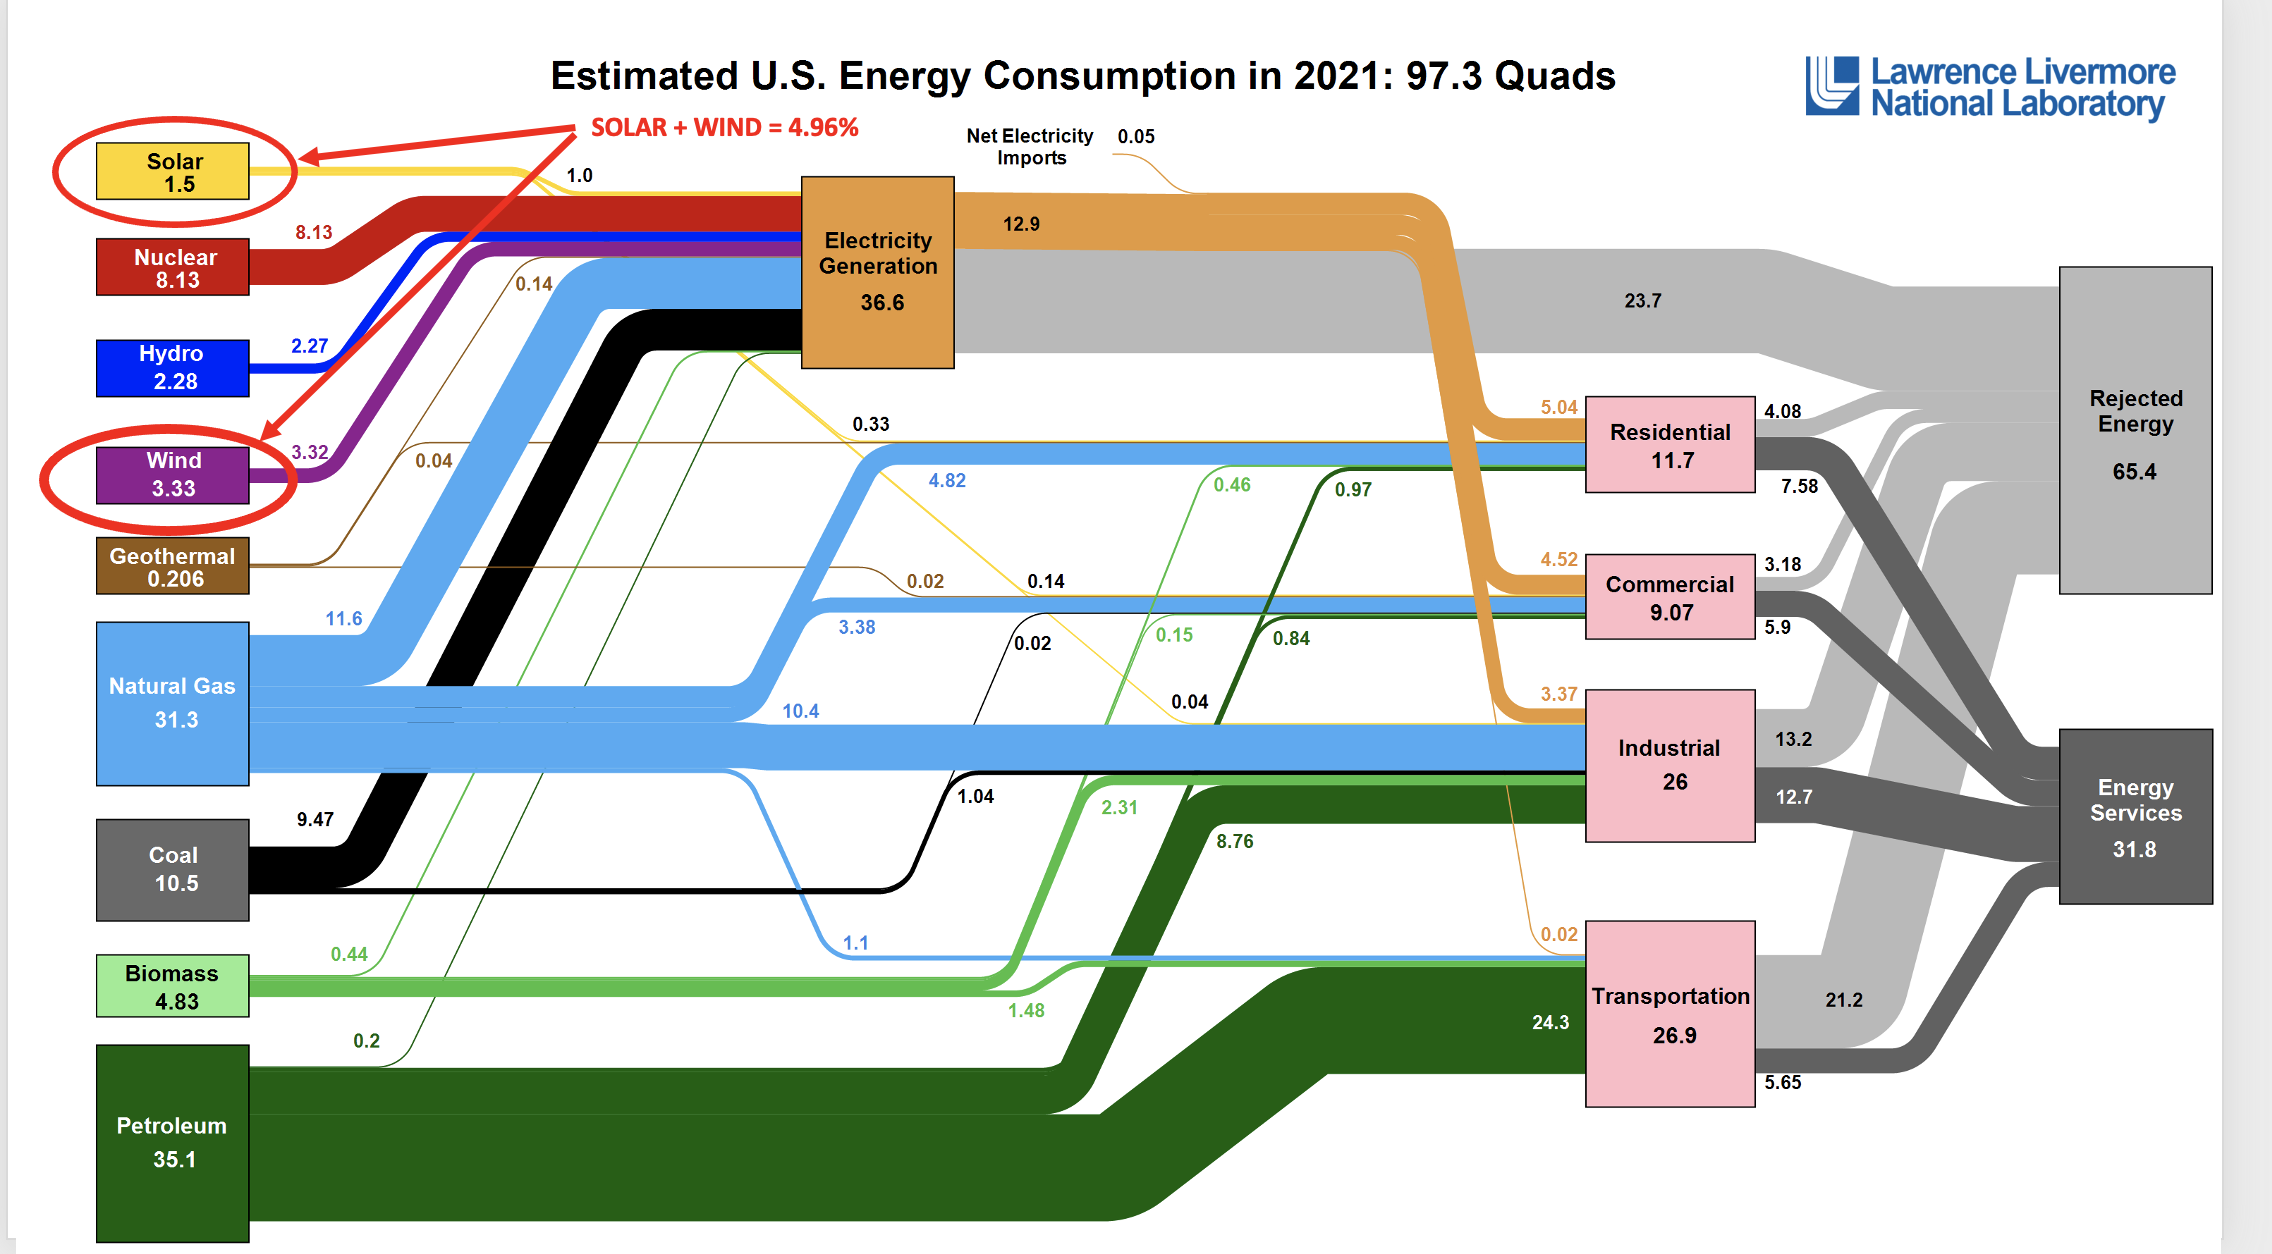
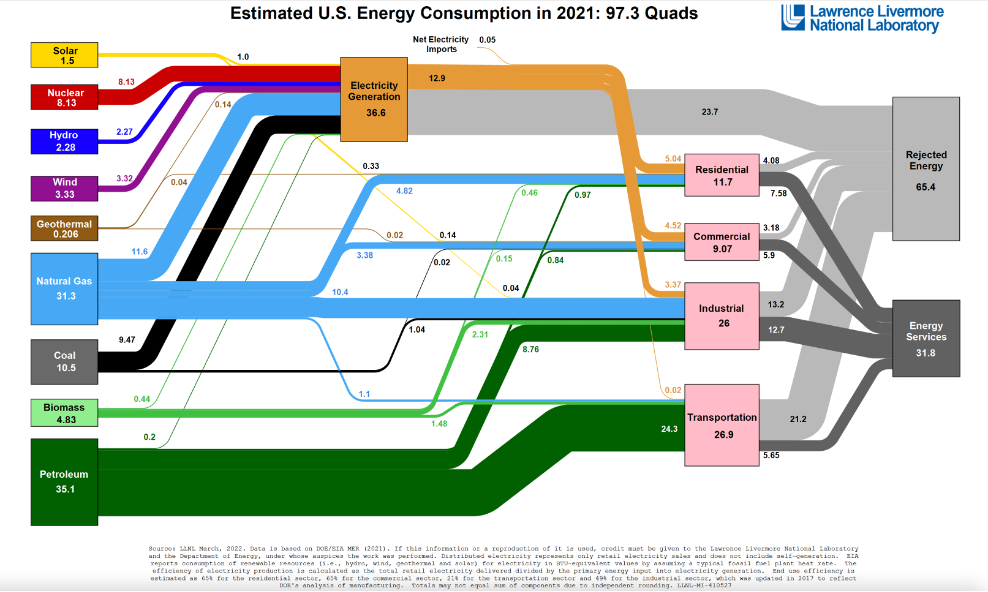
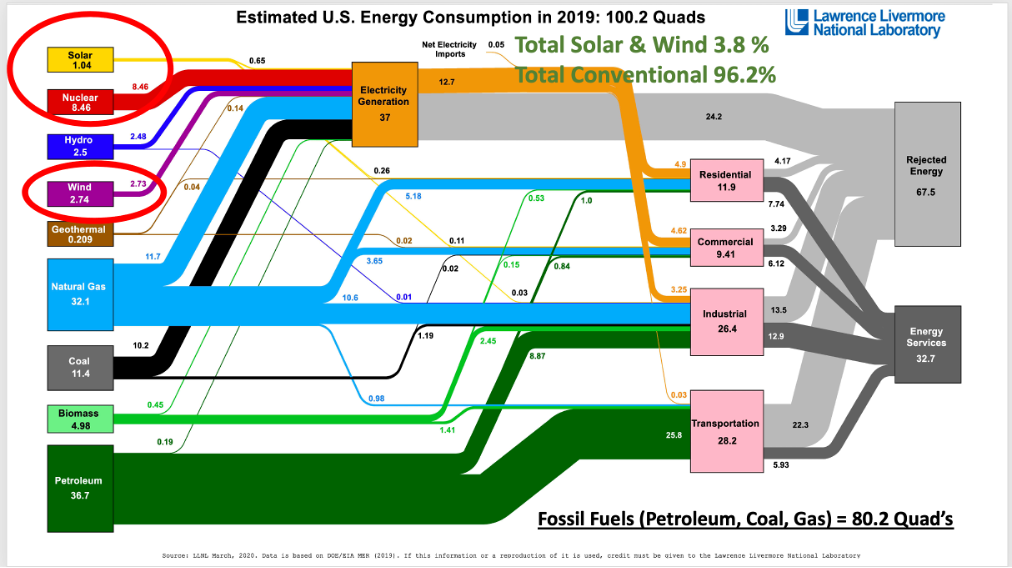
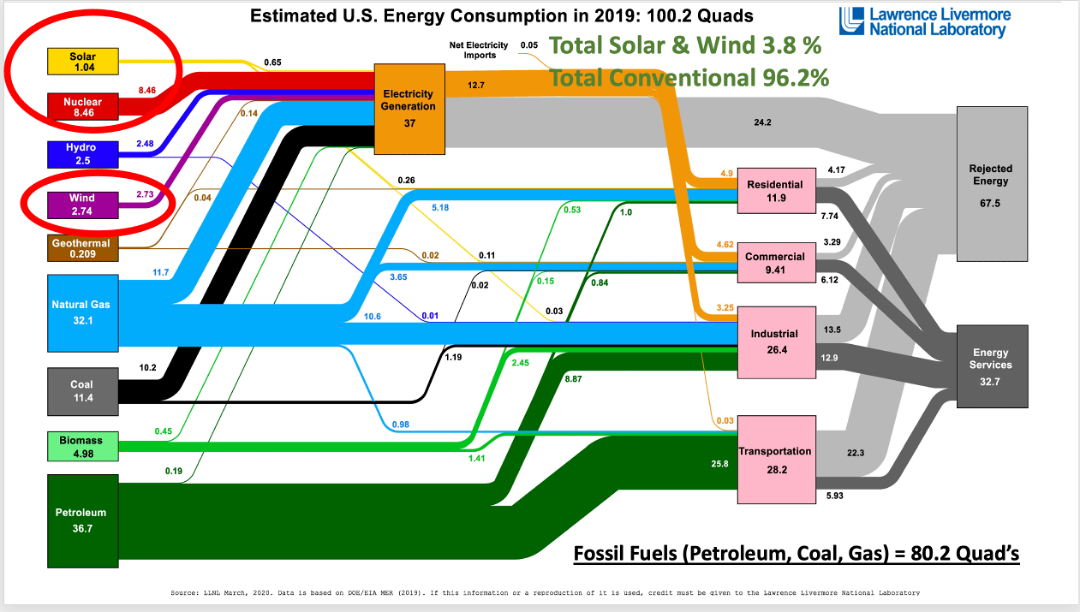
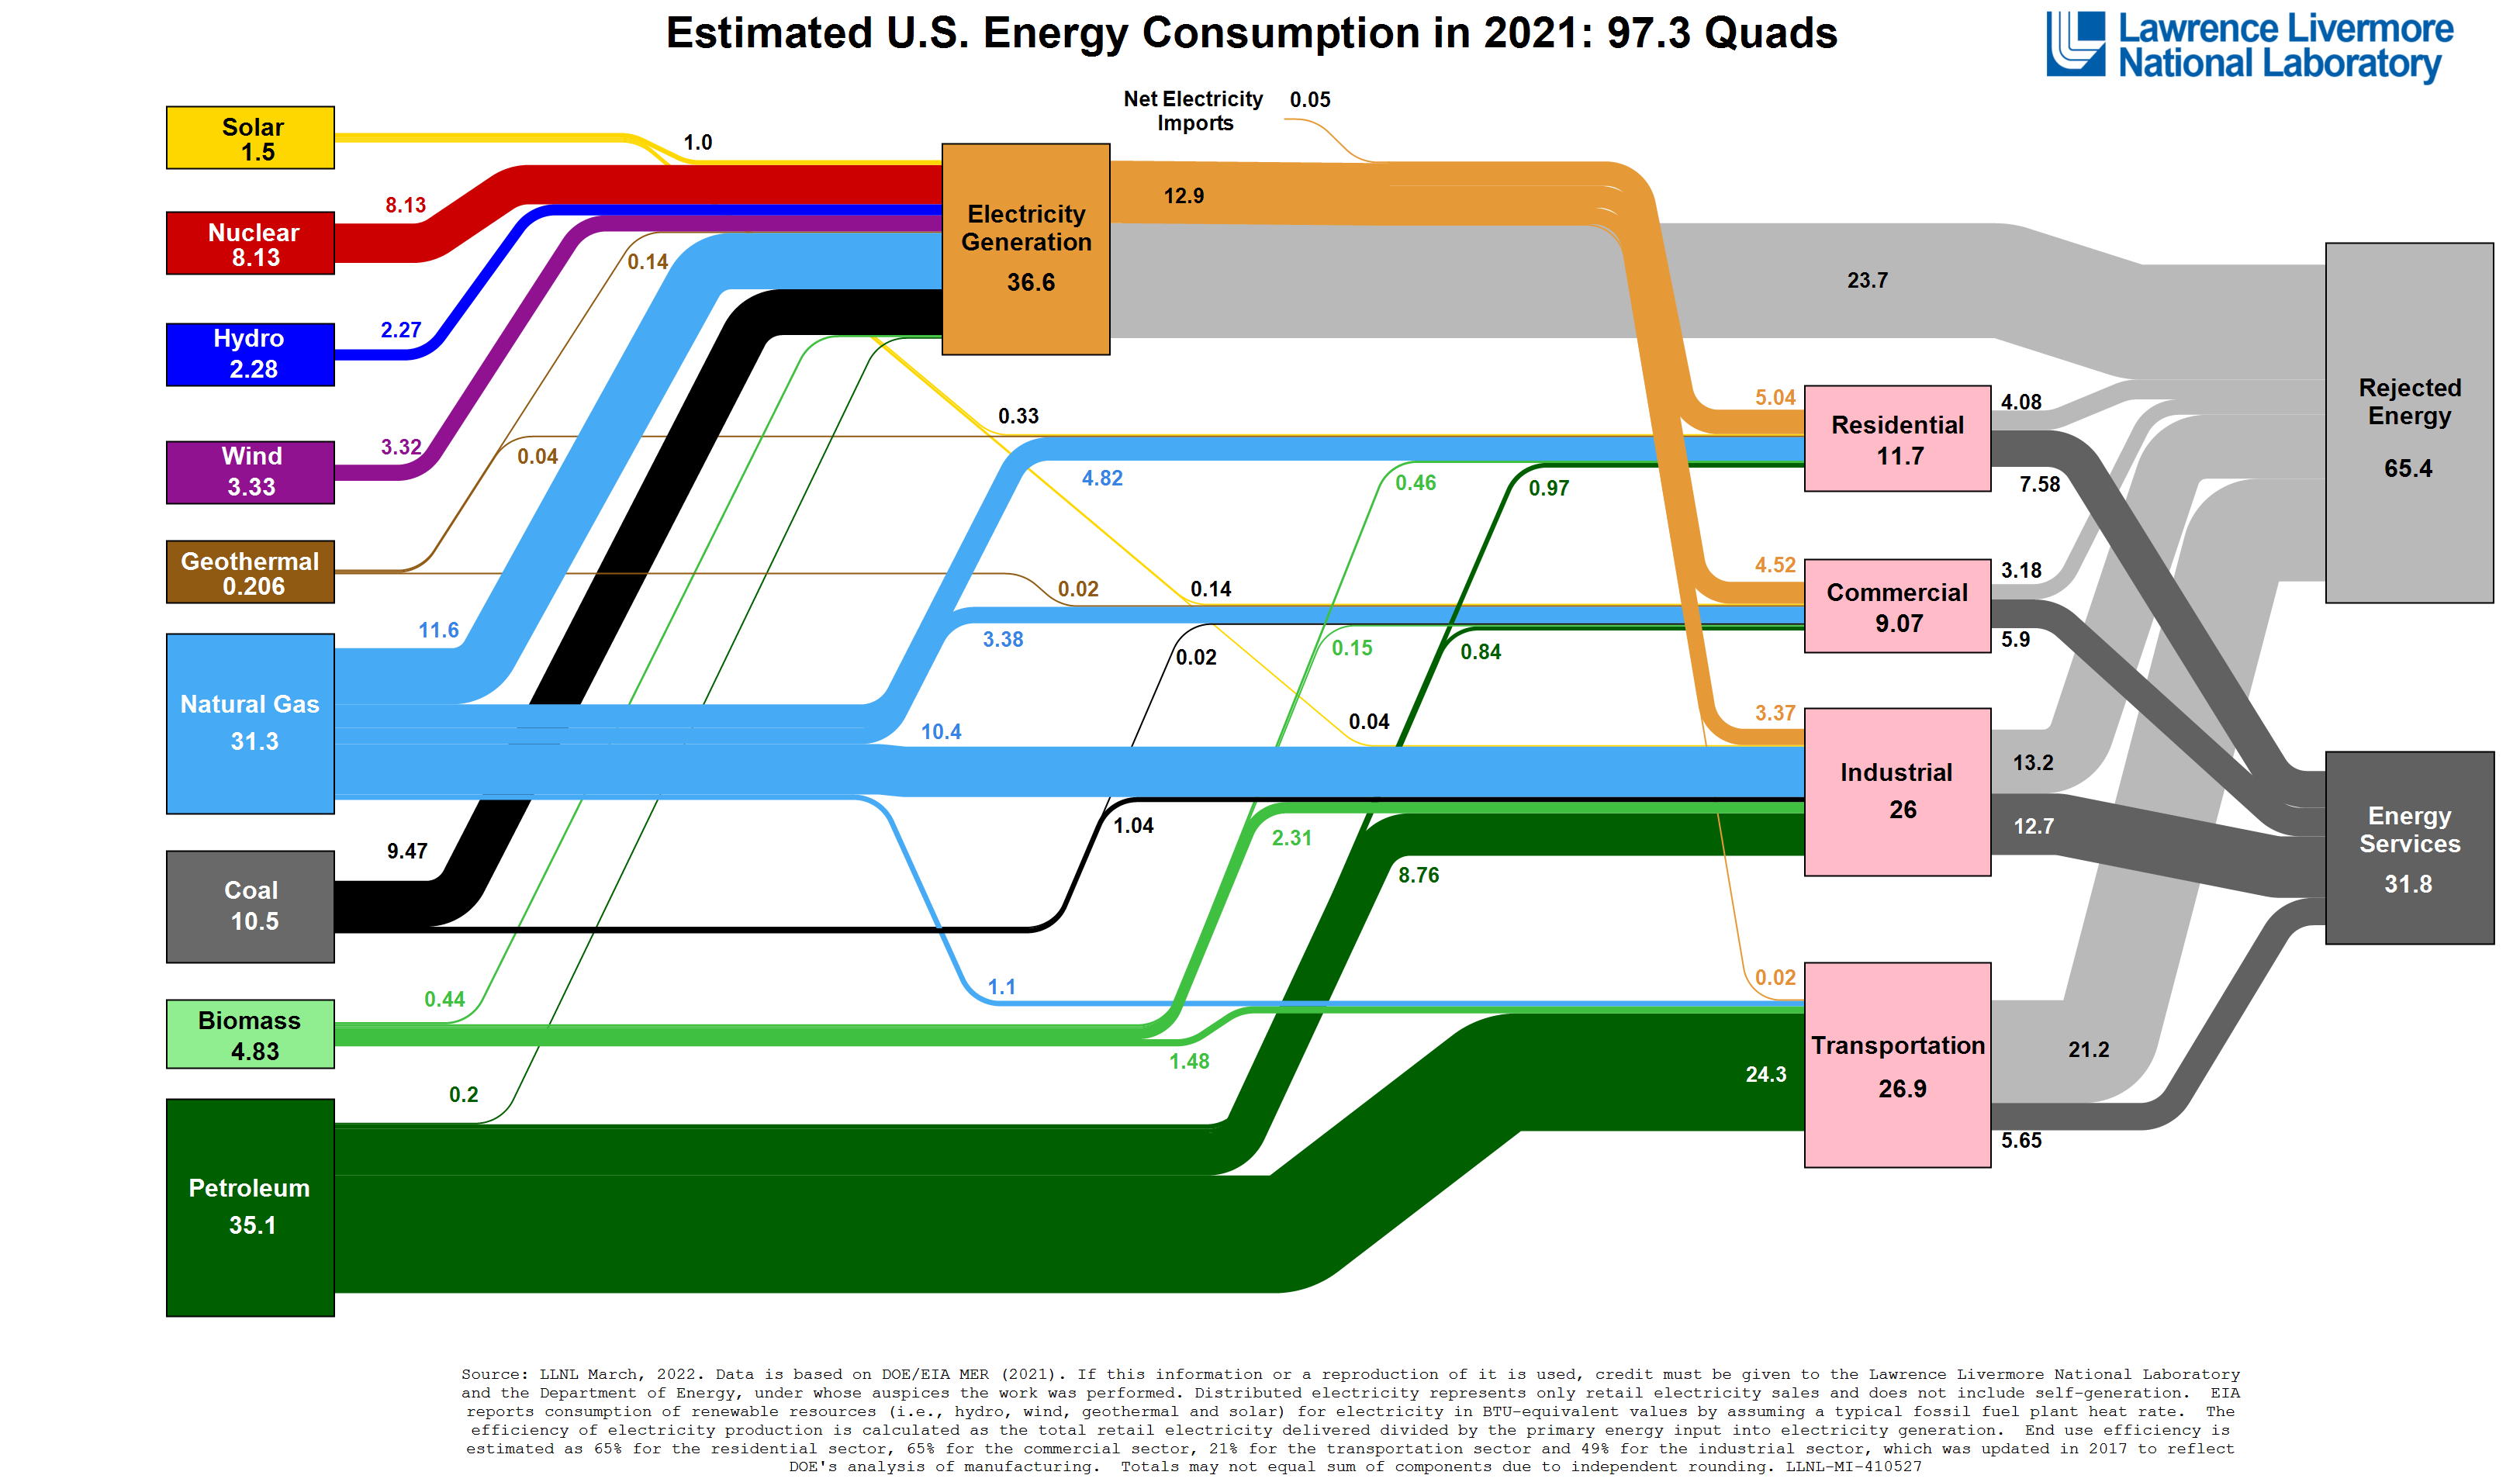
Heat engines power our lives and very little is stated in the Main Stream Media about the importance of conventional energy. Especially, Thermal Energy. In fact, if anything is written or discussed on TV, the MSM demonizes carbon and thermal power. This article is an attempt to explain the immensity of electric power generation systems on which we depend. There is a war to abolish fossil fuels which provide about 80% of the fuel needed to power our lives. This is best shown on the LLNL Energy Flow Chart below. Yes, it is expressed in BTU’s (British Thermal Units) and each BTU is equivalent to 778 foot pounds of work which may have been accomplished by muscle power 150 years ago, but now many politicians and leaders seem to have forgotten what conventional energy has made possible. The Zimmer plant and many other fine coal plants are being decommissioned and most demolished, without replacement of similar reliable, affordable generation capacity. I wrote on this before, here, here and here. So have many other people and respected organizations that understand generation by conventional fuels. Some references of these others are included below.

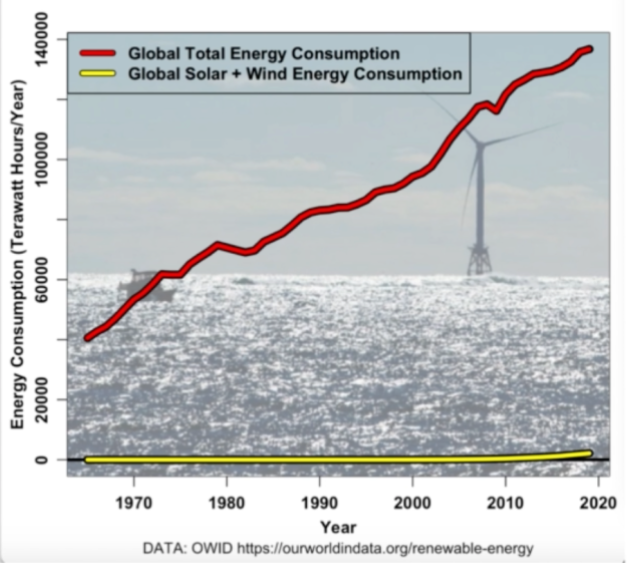
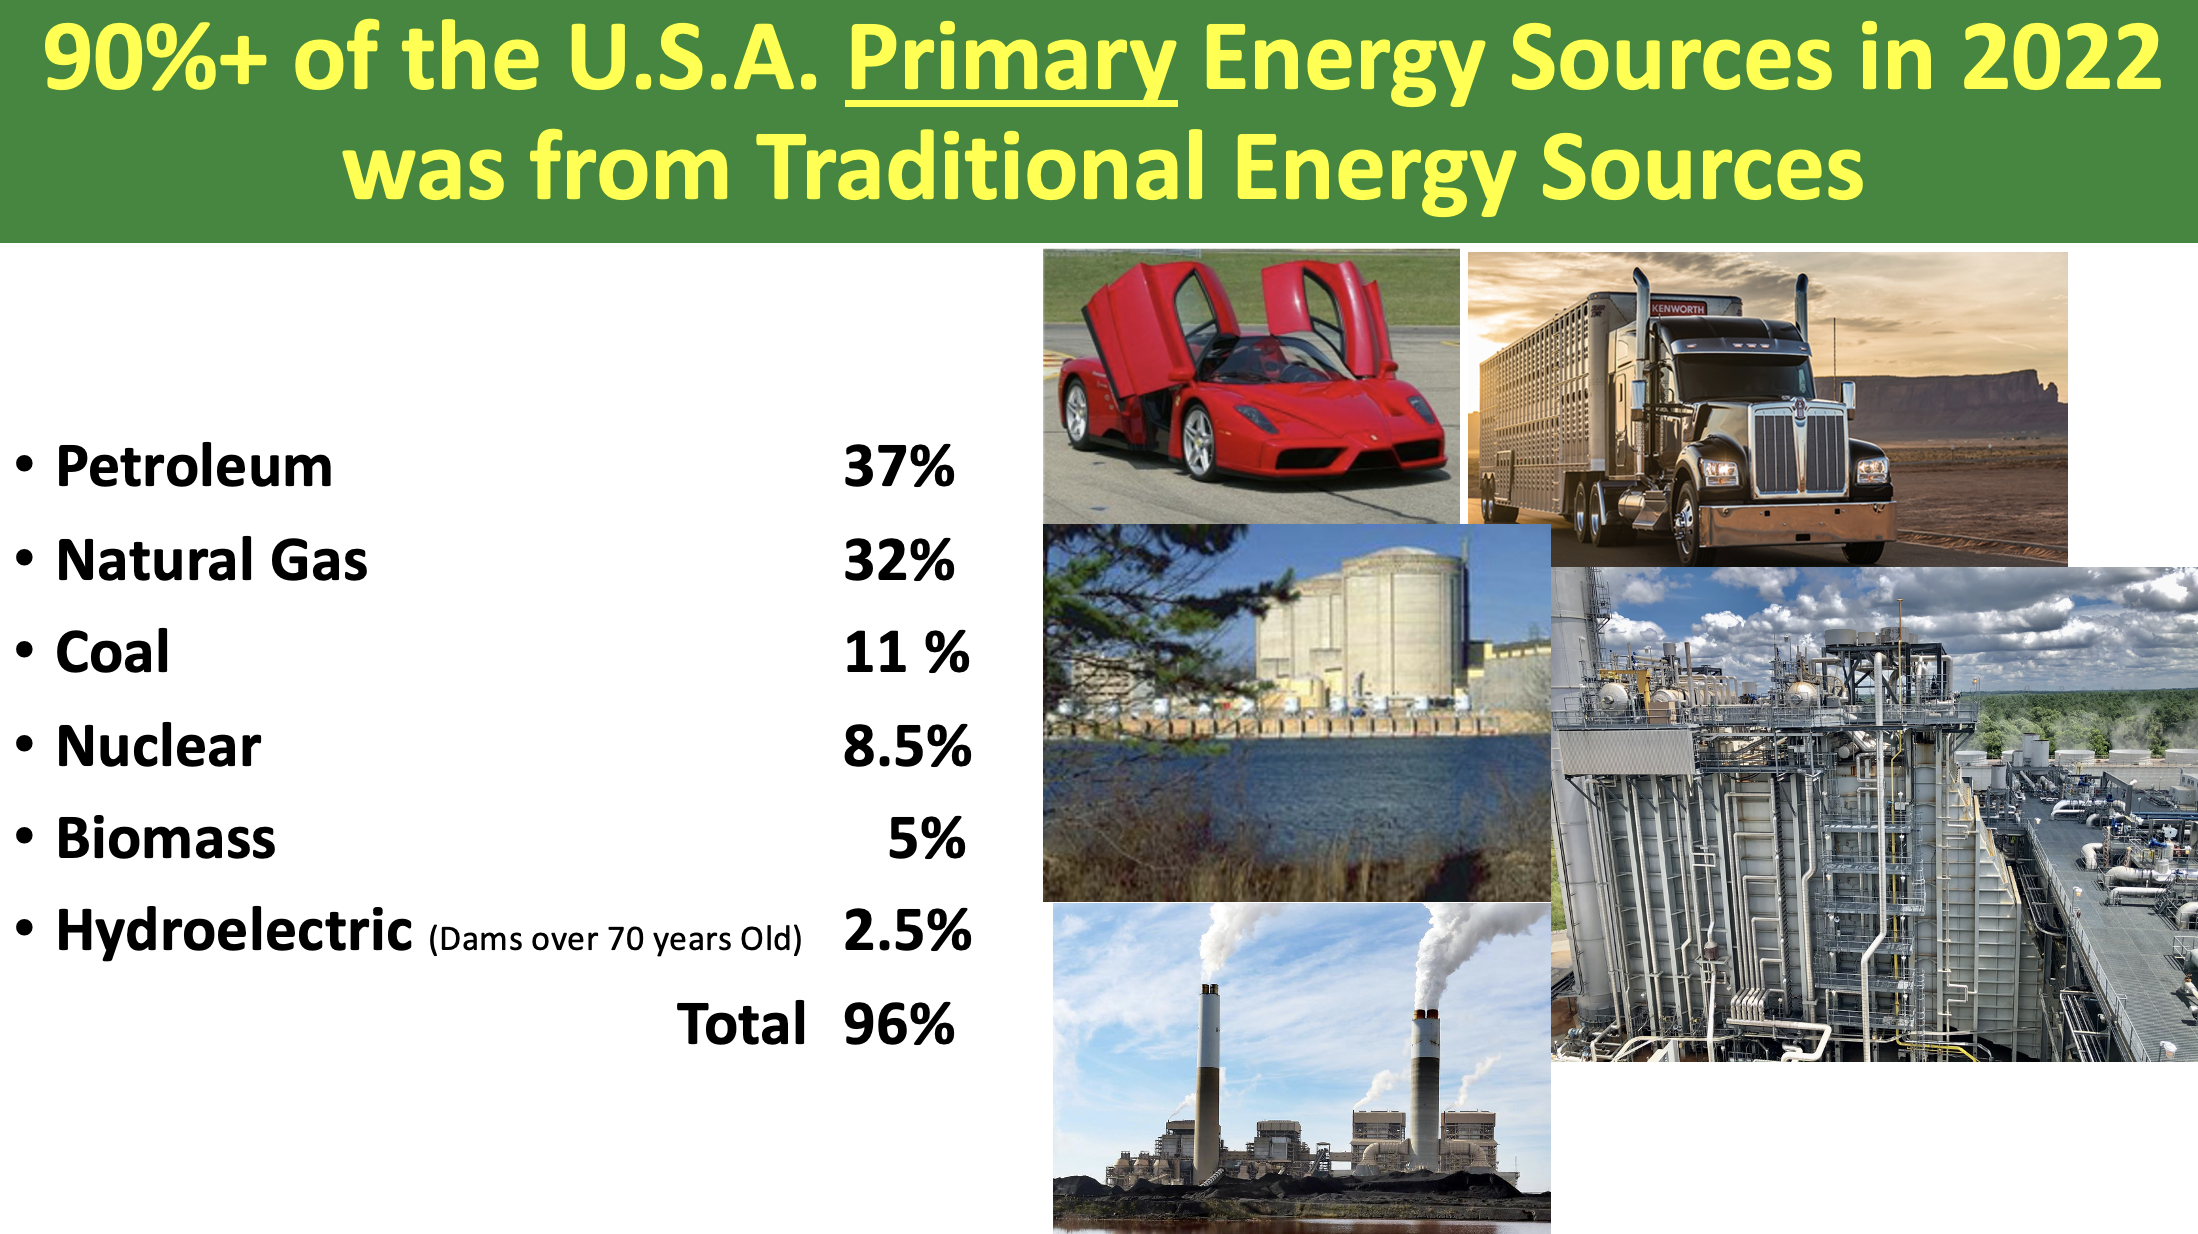
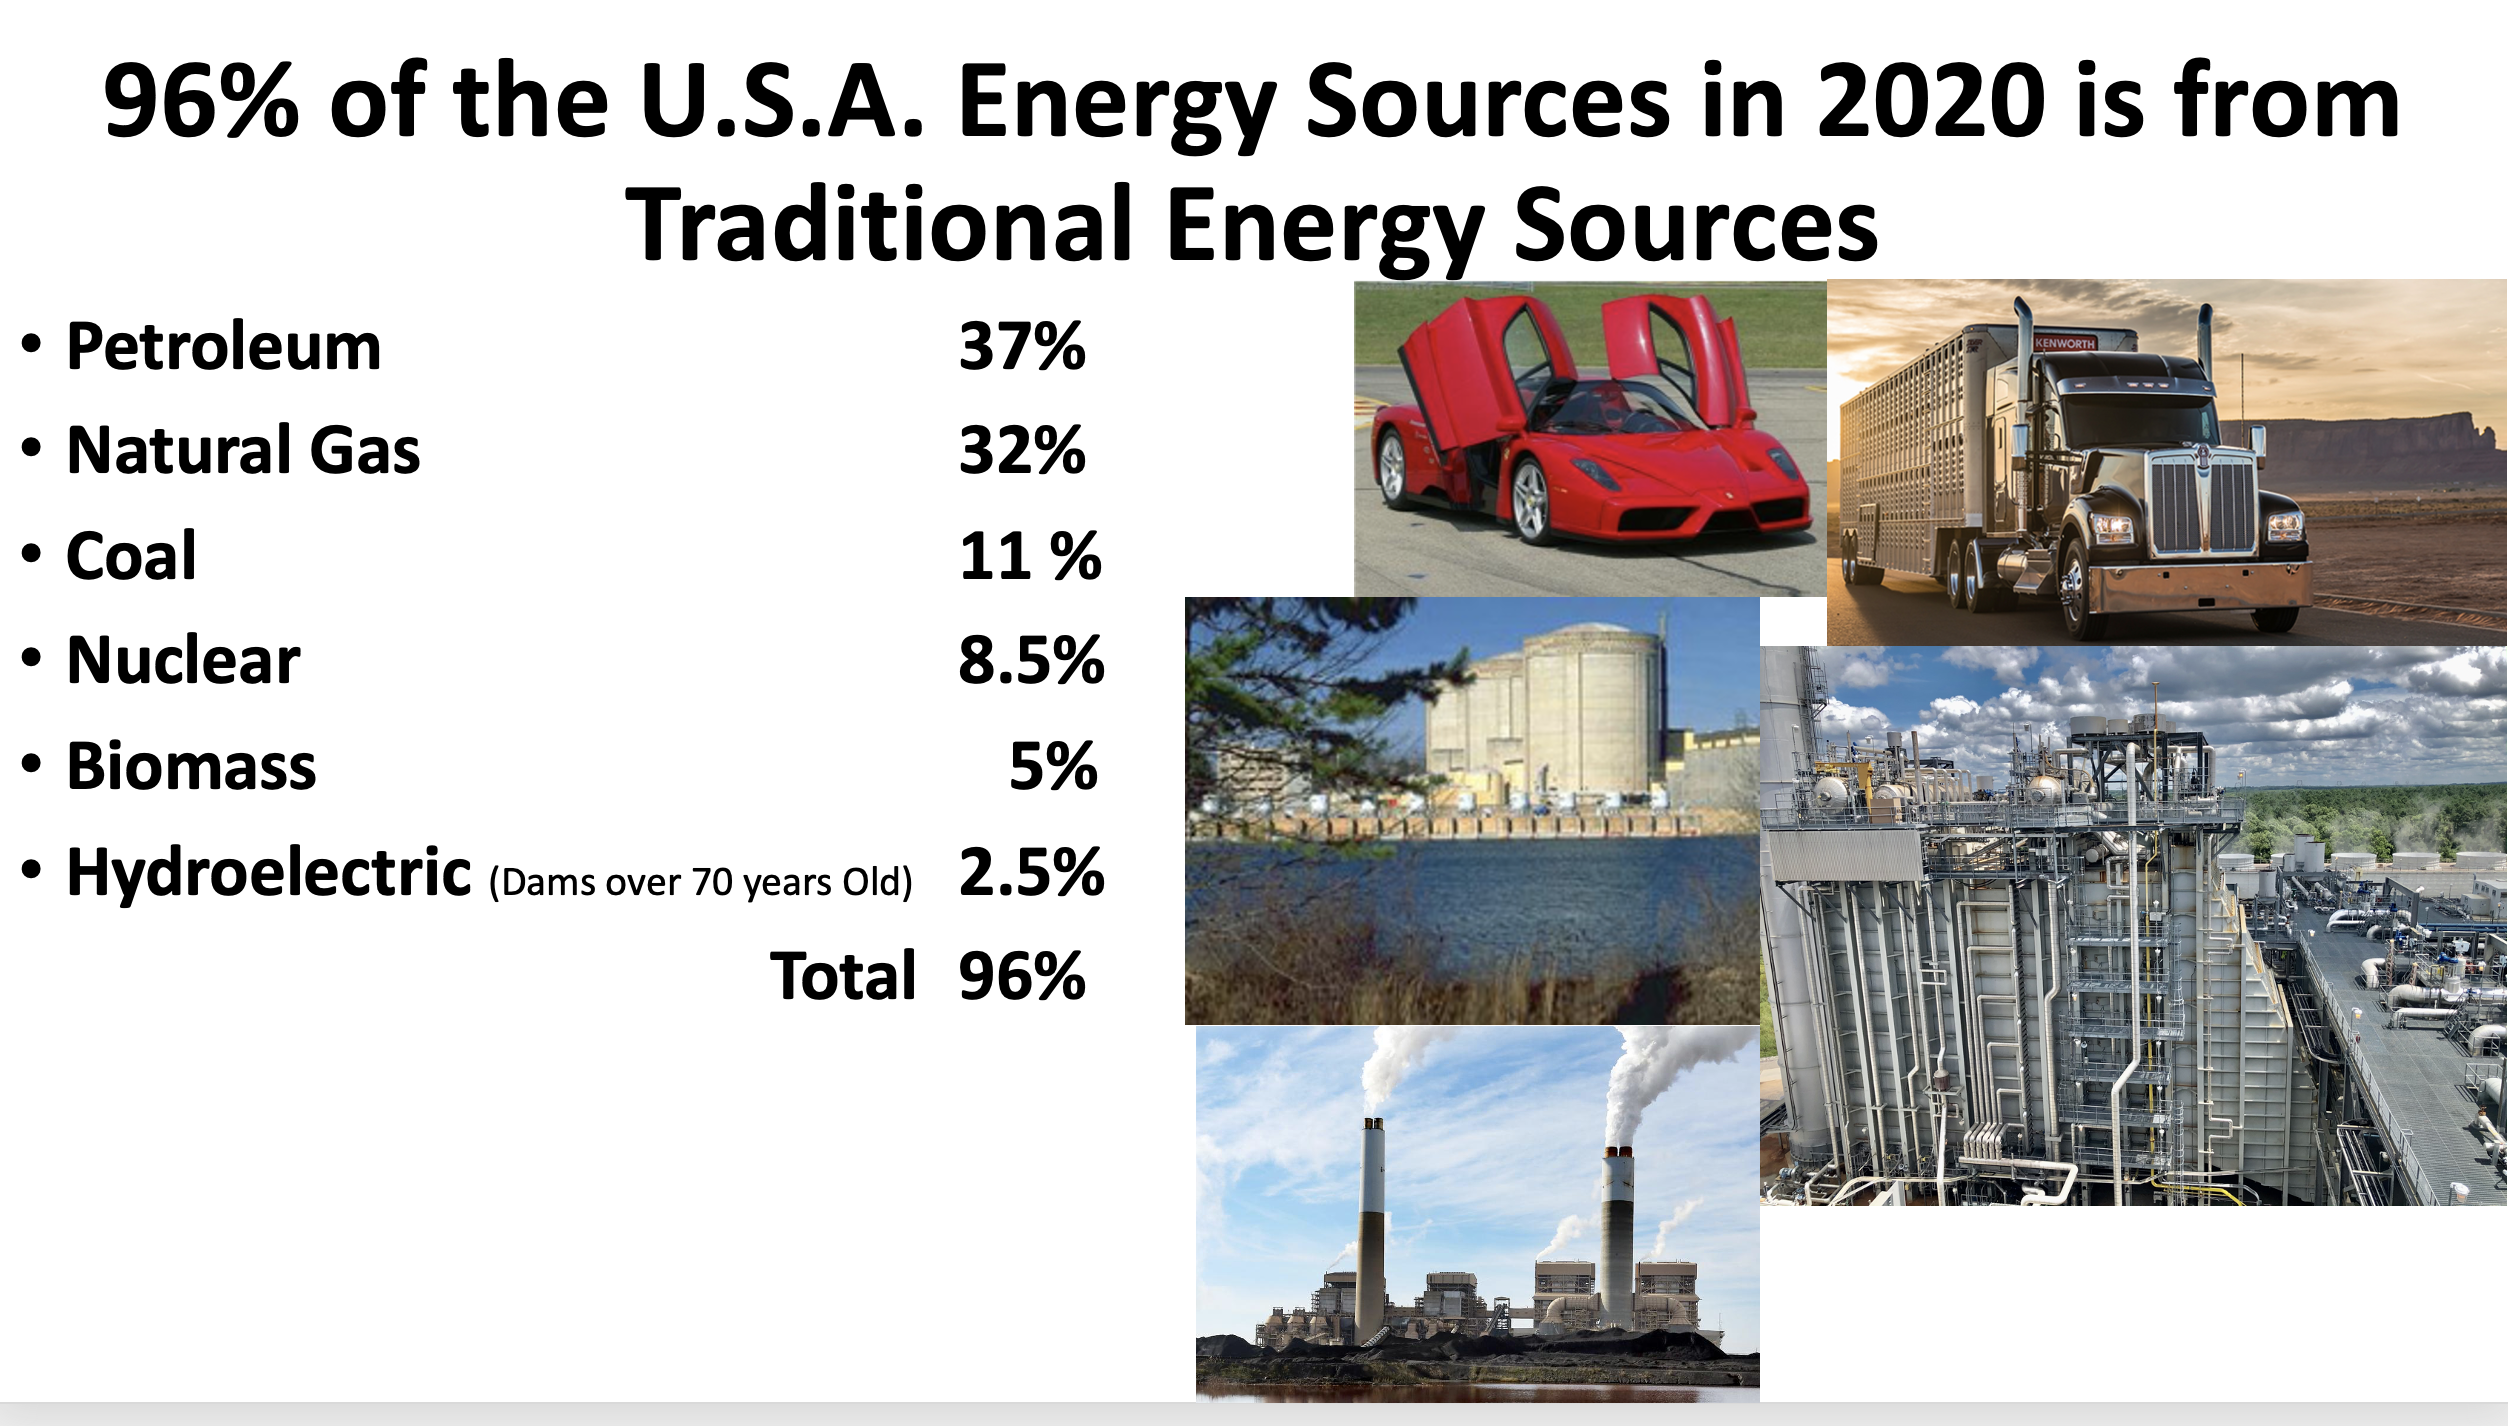
The 2023 LLNL Energy Flow Chart is not yet available. The most recent is for year 2022, shown below. Yes, 100.2 Quadrillion BTUs and only 4.96% of this Primary Energy was provided by wind and solar. This after decades of subsidies. Anyone that thinks wind and solar can replace the 92% conventional energy sources by 2030 or even 2050 are delusional. I wrote a previous article to discuss the “Impossibility of Achieving Net-Zero Carbon”. Then the Hawaii early adoption of the “Green New Deal” became public information. Hawaii is an “Energy Island” situated geographically with plenty of sunshine and wind. Their experiences with renewables has been very expensive and at reduced reliability. You can read more on the Hawaii experiences with renewable power here. Why? Hawaii is the perfect experiment to “Transition” to renewables with no Grid connection. Therefore, the availability, affordability and practicality is a perfect science experiment. Does anyone think electricity costs of over $0.40/kWH will improve the lives of Americans? Improve our economy and world competitiveness of manufacturing? I think not. EIA electricity costs by state here.

Americans use between 833,000 and 1,000,000 BTUs of energy each day to sustain our quality of life. There are some misguided leaders and politicians that are on a path to destroy the magnificent prime movers that power our lives.

Do you remember this poem from 1948?

First They Came, by
Pastor Martin Niemoller


First they came for the Communists
And I did not speak out
Because I was not a Communist
Then they came for the Socialists
And I did not speak out
Because I was not a Socialist
Then they came for the trade unionists
And I did not speak out
Because I was not a trade unionist
Then they came for the Jews
And I did not speak out
Because I was not a Jew
Then they came for me
And there was no one left
To speak out for me.

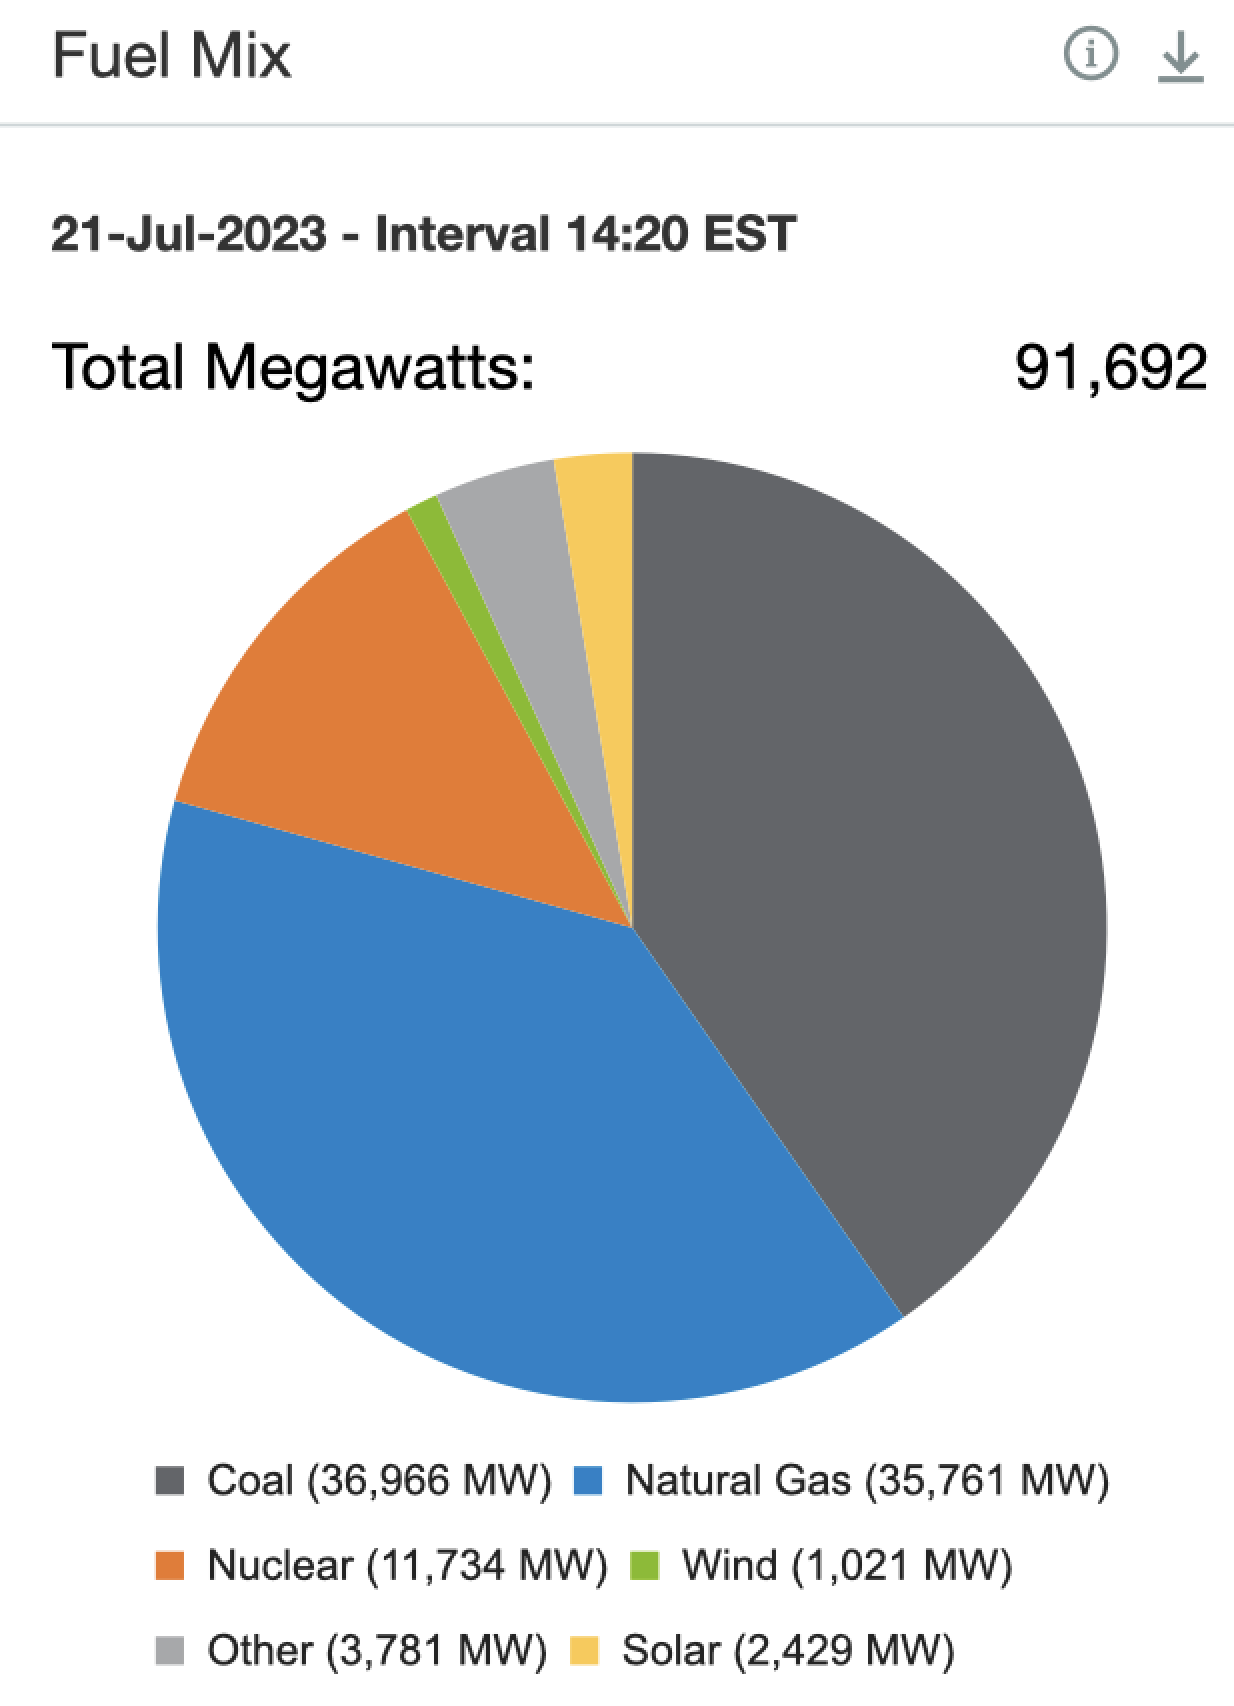
The environmental activists and Democrats in the U.S. have an anti-Carbon policy that has nothing to do with protecting human health or the environment. It is an agenda for one world government and control of our lives. We could paraphrase Martin Niemoller’s poem with the words….“First they came for Coal”. Trust me friends, the Biden-Harris and Democrat Party Climate Policies are NOT based on protecting your health. The (D’s) hate fossil fuels, including natural gas. The U.S. is on a path this year, to depend on about 50% (interruptible pipeline supplied) Natural gas fuel for power generation. I do not think this is wise. The Zimmer coal plant is an example of true “Energy Storage”. A coal pile plus, Coal barges tied up adjacent to the plant can provide weeks or months of Primary Energy storage. Pipelines are vulnerable to harm, whether accidental or malicious. Battery storage systems are for hours at best. Think about Grid Security and the many threats, within our country from Deep State Regulators (EPA, BLM and more) and Politicians, as well as from criminal minded foreigners. There are many threats to the energy supply to the country we love. Threats to your conventional energy powered lifestyle…..Please, THINK before you vote.

Thank you for reading and respectfully,

Dick Storm, July 30, 2024

References and Information for further research:

  1.  American Dream = 100 Quadrillion BTUs per Year April 7, 2022 https://dickstormprobizblog.org/2022/07/04/american-dream-100-quadrillion-btus/
  2. Providing a Sustainable Million BTUs per Day/Person, May 17,  2022: https://dickstormprobizblog.org/2022/05/17/providing-a-sustainable-million-btus-per-day-per-person-by-fuel-source/
  3. Energy=Life as We Enjoy it, Aug. 22, 2022: https://dickstormprobizblog.org/2022/08/22/energy-life-that-is-life-as-we-enjoy-it/
  4.  Facing the Hard Truths of Energy, Part 1,  79 Quadrillion BTUs, The Enormity of the Fossil Energy Systems Providing Sustainable Lives, Jan. 11, 2024 : https://dickstormprobizblog.org/2024/01/11/facing-the-hard-truths-of-energy-part-1-79-quadrillion-btusthe-enormity-of-the-fossil-energy-systems-providing-sustainable-lives/
  5. The Reality of Electrifying Everything,  April 9, 2024: https://dickstormprobizblog.org/2024/04/09/the-reality-of-electrifying-everything-and-the-primary-energy-required-to-generate-the-electricity/
  6. Visualizing 100 Quadrillion BTUs. Shouldn’t Coal Remain in our Energy Mix?” : https://dickstormprobizblog.org/2024/07/02/visualizing-100-quadrillion-btus-of-primary-energy-coal-should-remain-in-our-energy-mix/
  7. The Importance of Heat-Engines, A Primer: https://dickstormprobizblog.org/2020/09/09/the-importance-of-energy-part-3-heat-engines-a-primer/
  8. A Short History of Power Generation, 1850-1955, Part 1, January 2022: https://dickstormprobizblog.org/2022/01/14/a-short-history-of-energy-electricity-and-how-our-high-quality-of-living-came-to-be-high-human-development-index-part-1-1850-1955/
  9. World Energy Statistical Review year 2023 by the Energy Institute, published June 2024: https://www.energyinst.org/statistical-review/resources-and-data-downloads
  10. Lawerence Livermore National Laboratory Energy Flow Chart for year 2022: LLNL Primary Energy Flow Chart, 2022 for U.S.: https://flowcharts.llnl.gov/sites/flowcharts/files/2023-10/US%20Energy%202022.pdf
  11. POWER Magazine, Brief History of G-E Gas Turbines for Power Generation: https://www.powermag.com/a-brief-history-of-ge-gas-turbines-2/
  12. Dick Storm Blog post, “Wake Up Americans!” Sept. 21, 2023: https://dickstormprobizblog.org/2023/09/20/please-wake-up-america-your-energy-and-electricity-generation-reliability-are-at-risk/
  13. THE ERA OF RELIABLE, AFFORDABLE, ENERGY AND ELECTRICITY GENERATION: PART https://dickstormprobizblog.org/2023/10/04/the-era-of-reliable-affordable-energy-and-electricity-generation-part-1/
  14.  The Green Energy Crisis is Here, Part 1, Sept. 17, 2023: https://dickstormprobizblog.org/2023/05/29/the-green-energy-crisis-is-here-part-1/
  15. The Green Energy Crisis, Part 2, “Meet Some of the People that Caused it”,  June 2023: https://dickstormprobizblog.org/2023/06/14/green-energy-crisis-part-2-meet-the-policy-makers-that-caused-it/
  16. The Green Energy Crisis, Part 3, June 26, 2023: https://dickstormprobizblog.org/2023/06/26/green-energy-crisis-part-3-public-energy-education-is-needed-each-person-in-the-u-s-uses-about-315-million-btus-of-primary-energy-year-this-is-not-practical-or-even-possible-to-replace-with-win/
  17. FERC Summer Assessment, May 2024: https://www.ferc.gov/news-events/news/report-2024-summer-energy-market-and-electric-reliability-assessment?utm_source=www.gridbrief.com&utm_medium=newsletter&utm_campaign=data-center-overload-critical-mineral-supply-energy-grids-in-modern-warfare
  18. Grid Operators Warn of Blackouts due to Excessive EPA Rules, America’s Power, March 6, 2024: https://americaspower.org/operators-regulators-concerned/
  19. Energy Freedom by Thomas Shepstone: Kammie the Commie by Thomas Shepstone: https://open.substack.com/pub/energysecurityfreedom/p/kammie-the-commie-a-climate-cultist?r=kv1a9&utm_campaign=post&utm_medium=email
  20. Ron Stein article in America Out Loud, Harris is More Radical on Her Energy Policies than Joe Biden: https://www.americaoutloud.news/kamala-harris-is-more-radical-on-her-energy-policies-than-joe-biden/
  21. WSJ article on Kamala’s “Fracking Flip-Flop” July 2024: https://www.wsj.com/articles/kamala-harris-fracking-energy-oil-gas-biden-administration-9dd5a023?mod=latest_headlines
  22. Politico article on the Russian threat to natural gas supplies, 2022: https://www.politico.com/news/2022/03/02/gas-pipelines-cyber-risk-00011898
  23.  Threats to the Electric Grid, March 15, 2024:  https://dickstormprobizblog.org/2024/03/15/threats-to-the-grid-electricity-reliability/
  24. EIA-World’s Largest Producer of Crude: https://www.eia.gov/todayinenergy/detail.php?id=61545#:~:text=The%20crude%20oil%20production%20record,of%2013.0%20million%20b%2Fd.
  25. Forbes article by David Blackmon on Democrat Party Energy Policy: https://www.forbes.com/sites/davidblackmon/2024/07/23/energy-policy-would-shift-left-in-a-kamala-harris-presidency/
  26. Dick Storm Blog, “What is Endangered, “Climate or Freedom” 2021: https://dickstormprobizblog.org/2022/02/27/what-is-endangered-climate-or-freedom-this-is-the-sub-title-of-the-book-blue-planet-in-green-shackles/
  27. Three more references on Kamala Harris: https://bwcentral.org/2021/03/kamala-harris-who-is-she
  28. https://radiopatriot.net/2024/07/23/kamalas-background-more-than-you-knew/
  29.  https://www.politico.com/news/magazine/2021/08/18/kamala-harris-law-school-politics-503924
  30. Thomas Shepstone, Kammie the Commie: https://open.substack.com/pub/energysecurityfreedom/p/kammie-the-commie-a-climate-cultist?r=kv1a9&utm_campaign=post&utm_medium=web&comments=true
  31. American Energy Alliance, Profile of Kamala Harris on Energy policies and actions: https://www.americanenergyalliance.org/2024/07/candidate-profile-kamala-harris-on-energy/?unapproved=126046&moderation-hash=7ee47b970484ee52cae2263fe63f6287#comment-126046
  32.  Facing the Hard Truths of Energy, Part 1,  79 Quadrillion BTUs, The Enormity of the Fossil Energy Systems Providing Sustainable Lives, Jan. 11, 2024 : https://dickstormprobizblog.org/2024/01/11/facing-the-hard-truths-of-energy-part-1-79-quadrillion-btusthe-enormity-of-the-fossil-energy-systems-providing-sustainable-lives/
     Influencers of U.S. Energy Policy, January 3, 2023: https://dickstormprobizblog.org/2023/01/04/influencers-of-american-energy-policy/
  33. Facing the Hard Truths of Energy, Part 2, The Reality of Replacing Conventional Forms of Energy, Jan. 2024: https://dickstormprobizblog.org/2024/02/06/facing-the-hard-truths-of-energy-part-2-some-facts-on-the-reality-of-replacing-conventional-forms-of-energy/
  34. Facing the Hard Truths of Energy, Part 3, The Transition that Isn’t, from the perspective of Minerals, Feb. 8, 2024: https://dickstormprobizblog.org/2024/02/08/facing-the-hard-truths-of-energy-part-3-the-transition-that-isnt-from-the-perspective-of-minerals/
  35. Facing the Hard Truths of Energy, Part 4, The True Agenda for Climate Policies, Feb. 13, 2024: https://dickstormprobizblog.org/2024/02/13/facing-the-hard-truths-of-energy-electricity-generation-and-environmental-protection-part-4-what-is-the-true-agenda-for-climate-policies/
  36. Energy Matters! March 2024 : https://dickstormprobizblog.org/2024/03/11/energy-matters/
  37. Update on Hawaii’s “Green New Deal” March 2024: https://dickstormprobizblog.org/2024/03/20/hawaii-a-glimpse-into-the-future-of-the-green-new-deal-aka-inflation-reduction-act-here-is-an-update/
  38. The Rise and Fall of Nations from the perspective of nuclear power systems manufacturing: https://dickstormprobizblog.org/2023/08/15/the-rise-fall-and-rise-again-of-nations-and-the-realities-of-energy/
  39. USA Today Electricity Costs by State, July 19, 2024: https://www.usatoday.com/money/homefront/deregulated-energy/electricity-rates-by-state/
  40. he Impossibility of Achieving Net-Zero Carbon, Oct, 2021: https://dickstormprobizblog.org/2021/10/13/the-stupidity-of-net-zero-carbon/

Visualizing 100 Quadrillion Btus of Primary Energy? Coal Should Remain in Our Energy Mix!

America uses right at 100 Quadrillion Btus of Primary energy each year.(12 &13) We have used right at this amount of total Primary Energy for over 20 years. The entire world uses about 600 Quadrillion BTUs of total Primary energy. The energy systems to provide this indispensable primary energy are beyond huge and so large and complicated that it is difficult to describe in words. In this post, I will attempt to demystify the immensity of the energy systems we depend on.

Energy on Which We Depend

Remember the last hurricane or winter storm that killed your power and made gasoline short in supply? It seems to take a traumatic experience such as severe weather for us to appreciate the importance of energy. Whether for heating in the winter, for gasoline to take a road trip, cooking hamburgers on the BBQ or cooling our homes in the heat of summer.  Like many things in life, “Energy is not missed until it is unavailable”.

Dr. Robert Hargraves wrote an excellent article entitled, “Energy IS the Economy” for Grid Brief in Nov. 2022. (48) In the Developed world affordable, reliable and affordable energy is vital to sustaining Industrial production, commerce and our economy. Energy is a prerequisite for almost anything and everything we do or have come to depend on.

315 Million BTUs/Person/Year

Each American uses on average, about 315 million Btus (BTU=British Thermal Unit) of Primary Energy each year. This averages about 863,000 Btus per capita, each day. The purpose of this article is to explain the importance of “Energy” in our everyday activities. Folks that are not involved as employees in the energy business may not have a comfortable understanding of the relationship of Primary Energy in BTUs (British Thermal Units) and work. So, let’s take a look at the fundamental energy equivalence of BTUs and work. One Btu=778 Foot Pounds of work. What is a BTU? It takes 1 BTU to raise one pound of water 1 degrees F.

Example: A pint of water is about one pound. So visualize warming a pint of water from 32 degrees F. to 212 degrees F., (That will require 180 BTUs. 212-32=180)

Another equivalent to keep in mind; One kWh of electricity is 3,413 BTUs. These equivalents are at 100% conversion efficiency. Since our grandparents days, we have come to use and depend on a lot of thermal energy to replace animal and human muscle power. The replacement of muscle power with heat engines fueled by energy has served Humanity very well over the last 130 years. Both in heat engines for transportation and for Bulk Electric Power Generation by Electric Utilities. Replacement of muscle power with thermal energy has come a long way since my grandparents days.

This commentary is my attempt to explain the vastness of the energy systems that have created the high quality of life on which we depend and take for granted, thanks to heat engines and thermal power plants.

Why BTU’s? (British Thermal Units)

Government energy statistics are expressed in BTUs, and the BTU equivalent of wind and solar are calculated and converted to BTUs. Example; One kWh of wind or solar is equivalent to 3,413 BTU. International journals and reports may use other energy units, such as kWh’s or Joule’s. In the U.S. our EIA (Energy Information Administration) uses BTUs as the unit of energy for data reporting.

Dr. Lars Shernikau has published an excellent article explaining Primary Energy in his article, “Primary Energy is Still King” (34) I recommend reading this, because he has done an excellent explanation to provide an understanding of primary energy and renewables. Here.

100 Quadrillion BTUs/Year

Coal, oil, natural gas, nuclear, wind and solar are included in the LLNL chart below to total 100.3 Quadrillion BTUs of Primary Energy for the year 2022. It is my hope that this post will help the reader to get your arms around the vastness of our supplies of Primary energy and what it does for us. A reminder: Electricity is Secondary Energy and Primary Energy is required to generate Electricity. Each Kilowatt Hour requires 3,413 BTUs at 100% efficiency. The most efficient GTCC generating plants are about 60% efficient so that is about 5,690 BTUs of input to the gas turbine at steady loads at the most efficient load point to produce one kWh of electricity. A deeper dive into Heat Engines and heat rates are topics for another time. Suffice it to say, we use a lot of primary energy for electricity generation, a little more than a third (37.7 %) of the total primary energy America consumes.

Transportation, Industrial, Residential and Commercial Energy Demand

We also use a lot of primary energy for transportation, food production, residential heating, cooking, commercial and industrial production. Long story short….reasonable cost, abundant and reliable energy powers our high quality of life.

Examples and Reminders of the Immensity of the Energy Systems on which we Depend

The U.S. Electric Grid has been described by the Smithsonian (and others) as “the Largest Machine Ever Built“, here.

The quantity of motor fuels used each year was described in 2007 by the National Petroleum Council chairman, Lee Raymond,

“As enough to fill 150 billion one gallon cans that if placed end to end, would circle the earth 1,000 times”(2)

That was 2007. In the year 2022 motor fuels increased and the U.S. used 209 billion gallons of gasoline and Diesel fuel.(3,4) Gasoline and Diesel are forms of Primary energy. That is a 39% increase of motor fuels in 15 years.

America uses right at 20 million barrels of oil each day. The total petroleum use in Quadrillion BTUs energy is about 36 Quadrillion Btus/year. This is about 36% of the Primary Energy we use. Below is a photo of me and the 48″ Alyeska (Alaska) Pipeline. This 48″ line is above ground to protect the frozen Tundra. The Alyeska Pipeline at its peak flow delivered about 2 million barrels per day of crude oil from the north slope of Alaska. It would take ten pipelines the size of the 48″ Alaska Pipeline to provide the petroleum needed to supply 36% of America’s total Primary Energy demand and needs.

Perhaps you can visualize in your mind, ten of these lined up side by side easier than you can imagine 150 Billion one gallon gasoline cans circling the earth 1,000 times? That is how much crude oil we need and depend on to provide a little over one third of our Primary energy needs. In addition to transportation energy needs, petroleum is also used as the feedstock for plastics and thousands of other products. Ron Stein has written much on the thousands of products derived from petroleum. Here is one of his excellent articles, “Are Politicians Oblivious to the Need for Crude Oil, or are they Intentionally Sending Us Back to the 18th Century?“.(49)

Alaska Pipeline and Dick Storm, photo used in numerous Presentations

How About Coal. Is Coal Still Important?

For electricity generation Coal provided over 50% of the primary energy to generate U.S. electricity up till about 2011. In 2011 about 22% of America’s Primary Energy was provided by coal. (This is a fact). In 2011 the total Primary energy use was 107 Quadrillion BTUs and coal provided 21% of the total. Since 2012 much of the coal power generation fuel has been replaced by natural gas. Here below, is the EIA Total Energy Flow Chart for 2011. This supports my statement that America has depended on about 100 Quadrillion BTUs of energy for decades. In the 2011 example, Total Primary Energy was 107 Quadrillion BTUs.

https://www.eia.gov/totalenergy/data/annual/pdf/sec1_3.pdf

Today coal fuel provides about 20% of the fuel used for electric power generation. To be exact, coal provided 9.9 % of the total primary energy in 2022. Coal use provided the fuel for about 20% of the electricity generation in that year.

Coal Fuel for Electricity Generation

Now let’s get back to the importance of coal. Today about 10% (I rounded 9.91% to 10) of the U.S. primary energy is provided by coal. This is about 10 Quadrillion BTUs. The photo below is a coal car which holds 100 tons of coal. The length of the coal car, coupling to coupling is about 55 feet. The heat content of 100 tons of western Powder River Basin coal at 9,000 BTU’s per pound is about 1,800 million Btus per coal car. Dividing 1,800 million Btus into 10 Quadrillion results in a train of coal cars about 52,083 miles long. Long enough to circle the earth two times. That is just the coal used in the U.S.A. in 2022 and we used more than twice that much in 2011. (see 2011 Sankey Diagram above)

A typical 100 Ton coal car. The energy equivalence of 100 tons of 9,000 Btu/# coal is 1,800 million Btus
Typical Unit Train of about 100 coal cars, each loaded with about 100 tons of coal. The total energy of a 100 coal cars is about 180,000 million Btus or .00000018 Quadrillion Btu

Again, to supply 10 Quadrillion Btus of coal for electricity generation in the U.S. the coal would fill a train that would circle the earth two times. Just as a matter of reference, the amount of coal used in China is more than five times the coal consumed in the U.S.A. According to World O Meter, China uses about 4.4 Billion metric tons/year. According to the IEA, Coal was the primary energy used to provide 60% of China’s electricity in 2022. (22) Coal is the top fuel for electricity generation in most Developing countries and including China and India. As shown below, in 2023 the world used an all time record of coal use.

On January 6, 2024, here is a screen shot of the MISO (Midcontinent Independent System Operator) Energy RTO. Note that although coal is not believed to be needed by government Bureaucrats, the MSM and environmental activists, it is providing almost 40% of the electricity being used this day at 0600. A post on the Count on Coal Blog is aptly entitled, “2024 A Critical Year for Grid Reliability” which provides another take on the importance of coal (20). Also POWER Magazine Commentary, “EPA’s No-Win Rule for the Electricity Grid” July 2nd, 2024. (50)

Here is an update from Jan. 2024 on coal power in the Midwest from the website of MISOEnergy.org.

What does the rest of the world understand that we do not? More coal was used in 2023 than all of history.

https://globalenergymonitor.org/projects/global-coal-plant-tracker/dashboard/

Coal Remains Important in the U.S.

Coal remains important in America. The Count on Coal Blog offers many anecdotes, data and environmental policy assessments. (20)

Especially in winter, because snow storms will likely be even more difficult for electric Utilities to keep up with demand. In addition to the problems of snow blocking solar collectors, ice on wind turbine blades make them less reliable as well. It is worth recalling the winter storm in Feb. 2021 which created Blackouts in Texas and a near collapse of the entire ERCOT Grid. Over 246 people were killed during that storm. Many as a result of the rolling Blackouts. I wrote my views on the missing 6,000 MW of coal plant capacity that had recently been shut down, on this blog. (51)

How About Natural Gas?

How do we visualize 33 Quadrillion Btus in natural gas? About 1/3 of America’s Primary energy is provided by natural gas and about 50% of our electricity is expected to be generated from natural gas in 2024. So, to get an idea of the enormity of the importance of natural gas, let’s try looking at pipelines providing natural gas across the U.S.A. Here is the EIA map of Interstate natural gas pipelines in the U.S. 

Regulations and Environmental NGO’s hate pipelines and do all that they can to restrict their expansion, but that is a story for another day. (21) Suffice it to say, natural gas is very, very important to America in 2024. It is projected that in 2024 natural gas will provide the fuel for about 50% of all U.S. electric power production.

It is difficult to visualize the enormity of the natural gas flows from the map. Also difficult to visualize 33 Quadrillion BTU of invisible natural gas flowing through a pipe. So, let’s try this, a photo of an LNG Tanker. Natural gas stored as a liquid at about minus 263 degrees F. 

Liquified LNG is about 1/600th the volume of the gas as used for power generation or cooking.

https://www.balticshipping.com/vessel/imo/9216298  114,354 Gross Tons

This LNG Tanker holds about 4,770,000 cubic feet of natural gas, when vaporized for use. This is equivalent to about 5 trillion Btus. This equates to about the same energy equivalence of three Unit Trains, each comprised of 100 coal cars.

To visualize 33 Quadrillion Btus, picture 6,000 ships such as the one shown above.

So, how do you visualize an armada of 6,000 ships like that shown above? Try this. If 6,000 ships, each 950 feet long were placed in a line, stem to stern touching, they would reach over 1,070 miles. So a continuous line of ships from just south of Philadelphia in the Delaware Bay would reach to Miami. This would represent the quantity of natural gas, stored in super dense liquid form used in one year. This line of ships would be equivalent to the natural gas burned in the U.S. in 2022. In 2024 gas consumption will be even greater.

The latest LNG ships are larger at about 175,000 cubic meter capacity, such as the ship Pan American shown below.

Energy use is directly related to economic output and the quality of life we enjoy. Economic prosperity is another subject, so let’s stick to the immensity of the quantity of energy that we need and depend on. If you are interested in the relationship of energy and economic prosperity, there are numerous references below. ( 5, 6, 7, 8, 9, 10, 11)

Getting back to electricity and the largest machine ever built. Yes, the Electric Grid is huge and complicated. However, huge as it is, the Electric Grid uses about one third of the total primary energy used in the U.S. The other two thirds is used for transportation, Industrial production, heating, cooling, cooking and commercial uses. “Electrifying Everything” as promoted by numerous non technically trained politicians, NGO’s, wealthy Philanthropists and well intentioned corporations, is simply not possible.

Paraphrasing Lee Raymond’s comments in 2007,

“It will take an enormous effort and a lot of time to replace the current energy systems”(2)

Take a look/listen to Lee Raymond for about two minutes. Start at minute # 8 here.

From Dick Storm presentation to Rotary Club, Dec. 7, 2023 (14)

Primary Energy Use of the U.S.                      100 Quadrillion Btus/Year

The Lawrence Livermore National Laboratory Sankey Diagram of U.S. Energy Flows for the year 2022 is copied below. The energy use is reported in British Thermal Units so that one unit of energy can express all common forms of energy that we use. The energy sources reported are wind, solar, petroleum, natural gas, nuclear, hydroelectric, Biomass and Geothermal. Interestingly to me is the fact that America has used a steady flow of about 100 Quadrillion Btus of energy (+/- 10 Quads) for about the last 25 years. This in spite of population growth and increased electrification of nearly everything we do. The chart below shows the flows of sources of PRIMARY Energy.

Hydrogen is not on the chart but there is a lot of talk about the future of hydrogen as a fuel. Let me just state for now that hydrogen, like electricity, is another form of Secondary Energy. It takes about 3 or 4 units of Primary Energy to produce one unit of hydrogen energy.

The next graph is also from the U.S. Department of Energy and it shows the total energy use by fuel since the Founding of America. The key point is: Over 90% of the Primary energy we depend on each day and use, is sourced from conventional sources of gasoline, Diesel, natural gas, Jet Fuel, coal, nuclear, Hydroelectric and Biomass. Only 5.71% of the Total Energy used in 2022 came from wind and solar.

Electricity and the Grid, “The Largest Machine in the World”

The following is copied from a post by Bloomberg and I give full credit to Bloomberg and the author. It is well stated and I thought apropos to explain the Immensity of the electric grid. From Bloomberg and to be fair, this refers to the electric grids all over the world, not only the U.S.A. …..

“Bloomberg 2 May 2023 Merryn Somerset Webb There is something attractive about things that are complicated, boring and expensive. What is the biggest thing that mankind has ever built? All the obvious answers to this pub-quiz question are wrong. It is not the Great Wall of China, nor the Three Gorges Dam, nor the Large Hadron Collider. It is also not Terminal 3 at Beijing Capital International Airport. In fact, the feat belongs to something rather prosaic: the global electricity grid. The total length of the distribution grid globally is estimated to be some 56 million miles, though it’s hard to be sure. The circumference of the world is an around 24,900 miles. Our electricity transmission lines can g o around our world 2,250 times over. So it’s big — very big. It’s also in an awful lot of trouble. ……So next time someone from the Green Party or government tells you that the energy transition is cost-free, ignore them. It most definitely is not. You can’t double the size of the biggest thing in the world for nothing.” Emphasis on the last line by me.

However, because the IRA codifies the “Green New Deal” we cannot exactly ignore government as we watch them destroy the largest machine ever built. I wrote about the Great State of Hawaii a few years ago. Hawaii adopted the “Green New Deal” several years before Congress passed the IRA. Unlike California or other states, Hawaii is an “Energy Island”. Therefore, the consequences of the Green New Deal are experienced faster. Take a look at what I wrote a few years ago and check the current electricity costs in Hawaii. Also, an update here.(53) Then you decide how inexpensive renewables are. (52)

Conclusions

Replacing the energy of 100 Quadrillion BTUs with wind and solar is impossible. The foregoing described the immensity of petroleum use and the electric grid. Also, the Lawrence Livermore Laboratory, Sankey Diagrams show energy flows for the years 2011 and 2022. In the 2022 LLNL diagram, wind and solar provide less than 6% of the primary energy used. This meager, less than 6% contribution of intermittent power is after decades of subsidies.

All fuels, including coal should be included in America’s energy mix. Why? For many reasons, here are four; 1. The U.S. is the Saudi Arabia of coal and we have more high quality fuel within our borders than any other country, 2. A 60 day coal pile on the plant site is the best proven energy storage known, 3. Coal plants provide Dispatchable Bulk Power and can run 24/7 300 plus days per year and 4. Coal generated power is affordable. Just check the electricity prices of states that generate most of their power from coal and compare to the electricity rates in Hawaii and California.(57)

My concern is that we have not built a new clean coal plant since 2013 and the U.S. manufacturing supply chain is threatened. Not only manufacturing facilities, but also including skilled engineers, technicians and welders. The recent history of the decline of the supply-chain for nuclear power plants is an example. In the 1970’s, America had the largest and best manufacturing supply chain for nuclear power plants. Over a period of about 40 years America built nuclear power production capability for about 20% of America’s total electricity production. 1949-1989) Most of the manufacturing that built the robust, reliable and safe nuclear fleet are gone. We should not let this happen to the supply chain for clean coal plants. Remember the names Combustion-Engineering, Westinghouse, Allis-Chalmers, DeLaval, Foster-Wheeler and more…? Thankfully, we still have Babcock & Wilcox, but much downsized from when I worked at B&W in the 1960’s. I wrote on this blog about the Rise and Fall of Nations from the perspective of nuclear power systems manufacturing and some photos of U.S. Reactor and steam generator manufacturing from the 1960’s are included. We can “Hope” for sanity in public education and government Regulations so that some day American manufacturing will be great again. (54)

Energy policy in the U.S. as one well respected energy issues publication author stated, “American Energy Policy is a Mess”.

Worse yet, the average voter has been indoctrinated with misinformation that the Climate has been altered by the burning of fossil fuels and the future of the earth is in peril because of combustion of fossil fuels. The largest scientific hoax in the history of mankind.

Respectfully,

Dick Storm, July 2, 2024

References and for Further Reading & Research

  1. Smithsonian, “The Largest Machine Ever Built, the U.S. Electric Grid” https://www.smithsonianmag.com/videos/category/history/the-largest-machine-ever-built/
  2. Lee Raymond at meeting of Council of Foreign Affairs, 2007 on you tube: https://www.youtube.com/watch?v=KYRH97e-nlM
  3. EIA Gasoline consumption in 2022, about 135.7 Billion gallons: https://www.eia.gov/energyexplained/gasoline/use-of-gasoline.php
  4. EIA Diesel Fuel Explained, U.S. Production of Diesel Fuel 2022 about 1.75 Billion barrels (73.5 Billion gallons): https://www.eia.gov/energyexplained/diesel-fuel/where-our-diesel-comes-from.php#:~:text=In%202022%2C%20U.S.%20refineries%20produced,barrels%20(60.30%20billion%20gallons).
  5. Dick Storm Blog post, Net-Zero is Impossible: https://dickstormprobizblog.org/2023/01/12/what-would-it-take-for-net-zero-electricity-generation-by-2050/
  6. Dick Storm Blog post, Energy and Economic prosperity:
  7. Dick Storm Blog post, The Rise, Fall and Rise Again of Nations and the relationship of adequate, affordable and reliable energy: https://dickstormprobizblog.org/2023/08/15/the-rise-fall-and-rise-again-of-nations-and-the-realities-of-energy/
  8. Dick Storm Blog post, Comparison of China and U.S. Energy use: https://dickstormprobizblog.org/2023/01/18/comparison-of-china-energy-electricity-generation-with-u-s-a/
  9. Dick Storm Blog post, Pillars of Energy and Materials for Modern Civilization: https://dickstormprobizblog.org/2022/07/25/pillars-of-modern-civilization-all-dependent-on-energy/  
  10. Dick Storm Blog post, Energy and Economic Prosperity : https://dickstormprobizblog.org/2022/01/03/energy-and-economic-prosperity/
  11. Dick Storm blog, Energy, Human Development Index and Economic Prosperity, How it came to be: https://dickstormprobizblog.org/2021/06/22/energy-human-development-index-and-economic-prosperity/
  12. Dick Storm Blog, 100 Quadrillion BTUs=American Dream, July 2022: https://dickstormprobizblog.org/2022/07/04/american-dream-100-quadrillion-btus/
  13. Dick Storm Blog, The Importance of Fuel Diversity to Power our Lives and Economy Part 1: https://dickstormprobizblog.org/2023/10/26/the-importance-of-fuel-diversity-to-power-our-economy-and-our-lives-part-1/
  14. Dick Storm presentation to Cabarrus Rotary Club, Dec. 7, 2023, The Hard Truths of Energy and Electricity” and “Panamax Post, Scoop.it” : https://www.scoop.it/topic/panamaxpost/p/4149909913/2023/12/29/richard-storm-on-linkedin-facing-the-hard-truths-of-energy-electricity-generation
  15. Bloomberg, Oct. 2014, The American Electric Grid, the Largest Machine in the World”: https://www.bloomberg.com/view/quicktake/u-s-electrical-grid
  16. Yahoo Finance, “Greasing the World’s Largest Machine, the Electric Grid, by Sonia Aggarwal, Sept. 2014 : https://finance.yahoo.com/news/greasing-electric-grid-worlds-largest-machine-op-ed-150237367.html  
  17. EIA Fuel for electricity generation 60% fossil fuels, 19.7% coal, 39.9% natural gas, 21.3% renewables and 18.2% nuclear: https://www.eia.gov/tools/faqs/faq.php?id=427&t=3
  18. China Coal Consumption by “WorldOMeter”: https://www.worldometers.info/coal/china-coal/
  19. Marine Digital, list of 12 largest tanker Ships: https://marine-digital.com/article_top_12_largest_tanker_ships
  20. Count on Coal Blog, “2024 A Critical Year of Grid Reliability”: https://www.countoncoal.org/2024/01/a-critical-year-for-grid-reliability/
  21. Bloomberg on the Demise of Gas Pipelines & Difficulty of Building new ones, July 2020: https://www.bloomberg.com/news/articles/2020-07-06/demise-of-gas-project-shows-u-s-pipelines-becoming-unbuildable?embedded-checkout=true
  22. IEA Energy Report 2022: https://www.iea.org/reports/coal-2023/demand
  23. Energy Bad Boys, Substack on EPA forcing 5.2 million into Blackouts, May 25, 2024: https://energybadboys.substack.com/p/52-million-americans-will-be-left
  24. German De-Industrialization post on the “Last Pipe” from Vallourec Factory: https://www.linkedin.com/posts/activity-7112422447580082176-MMm3?utm_source=share&utm_medium=member_desktop
  25. China’s leader states the importance of oil and coal for prosperity: https://www.linkedin.com/posts/activity-7112059501003829248-5b4Y?utm_source=share&utm_medium=member_desktop
  26. FERC Summer Assessment, May 2024: https://www.ferc.gov/news-events/news/report-2024-summer-energy-market-and-electric-reliability-assessment?utm_source=www.gridbrief.com&utm_medium=newsletter&utm_campaign=data-center-overload-critical-mineral-supply-energy-grids-in-modern-warfare
  27. Grid Brief, May 27, 2024, Data Center to Contribute to 2.7% Electricity Growth: https://www.gridbrief.com/p/data-center-overload-critical-mineral-supply-energy-grids-modern-warfare?utm_source=www.gridbrief.com&utm_medium=newsletter&utm_campaign=data-center-overload-critical-mineral-supply-energy-grids-in-modern-warfare
  28. Capital Research Center on Palestinian Protesters becoming more active in acts of Terror within the U.S. A sobering reminder of the vulnerability of our Grid : https://capitalresearch.org/article/chicago-campus-protestors-announce-terror-campain-against-the-us/?blm_aid=59207
  29. Global Energy Monitor, Tracker for LNG and Gas Pipelines: https://globalenergymonitor.org/projects/glhttps://globalenergymonitor.org/projects/global-gas-infrastructure-tracker/tracker/obal-gas-infrastructure-tracker/tracker/
  30. Global Energy Monitor, Coal Plant Tracker: https://globalenergymonitor.org/projects/global-coal-plant-tracker/dashboard/
  31. EIA Natural Gas Prices, from 2019 to March 2024: https://www.eia.gov/todayinenergy/detail.php?id=62203&src=email
  32. WUWT on Wind and Solar becoming less viable, June 7, 2024 Master Resource: https://wattsupwiththat.com/2024/06/07/industrial-wind-power-a-depleting-resource/
  33. Rise and Fall of the U.S. Grid, by Emmett Penney, Foreign Affairs Magazine: https://americanaffairsjournal.org/2022/08/the-rise-and-fall-of-the-american-electrical-grid/?utm_source=substack&utm_medium=email
  34. Lars Shernikau, An outstanding article on the importance of conventional Primary Energy! “Primary Energy is Still King” :  https://unpopular-truth.com/2024/05/24/why-primary-energy-is-still-king/  
  35. DOE-Pathways to Advanced Nuclear Power, June 2024: https://liftoff.energy.gov/advanced-nuclear/
  36. Our World in Data, Renewable Energy in the World, Charts : https://ourworldindata.org/renewable-energy  
  37. Thomas Shepstone Substack on “What about Coal?” June 20, 2024: https://energysecurityfreedom.substack.com/p/what-about-coal
  38. ENERGY INSTITUTE 2024 WORLD ENERGY REPORT, Statistical Review, JUNE 2024: https://www.energyinst.org/statistical-review
  39. Our World in Data, World Primary Energy Use: https://ourworldindata.org/energy-production-consumption
  40. The Liberal Patriot on the EU Elections, June 2024: https://www.liberalpatriot.com/p/greenlash-is-here
  41. Isaac Orr Presentation to Dairyland Power on the impact of EPA Regulations, June 22, 2024: https://energybadboys.substack.com/p/nine-slides-from-my-keynote-address
  42. Indulgences of the 20th Century, K.T. Lynn on “REC’s”, June 14, 2024: https://thejoulethief.substack.com/p/get-rec-ked
  43. Climate change and the politicization of ESG in the US,  ESG Investing: https://www.frontiersin.org/journals/political-science/articles/10.3389/fpos.2024.1332399/full  
  44. Gregory Whitestone on You Tube, Climate Fears Debunked: https://www.youtube.com/watch?v=TcibOFk_ZdU
  45. LLNL Primary Energy Flow Chart, 2022 for U.S.: https://flowcharts.llnl.gov/sites/flowcharts/files/2023-10/US%20Energy%202022.pdf
  46. IEA Pathways to Net Zero, Oct. 2023: https://www.iea.org/reports/world-energy-outlook-2023/pathways-for-the-energy-mix
  47. Our World in Data, Per Capita Energy Use charts: https://ourworldindata.org/energy-mix
  48. Robert Hargraves article in Grid Brief, Nov. 2022, “Energy IS the Economy”: https://www.gridbrief.com/p/guest-feature-energy-economy
  49. Ron Stein article, Feb. 2024 in “Your AmericaTV”, entitled, “Are Politicians Oblivious to the Need for Crude Oil, or Are They Intentionally Sending Us Back to the 18th Century?” : https://youramericatv.com/2024/02/are-policymakers-oblivious-to-the-importance-of-crude-oil-or-are-they-intentionally-sending-us-back-to-the-18th-century/
  50. POWER Magazine Commentary by Michelle Bloodworth of America’s Power, “EPA No Win Rule for the Electricity Grid” July 2, 2024: https://www.powermag.com/blog/epas-no-win-rule-for-the-electricity-grid/?oly_enc_id=3214I3524889A9B
  51. Texas and Coal Power,  6,000 MW of Coal Power Generation is Missed, Feb. 19, 2021: https://dickstormprobizblog.org/2021/02/19/texas-and-coal-power-6000-mws-of-coal-plant-capacity-is-missed/
  52. Hawaii, Green New Deal, A Glimpse into the Future, June 3, 2020: https://dickstormprobizblog.org/2020/06/03/hawaii-a-gimpse-into-the-future-of-the-green-new-deal/
  53. Update on Hawaii’s “Green New Deal” March 2024: https://dickstormprobizblog.org/2024/03/20/hawaii-a-glimpse-into-the-future-of-the-green-new-deal-aka-inflation-reduction-act-here-is-an-update/
  54. The Rise and Fall of Nations from the perspective of nuclear power systems manufacturing: https://dickstormprobizblog.org/2023/08/15/the-rise-fall-and-rise-again-of-nations-and-the-realities-of-energy/
  55. Thomas J. Shepstone posting on Substack of,  “Energy Matters If You Value the Life You Now Have and Don’t Want to Live Under Socialism
     March 11, 2024: https://open.substack.com/pub/energysecurityfreedom/p/energy-matters-if-you-value-the-life?r=kv1a9&utm_campaign=post&utm_medium=email  
  56. Threats to the Electric Grid, March 15, 2024:  https://dickstormprobizblog.org/2024/03/15/threats-to-the-grid-electricity-reliability/
  57. U.S. Electricity Prices by EnergyBot.com: https://www.energybot.com/electricity-rates/
  58. Richard Nielsen on Substack, “What is Energy” Mr. Nielsen shares my concern for informing the public on the true facts of energy and electricity generation: https://open.substack.com/pub/richardnielsen/p/what-is-energy-84e?r=kv1a9&utm_campaign=post&utm_medium=web
  59. Bloomberg, July 25, 2024 “Climate Crisis Old King Coal Remains Omnipotent and Omnipresent” Still Powering the World”: https://www.bloomberg.com/opinion/articles/2024-07-25/climate-crisis-old-king-coal-remains-omnipotent-and-omnipresent?utm_source=website&utm_medium=share&utm_campaign=linkedin?sref=5dj0X2VO
  60. IEA Coal Report, July 2024: https://www.iea.org/news/global-coal-demand-is-set-to-remain-broadly-flat-through-2025

Facing the Hard Truths of Energy, Part 1: 79 Quadrillion Btus:The Enormity of the Fossil Energy Systems Providing Sustainable Lives

Conventional energy is vitally important for all that we do. Missing from news reports to the general public is an honest communication to try to explain the huge and enormous energy systems that we depend on each day and the impossibility of replacing conventional energy with wind and solar. To start 2024, I thought I would post a series on the Hard Truths of Energy. I borrowed the title from the 2007 National Petroleum Council report, led by Chairman, Lee Raymond, retired CEO of ExxonMobil. Petroleum, natural gas and coal were important in 2007 and they remain important today. The “Energy Density” of fossil fuels makes them indispensable to sustain our economy and our high quality of life.(4)

Fossil Fuels Provide 79% of U.S. Primary Energy

79 Quadrillion BTUs is the amount of energy we depend on from fossil fuels. This is my attempt to try to explain and illustrate what 79 Quadrillion BTUs of energy looks like. The number 79 Quadrillion is from the Department of Energy’s Lawrence Livermore Laboratory for energy use in 2022.(2) Below is a short summary of the amount of natural gas, petroleum and coal that we used in the U.S.A. in 2022.

How Huge is a Quadrillion?

I have discussed the steady U.S. energy demand of 100 Quadrillion BTUs per annum for decades and yes, 100 Quadrillion BTUs is the amount of energy we use each year and it has been steady for over 20 years.(6) Until now, I did not take the time to explain the enormity of a Quadrillion BTUs. Here is what one Quadrillion BTUs of energy is equivalent to:

Coal= About 50 million tons of coal. This would be a coal pile that would be one mile wide, ten feet high and 3.3 miles long.

Oil= 7.14 Billion gallons. See Lee Raymond quote below on the quantity of motor fuels used in the U.S. in a year

Natural Gas= 1 Trillion cubic feet. This is equivalent to 200 aircraft carrier sized LNG Tankers. More on the enormity of an LNG ship below.

It is a fact, in America, we use and need about 100 Quadrillion BTUs of energy each year.

36 Quadrillion BTUs of Petroleum

The single largest form of energy that we depend on is petroleum. About 20 million barrels per day. To visualize what 20 million barrels per day would look like, take a look at the photo of me and the 48″ Alyeska pipeline in Alaska. At its peak flow, about 2 million barrels per day flowed through the Alaska pipeline. So, to visualize 20 million barrels per day, picture in your mind, ten of these 48″ pipelines installed side by side.

The Alaska pipeline. Capacity about 2 million barrels per day. This is to help visualize what 20 million barrels per day would look like. Picture ten of these side by side. This is the enormity of the petroleum needed to supply America
Photo credit, Dick Storm circa 2007

Another illustration was offered by Lee Raymond, retired CEO of ExxonMobil when introducing the National Petroleum Council report “Facing the Hard Truths of Energy” in 2007. This explanation is offered by Mr. Raymond on You Tube, here. Mr. Raymond explained that the amount of motor fuels used in 2006 was about 150 Billion gallons. He then went on to state that if each gallon was placed in a one gallon tin can as he used in his youth to fill his lawnmower, the length of 10″ high cans, if placed end to end would circle the earth 1,000 times. That is the enormity of 150 Billion gallons of motor fuel. Mr. Raymond stated, (among other important points), To replace current energy systems it will take a an enormous effort and a long period of Time.”(5)

The gasoline and Diesel motor fuels used in the U.S. has increased from the 150 Billion gallons consumed in 2007, to about 209 Billion gallons in 2022.

33 Quadrillion BTUs of Natural Gas

America used 33.4 Quadrillion BTUs of natural gas during 2022. Most of the natural gas used by the U.S. is distributed by a vast network of unseen, underground pipelines. Therefore, hard to visualize. So, let’s imagine that if we were to use all of our natural gas from shipments of LNG, (Liquified Natural Gas) how many huge LNG Super Tankers would it take? Such as the vessel Pan American shown below:

Pan American Specs: https://www.balticshipping.com/vessel/imo/9750232

This LNG tanker holds 174,000 cubic feet of liquified natural gas. LNG is 1/600th the volume of the gaseous state. The ship is over 977 feet long and the gross tonnage is 114,966. This is a ship about the size of a U.S. Navy aircraft carrier. The energy equivalent of the cargo is about 6 trillion BTUs.

Now, imagine 6,600 ships like the Pan American above all lined up along the east coast. If the ships were placed touching, end to end, this would be about 1,220 miles of ships from New York City to south of Miami, Florida. That is the number of aircraft carrier sized LNG tankers that it would take to provide 33 Quadrillion BTUs of natural gas fuel. The 33 Quadrillion number is from 2022, the actual demand. The future will likely require more than 33.4 Quadrillion BTUs.

10 Quadrillion BTUs of Coal Power

Coal power has been important to the U.S. since the days of Thomas Edison, Nikola Tesla and George Westinghouse. The American electric system, referred to as the “Grid” was built on the foundation of reliable, affordable, domestically supplied and environmentally clean steam power generation fueled by coal. This took over 125 years to build and has been described by the Smithsonian as, “The Largest Machine Ever Built”. Video here. As recent as 2011 about 50% of America’s electricity was produced by steam turbines with steam generation from coal fuel. In 2022 the coal powered electricity generation dropped to about 20%. Much of the total electricity generation which was once powered by coal fuel, has been switched to natural gas fuel. 

As recent as 2011 America used about a billion tons of coal. In 2022 coal use declined by about 50% to about 512,000 million tons. Coal is important because of it’s enormous energy density. Another important fact, is that weeks and months of primary energy can be safely stored on site. Coal provides Dispatchable power and it is proven to be affordable. America has the largest coal reserves of any country. The U.S. is the Saudi Arabia of coal.

How much coal is 512,000 million tons? This is enough coal to fill about 5,000,000 coal cars such as the one shown below.

https://www.bnsf.com/ship-with-bnsf/ways-of-shipping/equipment/coal-cars.html

How long would a single train of 512,000,000 tons of coal be? About 50,000 miles, long enough to circle the earth two times at the equator.

Conclusions

The so-called energy transition from conventional to wind and solar is simply not possible with today’s technology. As Mr. Raymond stated in 2007, changing from our conventional energy systems to something else is an enormous effort that will take. a long time.

Net-Zero Carbon by 2050 is impossible. A previous blog post is here.

The largest energy density and provider of the greatest quantity of carbon-free energy is nuclear power. However, replacing the existing electric generation with nuclear will take decades to accomplish and massive roll back of Federal Regulations. It took about 40 years to develop, manufacture, construct and perfect the 93 operating commercial nuclear units in 54 plants. These currently provide about 20% of America’s electricity. Most of these are now over 30 years old and the last two units built by Southern Company (2,200MW capacity) took over ten years to build. A previous blog post discusses “Without New Thinking on Nuclear Power, Net Zero Carbon is Impossible”, here.

Electrifying Everything is not possible, even electrifying transportation is not practical for every vehicle and if they were, much more electricity would be required.

The so-called energy transition from conventional forms of energy to wind and solar is impossible and attempting to do so by forced laws (such as the IRA), increased Regulations and the continuing war on carbon will destroy our country.

It is my hope and prayer that after the next election some sanity to energy policy will return.

Yours very truly,

Dick Storm, January 11, 2024

References

  1. LNG Shipping Newsletter, 2015 by Riviera: https://www.rivieramm.com/opinion/opinion/lng-shipping-by-numbers-36027
  2. LLNL Energy Flow Diagram: https://flowcharts.llnl.gov
  3. EIA Coal fuel used in 2022, Nov. 2023: https://www.eia.gov/todayinenergy/detail.php?id=61022
  4. 2007 National Petroleum Council report: “Facing the Hard Truths of Energy”: https://npchardtruthsreport.org
  5. Lee Raymond video at Council of Foreign Relations meeting in 2007: https://www.youtube.com/watch?v=KYRH97e-nlM
  6. Dick Storm Blog, “America Needs 100 Quadrillion BTUs of Primary Energy each Year” March 2023: https://dickstormprobizblog.org/2023/05/16/back-to-basics-the-u-s-needs-100-quadrillion-btus-year-of-primary-energy/
  7. The Smithsonian Magazine, “The U.S. Electric Grid, The Largest Machine Ever Built”, you tube : https://www.smithsonianmag.com/videos/category/history/the-largest-machine-ever-built/
  8. Dick Storm Blog, “What Would it Take to Achieve Net-Zero Carbon by 2050” https://dickstormprobizblog.org/2023/01/12/what-would-it-take-for-net-zero-electricity-generation-by-2050/
  9. EIA Nuclear Plants in the U.S. : https://www.eia.gov/tools/faqs/faq.php?id=207&t=21
  10. Dick Storm Blog, Oct. 2021 “The War on Carbon and How it Came to Be” : https://dickstormprobizblog.org/2021/10/16/the-war-on-carbon-how-it-came-to-be/

The Importance of Fuel Diversity to Power Our Economy and Our Lives, Part 1

Much has been written on the importance of energy to power a nation’s economy and to continue to provide a high quality Human Development Index. The purpose of this post is to focus on the importance of Fuel Diversity for electricity generation. There is a proven concept for energy storage for electricity generation. It is coal fueled power plants with a 30-60 day supply of coal in a pile, on site. This is proven to be reliable, low cost and safe.

Energy powers everything we do!

Think about this. You are probably reading this on a computer screen. Have a warm cup of coffee nearby and are sitting in an air conditioned office or home. Your car is sitting outside and at your urging is ready to provide transportation. You get the point. Remember the last hurricane or severe winter storm that killed power for a day or so? Loss of energy sources or electricity is debilitating. Think about the 1970’s Oil Embargoes. If you are too young to remember 1973-1979 check these references, here and here.

Primary Energy Sources-Back to Basics

Lets discuss energy and electricity and the sources and quantity of everyday energy that we depend on.

America has used right at 100 Quadrillion Btus of PRIMARY energy per annum since about the year 2000.

The energy we use is compiled by various government agencies in BTUs equivalent (British Thermal Units). A BTU is enough heat to raise one pound of water one degree Fahrenheit, just as a reminder of High School Physics. Each BTU converted to work is equivalent (at 100% efficiency) to 778 Foot Pounds. Therefore, the energy production and consumption is converted to BTUs so that all forms of energy can be reported on a like basis. I wrote an article on the basics of energy for Middle School students here if you are interested, also on “Demystifying Energy and Electricity” here.

This article is about fuel diversity. Just as I explained above regarding the reporting of energy in BTUs to have a common measurement of energy quantities, in some cases one fuel can be substituted for another, especially in electric power generation. Thermal Power Generation Plants that generate Bulk Power can be provided with natural gas, coal, oil, Biomass or nuclear energy to produce steam to drive a steam turbine generator. The fuel selected is done for reasons of economic or fuel availability. Hawaii is truly an Energy Island and thus cannot interconnect with the lower 48 states. Fuels for Thermal Power Generation needs to be imported. In fact, I wrote on Hawaii’s electricity generation in 2020, here.

The proportions of each form of energy used and depended on to power our lives has changed as technologies for extraction and production have improved. For example for electric power generation coal fuel was consumed for about 50% of power generation in year 2000. Then due to the Shale Revolution of Hydraulic Fracturing and Directional Drilling, natural gas became less expensive than coal on a $/million BTU basis. See my review of Harold Hamm’s book, Game Changer which covers the Shale Gas Revolution, here. Thus, gas was substituted for coal generation by many utilities that could get it. Alaska and Hawaii of course do not have pipelines to connect, but of many utilities in the lower 48 states, gas was an economical and clean fuel of choice.

Coal fuel in the U.S. today provides about 23 % of the primary energy to produce Bulk Electric Power over the year. The substitution of coal fuel as primary energy is natural gas which has become more economical as a result of the Shale gas revolution which took off about 2012. Electricity is SECONDARY Energy and must be produced from Primary energy. Electricity is important and in 2022 electricity consumed about a third (37.7% to be exact) of the total PRIMARY energy used in the U.S. The best factual illustration that I am aware, of the sources and consumption of primary energy is the LLNL Energy Flow Diagram, shown below. This is one of my favorite graphics and it is prepared each year by the Department of Energy. The chart above shows the total primary energy used since 1950 and thus supports my conclusion that America needs right at 100 Quads per year to sustain our quality of life, economy and industrial production.

Lawrence Livermore Laboratory Sankey Diagram of U.S. Energy Flows, 2022

The total Primary Energy used by the U.S. from coal fuel in 2022 was about 10% of the total. (9.91% from data above). That doesn’t seem like much does it? Remember, this is primary energy I am talking about. So, although coal only provided about 10% of our total primary energy it was in fact, Dispatchable, affordable and it provided electricity generation when solar and wind were not available. The chart below is of MISO generation by fuel this past summer. This example shows 40% of total power generation in MISO from coal at this moment in time.

The topic of this article is “The Importance of Fuel Diversity”. The example above of summer Bulk Power Generation depending on coal fueled power generation units is just one of many reasons America should keep our Fuel Diversity. Another example of the importance of coal plants and the consequences of shutting them down is discussed in my blog post discussing the February 2021 Texas Blackout that killed over 200 people. Here.

My previous post on De-Mystifying Energy attempted to explain this, here. The difference between Primary and Secondary Energy is important. If everything is Electrified as many suggest we should do, has anyone really thought through where the primary energy to do so is to be sourced? In my opinion, it has not. Wind and solar cannot replace the primary energy currently required. The four charts shown up to here should make that clear.

Government policy and many people in the general public believe that renewables can replace fossil fuels and nuclear. The harsh reality is that after decades of government subsidies & tax credits wind and solar provide less than 6% of our total PRIMARY energy. Here below is the LLNL Energy Flow Diagram from 2021 with the 4.96% wind and solar contribution circled.

Public demonization of all conventional fuels including nuclear, coal, gas, gasoline, Diesel are unAmerican and foolish. Wind and solar only provide single digits of the total Primary energy needed to power our lives and it will be impossible to ramp wind & solar renewables up to 100% of our energy needs. The charts above are from the government statistics as published on the Lawrence Livermore National Laboratory Sankey Diagram website, an excellent resource.

Back to Fuel Diversity

Each American citizen, on average is accustomed to using about 315 million Btus of energy per year. I have written separate articles on American energy use here and here. My first point is that we all need on average of about 863,000 to 1 million Btus each day in Total Primary Energy. This number is provided by dividing 330 million citizens into 100 Quadrillion Btus and then dividing that by 365 days/year = 863,000 BTUs per day/citizen of PRIMARY Energy. This is for all uses which (see LLNL chart above) including: Electricity generation, Transportation, Industrial Production, Commercial and Residential uses. The second important point is that providing this energy each day may be from various forms of energy. Depending on which is more efficient or more economical. Let’s take an example of electric generation on July 21, 2023 in the Midwest at about 2:00 PM in the afternoon (example above). It was more economical to use coal fuel for 40% of the electricity generation at that hour. It may have been, I do not know for sure, that only coal generation could deliver the electricity Demand at that moment. The fact is, coal delivered 40% of the electricity at that moment.

Let’s take another example from last winter. This example below is from Christmas week, 2022.

Fuel Diversity with more coal plants ready to operate and properly maintained could have avoided the Blackouts of Christmas week, 2022. Duke Energy has shut down many coal plants as part of their Net-Zero Carbon plan. So have many other Utilities, both Public and Investor Owned. I presented my views on this at the ENERUM (Columbus Ohio Energy Forum) in August 2022. My presentation is Here. Also, my recent article on the self sabotaging of our energy and electricity generation Grid is here.

Even well respected utilities that were once known for their outstanding leadership and engineering excellence are planning to shut more of their coal plants down in the near future. This works against Fuel Diversity! Here below is a screen print excerpt of the Duke Energy IRP for 2023:

These planned shut downs are in spite of the winter 2022 rolling Blackouts described above. Why? Because the N.C. politicians and top Duke management have agreed to follow a disastrous Net-Zero Carbon path. So has the S.C. Legislature and Santee-Cooper. I wrote about Santee-Cooper in an earlier article, here.

Energy Storage

My first instructor on electricity generation was in class in 1959. The instructor, Harry Park stated, “Electricity needs to be generated the instant that it is needed”. That stuck with me my entire career. Today intermittent renewables are the rage and of course, as Mr. Park stated in 1959, electricity needs to be generated or provided from storage the instant it is needed. That is what built America’s Grid and America’s strong economy. Reliable, affordable electricity available the instant it is needed or in today’s word, Demanded. The published articles I see regarding the justification of higher and higher percentages of wind and solar generation are dependent on electricity storage. The best and largest Bulk Power Storage systems today are “Pumped Storage Hydro”. Such as Duke Energy’s Bad Creek or TVA’s Raccoon Mountain. These work well where the local topography allows it. Bad Creek has about 1,200 ft of elevation change between the upper and lower reservoirs(21). Bad Creek is currently, according to N.C. Business Journal, being uprated to about 2,800 MW. TVA’s Raccoon Mountain provides 1,650 MW of storage. Two other alternatives for storage are batteries and hydrogen. The largest battery electric storage system (BESS) that I am aware is in California. This is at Moss Landing Plant in California. It is being uprated to 3,000 MWH. The “H” after MW means Hour. That means the electricity stored is good at the rated capacity for one hour. Enough time to start gas turbines or buy power from a neighboring utility on the grid. Hydrogen can be a source of storage too. However, it must be remembered that it takes about four times the input of electricity to produce one unit of Bulk Power from hydrogen. An excellent reference on this was published in Gas Turbine World Magazine in August 2022, Here. (22)

The most reliable, proven, safe and affordable form of Energy Storage: A large pile of coal onsite at a clean, efficient coal power plant. When I started in the power generation business in the 1960’s one of my experiences was in conducting a boiler efficiency test at a large power plant in Illinois. As I recall the explanation for the huge coal pile was, “Because of the possibility of Union walkouts at either the coal mines or the railroad, a 90 day supply of coal was required to be stored on site”. Proven, safe and affordable. The photo below is real long term energy storage. A coal pile can store enough energy for a 2,000 MW power plant to run full power for months, not hours as is currently planned for batteries.

Electricity, Transportation, Industrial Production, Commercial, Residential

These five categories of energy use are shown on the LLNL charts above. Americans with our current population of about 330 million, will need at least 100 Quads per year for the foreseeable future. If we are to sustain our quality of life and freedom to travel, we will continue to need about 100 Quads per year. This article is focussed on electricity generation and the 37% of America’s PRIMARY Energy used to generate Bulk Power. The second part of this article will cover the other 63% of our PRIMARY ENERGY.

Conclusion

It will be impossible to replace fossil fuels with wind and solar any time soon. Attempting to do so will create hardships, economic decline and a general weakness of our country including weakness of our National Security.

The best and most proven energy storage system that I have known through my entire career in power generation is a large coal pile. It was common for coal power plants to have 30 or 60 day supplies of coal storage on the plant site.

On a positive note, I wrote about the preceding 80 years the “Era of Affordable, Reliable Energy and Electricity Generation, Part 1” Here. America really did great things in making energy and electricity reliable and affordable for over 80 years. Coal plants became more efficient and clean, nuclear power came of age and America became energy independent and the largest producer of natural gas in the world. I chose 80 years because that covers my lifetime and I know the history of accomplishments during these times, because I worked in the power generation business for over 50 of those years. Experiences in design, maintenance, operations, tuning, upgrading, capacity improvements, Betterments, Heat-Rate Improvements, fuel flexibility, fouling and slagging reductions and emissions reductions of fossil power systems. I admit, I am not a policy wonk, I am a nuts and bolts power engineer. But, I have been gifted with many years of experiences and have traveled much of the world to witness the relationship of energy and economic prosperity.

The loss of legacy coal plants is threatening Bulk Power Supply Reliability by the loss of over 100,000 MW’s of reliable coal power generation capacity without replacing it in kind is wrong. I wrote on the “End of the Era of Reliable, Affordable Energy and Electricity” a couple weeks ago. It is here. The references included are from NERC, FERC and other reliable people and sources of information. I encourage the reader to check these references to decide for yourself.

Nuclear power generation is the only known technology to produce carbon dioxide free electric power. However, building a new nuclear power generation supply chain will take decades. David Archibald wrote an excellent article on “The Energy Future We Need to Have a Future Worth Having”, here. I also support nuclear for the long term, but the next 30 years are important to work through and hopefully, sustain our high quality of life until future technologies and the needed supply-chains are sufficiently developed for safe and reliable implementation. My previous blog post covered an overview of the needed new thinking (and policies) on nuclear power for carbon dioxide emissions reduction to succeed. here. (27)

Unless the current path to Net-Zero Carbon is stopped, America faces shortages of electricity, including rolling Blackouts during extreme weather. Such as the coming winter in December 2023 and January 2024. Please Wake up Americans, Your Energy and Electricity Supply is Being Self Sabotaged from Within!

Yours truly,

Dick Storm, October 25, 2023

References for further reading:

  1. Dick Storm Blog, Back to Basics, America Needs About 100 Quadrillion Btus each year: https://dickstormprobizblog.org/2023/05/16/back-to-basics-the-u-s-needs-100-quadrillion-btus-year-of-primary-energy/
  2. Lawrence Livermore National Laboratory Energy Flow Diagram for year 2022: https://flowcharts.llnl.gov
  3. Dick Storm Blog, “The American Dream=100 Quadrillion Btus of Energy: https://dickstormprobizblog.org/2022/07/04/american-dream-100-quadrillion-btus/
  4. WFAE News Article on, “How Duke’s Power Failures Came to Be From Lack of Reserves over Christmas Eve, 2022: https://www.wfae.org/energy-environment/2023-01-12/how-a-lack-of-power-for-sale-led-to-duke-energys-christmas-eve-blackouts
  5. Dick Storm ENERUM, August 2022 presentation: https://www.linkedin.com/posts/richard-storm-00557810_presentation-and-speakers-notes-from-august-activity-7068650158862827520-B-_W?utm_source=share&utm_medium=member_desktophttps://www.linkedin.com/feed/update/urn:li:activity:7056884647858765824?updateEntityUrn=urn%3Ali%3Afs_feedUpdate%3A%28V2%2Curn%3Ali%3Aactivity%3A7056884647858765824%29
  6. Dick Storm Blog post, “Mentoring of Middle School Students on the basics of energy and electricity”: https://dickstormprobizblog.org/2022/03/09/mentoring-the-middle-school-students/
  7. Dick Storm Blog post on Rotary presentation, “Demystifying Energy and Electric Power Generation”: https://dickstormprobizblog.org/2022/11/17/demystifying-the-importance-of-energy-and-electric-power/
  8. Dick Storm Blog, “Hawaii-A Glimpse Into the Future of the Green New Deal” : https://dickstormprobizblog.org/2020/06/03/hawaii-a-gimpse-into-the-future-of-the-green-new-deal/
  9. Harold Hamm’s book, “Game Changer” which chronicles the history of Hydraulic Fracturing, Directional Drilling and the Shale Gas Revolution: Dick Storm review: https://dickstormprobizblog.org/2023/09/17/harold-hamms-book-game-changer-a-must-read-for-elected-officials-and-candidates-for-elective-office/
  10. Dick Storm Blog post, “The End of the Era of Abundant, Affordable Energy and Electricity” Thanks to misguided government Regulations: https://dickstormprobizblog.org/2023/10/12/the-end-of-the-era-of-reliable-abundant-and-affordable-energy-and-electricity-part-ii/
  11. Dick Storm Blog, “How Can a 6,000 MW Utility Which Likely will be a 9,000 MW Utility in 2050, Achieve Net-Zero Carbon?” ; https://dickstormprobizblog.org/2023/04/27/how-can-a-6000-mw-regional-utility-in-2030-which-likely-will-be-a-9000-mw-utility-in-2050-achieve-net-zero-carbon/
  12. The Green Transition is “Social Vandalism” WUWT, Oct. 3, 2023:  https://wattsupwiththat.com/2023/10/03/the-energy-transition-is-social-vandalism/
  13. America’s Power Coal Facts: https://americaspower.org/COAL-FACTS/
  14. NERC 200-2023 Winter Assessment: https://www.nerc.com/pa/RAPA/ra/Reliability%20Assessments%20DL/NERC_WRA_2022.pdf  
  15. CO2 Coalition, “Fear the Cold”, Cold is Bad for Humanity, October 24, 2023: https://myemail.constantcontact.com/Fear-the-Cold.html?soid=1101509381788&aid=TJ7nY5OPc1A
  16. Dick Storm Blog, “Green Energy Crisis, Part3”: https://dickstormprobizblog.org/2023/06/26/green-energy-crisis-part-3-public-energy-education-is-needed-each-person-in-the-u-s-uses-about-315-million-btus-of-primary-energy-year-this-is-not-practical-or-even-possible-to-replace-with-win/
  17. 1973 Oil Embargo, History by the Boston Federal Reserve: https://www.federalreservehistory.org/essays/oil-shock-of-1973-74
  18. The Arab Oil Embargo, 40 Years Later, by Center for Strategic International Studies, 2013: https://www.csis.org/analysis/arab-oil-embargo-40-years-later
  19. WUWT, David Archibald, “The Energy We Need For A Future Worth Having” , Oct. 25, 2023: https://wattsupwiththat.com/2023/10/25/the-energy-future-we-need-to-have-a-future-worth-having/
  20. NC Business Journal article on Duke’s Bad Creek Power Plant Size Doubling to 2,800 MW: https://www.bizjournals.com/charlotte/news/2022/03/01/duke-energy-eyes-doubling-pumped-hydro-project.html
  21. Duke Energy Illumination article on Bad Creek Hydro Plant: https://illumination.duke-energy.com/articles/the-marvel-inside-the-mountain-4608936#:~:text=Because%20about%201%2C200%20feet%20separate,gravity%20to%20produce%20more%20electricity.
  22. Gas Turbine World Magazine, “The Green Hydrogen Numbers Just Do Not Add Up”, August 2022: https://gasturbineworld.com/gas-turbines-burning-green-hydrogen/
  23. Dick Storm Blog, “The End of Reliable, Affordable Energy and Electricity” Oct. 12, 2023: https://dickstormprobizblog.org/2023/10/12/the-end-of-the-era-of-reliable-abundant-and-affordable-energy-and-electricity-part-ii/
  24. Dick Storm Blog, “The Era of Reliable, Affordable Energy and Electricity Generation, Part 1” : https://dickstormprobizblog.org/2023/10/04/the-era-of-reliable-affordable-energy-and-electricity-generation-part-1/
  25. Dick Storm Blog on “Texas Missing 6,000 MW of Coal Generation during the February 2021 Blackout”: https://dickstormprobizblog.org/2021/02/19/texas-and-coal-power-6000-mws-of-coal-plant-capacity-is-missed/
  26. Dick Storm Blog, “Wake Up Americans, Your Energy and Electricity Supply is Being Self-Sabotaged”: https://dickstormprobizblog.org/2023/09/20/please-wake-up-america-your-energy-and-electricity-generation-reliability-are-at-risk/
  27. Dick Storm Blog, “Without New Thinking on Nuclear Power, Net-Zero Carbon Cannot Succeed”: https://dickstormprobizblog.org/2021/11/13/without-new-thinking-on-nuclear-power-anti-carbon-climate-policy-cant-succeed/
  28. FERC-NERC Report on Winter Reliability Lessons from winter storm Elliott: https://www.ferc.gov/news-events/news/ferc-nerc-release-final-report-lessons-winter-storm-elliott

Back to Basics: The U.S. Needs 100 Quadrillion Btus/year of Primary Energy

Each citizen needs about 315 million Btus of energy to sustain our freedom of travel and way of life

Introduction

Yesterday I was a guest speaker at the “Money Talks Club” gathering in Sun City. I presented my views of Net Zero Carbon and was impressed with the interest and understanding of energy and electricity generation by the group. A fine gathering of American Patriots and I was honored to be their guest. At the same time of my talk, Santee-Cooper published their final 2023 IRP which shows the planned shut down of the 1,150 MW Winyah coal plant and plans to replace the generation largely with solar panels. Based on my experience yesterday, I thought it would be timely to attempt to explain in as short a post as possible, the importance of energy to our lives and where this primary energy can be sourced. Hint, it is not from wind and solar.

I have lived the American Dream and wish the same for my grandchildren to do so. I also pray that the U.S. politicians will wakeup and understand the energy sources to keep America strong, productive and free.

As shown above, the majority of the energy we depend on each day is sourced from traditional forms of primary energy. To me, sustainable living means that we Americans can continue to live our good lives as we have been. Doing so requires that reasonable cost, abundant forms of energy are an absolute pre-requisite. Replacing the traditional forms of energy with wind and solar is simply not possible. Attempting to do so by, shutting down, “Killing the supply chain”, demolishing and abolishing reliable forms of primary energy as shown above, is self sabotaging our quality of life. It is engineering fiction to believe that wind, solar and batteries can replace the Primary Energy sources that have served us so well for my entire life-time and I have been Blessed with many good years.

The most descriptive and simplified chart to show the forms of energy we depend on and how that energy is used, is the LLNL energy flow chart. The 2021 version is shown below.

Americans have used right at 100 Quadrillion Btus of Primary energy for over 20 years. The chart from 2021 shows a total of 97.3 Quads because 2021 was after the Covid lockdowns and reduced freedom of travel and reduced industrial production as well as other factors. The fact remains that Americans still used within +/- 3% of the decades long energy consumption, about the same amount of total Primary Energy, 100 Quads.

Electricity is Secondary Energy

The understanding of Primary and Secondary Energy should be clarified. When the government or MSM promotes “Electrify Everything” they are suggesting that electricity always will be available from some unlimited and magical source to power their EV’s, trucks, cooking, HVAC, industrial production, etc. The inference is that pollution free electricity can be provided by wind and solar to replace fossil fuels by simply spending billions of taxpayer dollars in incentives and installing millions of acres of wind farms and solar panels. My point here is to remind readers that Electricity is Secondary Energy. It must be generated using Primary energy! Batteries and hydrogen are also forms of Secondary Energy.

Let’s go back to the LLNL energy flow chart above. Note that wind and solar provided less than 5% of the total Primary energy in 2021. This is after over 30 years of incentives to force renewable wind and solar onto the Grid. Most of the other 95% Primary Energy was provided by conventional forms of energy.

How Can We Electrify Everything Without Increasing Generation From Traditional Forms of Energy?

The short answer is, we can’t. I have written other posts to explain. Donn Dears and Vaclav Smil together have written over 50 books to try to explain the importance of energy and the most likely sources for the future. I highly recommend their books to help understand the Importance of Energy and the differences between Primary and Secondary Energy..

Here is a list of the most common sources of carbon-free energy. Please refer to the LLNL Energy Flow chart above and then you decide how to replace or reduce fossil fuels by substituting those that are socially acceptable today:

Summary

I wanted to keep this post short and concise. For more details on the importance of energy in our lives, I suggest referring to other posts on my Blog and Donn Dears and Vaclav Smil’s books listed below.

The most important point of this post is to attempt to explain how keeping your quality of life depends on abundant, reasonable cost and reliable Primary Energy. Electrifying transportation and nearly everything else you use and doing so with wind and solar alone will be impossible in the near term.

Thank you for reading this.

Respectfully yours,

Dick Storm

May 16, 2023

Demystifying the Importance of Energy and Electric Power

Monday evening I was invited to the Sunset Rotary Club to provide a presentation on energy and electric power generation. I accepted the invitation because I believe it is important for the general public to understand the importance of affordable, reliable energy and electricity generation. Rotary Clubs are comprised of great civic minded people that are involved in the community. Thus, the title of the talk, “Demystifying the Importance of Energy and Electric Power” . My intention was to help the Rotarians understand the differences of Primary and Secondary Energy, Dispatchability of electricity generation and provide an overview of the sources of our energy. Here is the presentation with a short narrative of each of the slides I used to compress a two hour topic into 30 minutes:

The object of the short talk was to cover the importance of energy and to attempt to bring the facts to community leaders that care, but are not experts in or involved in energy engineering or businesses.

Rotary members are very active in the community and the world in helping the less fortunate. The first part of the meeting was members discussing helping students and those people in the community that are living in poverty. (Yes, on Hilton Head Island we have a lot of poverty) In my attempt to pique the attention of members on the plight of people living in Developing countries and the relationship of energy and economic prosperity, I used the cover of the June 2021 Rotary Magazine. This showed an example of indoor cooking of a family in Mongolia. Another photo of a woman cooking over a wood fire in Africa. Lifting people such as these from poverty can be done with the wise and careful use of fossil fuels. Such as propane and natural gas for cooking and coal for electricity generation.

Most of America’s energy is provided by conventional forms of energy; petroleum, natural gas, coal, nuclear, biomass and hydroelectric. These six forms of primary energy provide over 90% of the energy we use, need and depend on to power our high quality of living. I used the John Deere tractor as an image to get attention to the energy component of food production. Rotary is involved in helping the less fortunate all around the world. The Energy cost component of food production is over 50% for most foods when “farm to table” is considered. Costs such as; fertilizer, tractor fuel, grain drying, food processing, refrigeration for dairy and meat products and distribution transportation power and supermarket refrigeration. As energy costs rise, they become one of the root causes of inflation.

The relationship of energy and economic growth is well known by those of us that have worked in the energy business but not so well known by the general public. To illustrate this relationship I used the data compiled by the U.S. Department of Energy back in 2010 to show the correlation of coal consumption and GDP growth from 1970-2010. This GDP growth was steady and in spite of the Arab Oil Embargo’s of 1973 and 1980. Back in the late 1970’s, when Jimmy Carter was President, his Administration promoted a National Energy policy that focused on Domestically produced energy. Because America is the “Saudi Arabia of Coal” over 50% of the U.S. ever growing electricity generation, continued to be from coal fuel.

Moving forward from 2010 to 2021, the Energy Flow Chart shows the sources and uses of each form of energy. Including renewables.

The LLNL Sankey Diagram of total primary energy flows is my favorite illustration. This shows on one diagram the total energy sources and consumption. I think it is an easy to understand graphic that any reasonable person can understand. Thus, it is my favorite energy chart.

Three points are to be made with this chart: 1. America uses about 100 Quadrillion Btus of energy each year and that this has been steady for the last 20+ years. The year 2021 energy use dipped to 97.3 Quads because of Covid and reduced travel and industrial output. 2. The LLNL chart shows PRIMARY Energy Flows. The distiction of Primary and Secondary Energy needs to be understood. For example, electricity and hydrogen are forms of Secondary Energy 3. The most important point emphasized by this chart is that wind and solar only provided 4.96% of the U.S. Primary Energy. This after decades of subsidies and taxpayer funded incentives for wind and solar.

Each South Carolina citizen uses an average of 866,000 Btus per day. Each of us in the room live a slightly above average life style. Thus, I submit that each one of us uses over a million Btus of conventional energy each day. The slide above shows the forms that energy is used by each of us, or on our behalf. I say on our behalf considering for example, the Diesel fuel used to power a truck delivering an Amazon shipment to our home, or Jet Fuel for a Fedex air freight shipment. Also, many of us will travel to see friends and family over the Thanksgiving Holiday and vacations. Travel such as that uses much more than a million Btus/day/person when gasoline and jet fuel are considered. The number is derived from dividing the total primary energy BTUs used in the state by the population then divide by 365 days, to come up with the energy/person/day consumption. The information on the illustration below is compiled by the U.S. Department of Energy for SC residents.

This reminds me of one of the excellent questions asked at the end of my presentation. The question was, “If we each use about a million Btus per day, how much do they cost in dollars?”. Great question and the answer reminds us of how fortunate we are to be Americans! A million Btu’s of natural gas costs about $7.00/million Btu and a million Btus of Diesel fuel costs about $46.00/million Btus. Depending on our personal use of energy it will be somewhere in between. Coal energy is the least costly and before Covid was less than $3.00/million Btus. But, lately due to so many factors resulting from the government’s “War on Carbon”, delivered coal costs are about the same as natural gas. This is what the proponents for renewables want, higher costs of fossil fuels which then makes renewables more competitive by increasing the costs of the once affordable fuels. In my opinion, this is not a good strategy to keep America strong.

The Alaska pipeline was approved by Congress and built after the 1973 Arab Oil Embargo. It presents a vivid image of the amount of oil America depends on each day. The Alaska pipeline is above ground because of the Permafrost Tundra in northern Alaska. The above ground image provides a graphic illustration of a pipeline capable of transporting about two million barrels of oil per day. America uses about twenty million barrels per day of oil, so to illustrate that, imagine ten pipeleines like the one shown above, side by side. Yes, that is a lot of oil to be refined into gasoline, jet fuel, kerosene, lubricating oil, grease and many other petroleum products. Not to mention the oil used in making plastics and other materials used for manufactured products of all types.

Total Primary energy production and use 1950-2020. I stated earlier that America has leveled off at about 100 Quadrillion Btus of energy each year. This chart by the EIA shows that from about the year 2000, the U.S. has used right at 100 Quadrillion Btus/year. Another point to make: Note that in 2019 it was the first year since about 1960 where America produced as much Domestic energy as we consumed. In other words, in 2019 America became energy Independent.

The total energy consumption since 1776 is shown on this chart. If you close your eyes and imagine the inventions from 1850 on such as the end of darkness with Edison’s development of the light bulb, the gasoline engine, the Diesel engine, steam turbines, airplanes, air conditioning, refrigeration, synthetic ammonia production from natural gas, plastics, steel, aluminum, airplanes and etc. All of these modern inventions, most developed during the 20th Century have provided a very high quality of life or as the United Nations quantifies it, “HDI” (Human Development Index”). The modern devices, including automobiles, airplanes and home appliances all depend on energy. Substituting muscle power for machines. As recent as 1900 farming was done with muscle power until tractors were invented and mass produced. Perhaps this is a good time to interject the fact that many of the eight billion people now living on this planet do not have the HDI that American’s enjoy.

The data above is a few years old as it shows the world population at 7.2 billion. Just this week the U.N. estimated that the world has now passed 8 billion in total population. It is my opinion that not much has changed in the percentages of people living below the energy and HDI levels of the Developed world. As shown on the chart, about half the world population lives well below our quality of life in energy poverty. The difference? Energy and Liberty. This is the season of Thanksgiving and all Americans have much to be thankful for. I know I am.

While Americans have much to be thankful for……There are some quirky and misguided organizations and people in government that do not understand the importance of conventional forms of energy. Some of these organizations and people are: the Sierra Club, Yale University, Stanford University, Princeton, many members of the Democrat Party, celebrities and the Entertainment Industry, the United Nations, the Main Stream Media, the World Economic Forum, Public Education the EPA and “Woke” corporations . They and others have waged a “War on Carbon” for decades and wealthy Billionaires such as Jeff Bezos and Michael Bloomberg have contributed hundreds of millions (together-Billions) of dollars to shut down coal plants and stop the use of fossil fuels. Their solution is to basically, “Electrify Everything”. The graphic above includes a couple screen prints from the Yale 360 and Sierra Club websites. They are not alone, many organizations and celebrities have taken up the “Green Energy” cause. What I am attempting to show in this presentation is, that everything cannot be electrified! How do you think the people living below the poverty line feel when diplomats and wealthy indivduals like John Kerry, Barack Obama, Gina McCarthy, Joe Biden, Michael Bloomberg, Jeff Bezos and others from the government and World Economic Forum, gather together after flying in their private jets half way around the world and then they lecture people living in Africa, Indonesia and India on how they should Decarbonize? One example is the importance of ammonia fertilizer production. This uses about 1.2% of the world’s energy and if ammonia fertilizer production was stopped, Vaclav Smil, an energy expert and author has estimated that half the people on the planet would perish from famine.

The 100 Quadrillion Btus of energy we Americans use each year cannot be replaced by wind and solar. It is impossible to do so and still continue our good quality of lives. Below is another couple figures from the U.S. Dept. of Energy which show where our electricity came from in 2021. Note that it is over 80% conventional. As far as carbon free electricity, the greatest source is nuclear power which provides almost 20% of America’s total electricity.

A reminder that Energy Independence is important not only to power our HDI but also for National Security. Both militarily and for economic security. If one does not believe energy is important for a sustainable and good life, then that person should read up on the current events in Europe and Ukraine with energy shortages. Read the news on BASF downsizing fertilizer production in Germany because of high energy costs and also other German industrial plants are being downsized or shut down. All older Americans should remember the Oil Embargo’s of 1973 and 1980. Taking the U.S. Oil Embargos and Russian war on Ukraine into consideration this should elevate the understanding of the importance of energy independence and affordable production of energy to sustain our lives. Also, those of us living on the coast remember how our lives changed when hurricanes like Mathew in 2016 knocked out electricity and stopped gasoline deliveries.

Electricity generation that is “Dispatchable” is important for reliable electric service. The 24 hour chart above shows typical electric Demand for a Utility. The red lines are summer with higher air conditioning load and the winter in blue. Whether summer or winter, electric load is greatest in the morning and late afternoon. The Demand at 5:00 PM will typically be about 150% to 200% of the Demand at 5:00 AM. This is because of increased commercial lighting, cooking for dinner, folks returning home from work and turning on TV, etc. As my first “Electricity 101” instructor put it in 1959, “Electricity Needs to be Generated the Instant it is Needed”.…This is called Dispatchable electricity generation.

The Current Grid example above shows electricity generation for the 48 states of the U.S.A. This example is from October 2021 but it was similar for 2022. The cycling lines representing natural gas power illustrate the electric load Demand swings from daytime to night-time. The variations are similar but less extreme for coal and hydro. These four sources of electric generation are Dispatchable. Over 80% of the generation for the 48 states up till now, is from Dispatchable generation. Solar and wind are Not Dispatchable. So, as in California a year or two ago, as people came home from work, started cooking dinner, charged their EV’s and turned on TV’s…..the Demand for electricity exceeded the available supply and rolling Blackouts occurred. Texas in the winter of February 2021 had a similar experience. Both Blackout events were the result of too much intermittent power generation from wind and solar with too many Dispatchable coal and nuclear plants having been shut down in the last few years.

The graphic above is from the Midcontinent Independent System Operator known as MISO. Actual data from July 2022. The point is to show the generation by fuels which includes 41.85% coal. Many of these coal plants are planned to be shut down in the coming years, without planning replacement generation fron Dispatchable sources. (This is an absence of a Rational Energy Policy)

The chart above is from the North American Electric Reliability Corporation known in the indstry as NERC. As is shown, about 102,600 MW of Dispatchable, afffordable coal and nuclear electric generating capacity has been shut down since 2011. More shut downs are planned for the next couple of years.

For people like myself that have been involved with energy and electricity generation for decades, it just seems foolish and ill planned. I started digging a year or two ago to attempt to determine why America has no energy policy to replace the coal and nuclear plants that have been shutdown with more to follow? The answer is that America’s energy policy is driven by environmental extremists that know little about energy and electricity generation and seem to not care about the consequences and weakening of America. Some of these organizations are shown below.

The public Indoctrination has been highly successful in indoctrinating the general public believe that green power can replace coal, gas, oil and nuclear energy. It cannot if we are to continue to enjoy our high HDI style of living.

Another RTO (Regional Transmission Operator) is the PJM Interconnection. This RTO serves as the electric power equivalent of an “Air Traffic Controller” to distribute the power genaration to the least cost electric generating plants between NJ and Illinois. A huge portion of the Northeastern states. Like MISO, much of the pwer generation this summer was from coal plants. Like MISO, many of the Dispatchable coal plants are planned for shut down in the near future. Until then neeeded preventive maintenance is not the same as if they were valued assets to be depended on for decades into the future. Also, there are no plans to replace the lost generation with new coal or nuclear units, at least, not yet.

As a side note, when RTO’s were formed, rather than having Regional Utilities plan for future Generation, it relieved the Regional Utilities of responsibility to plan future generation assets. Thus, when we get to Blackouts because of poor planning, no one will be held accountable. It is bizarre for our great country to come to this.

Let’s talk about South Carolina and where we get our electricity.

Over 56% of SC electric generation is from nuclear power generation. SC ranks #3 in the U.S.

Here on Hilton Head Island our electricity is distributed by Palmetto Electric Co-Op. Palmetto Electric receives most of their Bulk Power from Santee-Cooper. The generation assets of Santee-Cooper are shown on the chart above. In the lower right inset, is shown the Summer Nuclear Plant which is operated by Dominion Energy. Santee-Cooper owns 322 MW of the nuclear generation capacity of Summer Unit #1. Two additional nuclear units were planned when SCE&G was the owner but mismanagement resulted in quitting the construction process after spending about nine Billion dollars on the expansion. Had it been successful, it would have been a good plan for carbon free electric generation capacity. Currently, most of Santee-Cooper’s power generation is from the Cross and Winyah coal power plants. As can be seen from the Santee-Cooper table above of electricity generation assets, over 67% of them are coal plants. The Cross Steam plant is about 130 miles north of Hilton Head in Pineville, SC. This plant is rated at 2,350 MW. Just to put that in perspective, the Cross coal plant is close to the same size as the American side Hydroelectric plant at Niagara Falls. This is serious Bulk Power generation capacity.

The Santee-Cooper utility also owns the 3.5 MW rated Solar Farm off of I-95 near Walterboro. Again, referring to the generation assets of Santee-Cooper, the solar capacity is about 0.1% of the total.

The solar collectors are not Dispatchable and obviously only can generate power only about 4-8 hours during the sunny portion of a 24 hour period. Also considered “Green Power” and can function 24/7 is the Landfill Gas plants that Santee-Cooper operates. These capture and use the methane gas which is produced from the decomposition of the organic materials in municipal waste.

Santee-Cooper management recognized the electricity Demand growth of the future. As mentioned above, they correctly planned for the needed increase of new generation capacity by a 45% joint ownership of the Summer Units 2 & 3 nuclear units. Also, Santee-Cooper approved the design and construction of a new 600 MW clean coal plant near Florence, SC. The components for this plant were designed and purchased. However, extreme opposition from environmental extremist organizations forced it to be cancelled. As I understand it, The large Central Electric Co-Operative in upstate S.C. negotiated a power purchase agreement with Duke Energy to purchase excess Bulk Power generation from Duke’s nuclear plants. This agreement provided excellent low cost Bulk power up to about 2030. After 2030 the contract will need to be renegotiated. Also, in 2030 the Oconee #1 nuclear power plant operating license will need to be extended by the NRC. (Nuclear Regulatory Commission)

The chart below is from the Santee-Cooper projection of electricity growth from 2020 through 2040. As can be seen from the chart, the 1,045 MW Winyah coal plant is planned for shut down in 2028. The difference between the expected growth to over 6,000 MW by about 2035 could have easily been made up for, were the Pee Dee coal plant and one of the planned additional units at Summer been completed. As this is written, Santee-Cooper and their stakeholders are working to figure out where to secure the replacement generation to replace the 1045 MW’s in capacity that will be lost when the Winyah plant is shut down. From what I have read, the most likely approval will be solar, batteries for backup and when all that is inadequate, they will install more Gas Turbine Combined Cycle units. Time will tell.

Based on the foregoing and a lot of additional information, some of which is included in the references at the end, I have formed my conclusions….

Thank you for this opportunity to be part of your program tonight. I sincerely appreciate your interest in energy and electricity. Feel free to contact me should you have any further questions,

Yours very truly,

Dick Storm, Monday November 14, 2022

Energy equivalents and other information relevant to this presentation is copied below. Further references and information for further reading are listed following these conversions:

Energy Units and Conversions The data and information which follows is listed for reference and further reading.

1 Watt is the power from a current of 1 Ampere flowing through 1 Volt 
1 kilowatt (kW) is a thousand Watts

1 kilowatt-hour is the energy of one kilowatt power flowing for one hour. (E = P t)

A BTU (British Thermal Unit) is the amount of heat necessary to raise one pound of water by 1 degree Fahrenheit (F). 

1 Megawatt (MW) is a thousand kilowatts  (if Dispatchable power, up to 164 homes)

Hilton Head Island uses about 150-200 MW on a hot summer day

1 Gigawatt (GW) is a thousand Megawatts

1 kWh=3,412.6 BTUs (if converted at 100% efficiency)

1 BTU to convert to work at 100% efficiency= 778 Foot Pounds

1 Quadrillion = 1015 BTU  (World energy usage is about 600 Quads/year, US is about 100 Quads/year since 1996) 

Important Points on the use of Hydrogen (Secondary Energy)  as Fuel: 

Conversion by Electrolyzer of water to Hydrogen, takes about 50 kWh/pound of hydrogen (39 kW/pound is at 100% efficiency)

Electrolyzer produced electricity back to electricity = 26-30% round trip

It takes 9 pounds of water to create 1 pound of hydrogen

Hydrogen Energy from 1 cubic foot=325 BTUs, Methane CH= 1,030 BTUs Hydrogen has less Energy Density

Liquified Hydrogen is -423 Degrees F.  (Liquifying is at cost of of about 30% of the energy available from the Liquid Hydrogen Fuel itself)

Liquified Natural Gas (LNG) is  -260 Degrees F.

Power Conversion

1 horsepower (hp) = 745.7 watts

I Air Conditioning Ton approx. 1 kWh

Gas Volume to Energy Conversion

One thousand cubic feet of natural gas (Mcf) -> 1.027 million BTU 

Energy Content of Fuels

Coal     (Bituminous)             10,500- 12,500 BTU/pound               (Recent cost $15.00/million BTUs, Cost in 2019 about $2.50/million Btus)

Coal (Wyoming PRB)             8,000-9000 BTU/pound
Natural gas (Methane CH4) 1,030 BTU/cubic foot                        (Recent cost $7.00/million BTUs)
Wood                                       8,200-9,600  Btus/pound

Hydrogen                             51,600 BTUs/pound (LHV)                (Recent cost $17.00+/million BTUs If you can find it)

Approximate Fuel Energy Content/million BTU 

Gasoline                       115,400-125,000 BTU/gallon                 (at $3.50/gallon= $30.00/million BTUs)

Gasoline E10                 114,300 BTU/gallon

Diesel                           128,700-135,000 BTU/gallon                 (at $6.00/gallon= $46.62/million BTUs)

Ethanol (E100)                75,700 BTU/gallon

Propane                          83,500 BTU/gallon

References for further research on Energy and Climate Policies:

  1. Reuters, Oct. 25, 2022, Dr. Faith Birol of IEA states, “This is the World’s First Global Energy Crisis”: https://www.reuters.com/markets/commodities/global-lng-markets-further-tighten-next-year-ieas-birol-2022-10-25/
  2. Energy is Life by Dr. Samuele Furfari, Oct 17, 2022: https://blog-friendsofscience-org.cdn.ampproject.org/c/s/blog.friendsofscience.org/2022/10/17/energy-in-addition-to-the-security-challenge-now-the-safety-challenge/amp/
  3. 97% CONSENSUS ON CLIMATE CHANGE? SURVEY SHOWS ONLY 59% OF SCIENTISTS EXPECT SIGNIFICANT HARM:

https://www.heartland.org/news-opinion/news/97-consensus-on-climate-change-survey-shows-only-59-of-scientists-expect-significant-harm

4. Blackouts Threaten New England Again, Donn dears Blog :  https://ddears.com/2022/10/25/blackouts-threaten-new-england-again/

5. Dick Storm Blog, November 2022, “Electric Generation Planning, Then and Now”: https://dickstormprobizblog.org/2022/11/10/electric-generation-planning-then-and-now-what-will-be-the-monuments-to-poor-planning-in-2024/

6. Dr. Steven Koonin on Catastrophic Climate Change:  https://www.prageru.com/video/is-there-really-a-climate-emergency?utm_source=Iterable&utm_medium=email&utm_campaign=campaign_5331670

7. Donn Dears Politics of Energy Part 1 (Largest energy reserves): https://bit.ly/3J5OnTc

8. North American Electric Reliability Corp., Long Term Reliability study: https://www.nerc.com/pa/RAPA/ra/Reliability%20Assessments%20DL/NERC_LTRA_2021.pdf

9. SEPP (Science and Environmental Policy Project): http://www.sepp.org/the-week-that-was.cfm  

10. Mark Mills, Prager University, On Energy: https://www.youtube.com/embed/wDOI-uLvTnY

11. Dick Storm Short Link, Elitists & Special Interests Govern Climate Policies: https://dickstormprobizblog.org/2021/11/03/glasgow-cop-26-elitists-and-special-interests-promote-china-first-america-last-why-because-energy-savvy-engineers-were-not-successful-in-educating-the-public-and-politicians-on-the-true-facts/

12. Americans use about a Million Btu’s per day per person to sustain our economy & quality of life: https://dickstormprobizblog.org/2022/05/17/providing-a-sustainable-million-btus-per-day-per-person-by-fuel-source/

13. Donn Dears Article on Net-Zero Carbon Reality Conclusions:  https://bit.ly/38ZVjDZ

14. The Right Stuff Climate Team (Retired NASA Engineers): https://www.therightclimatestuff.com

15. The Energy Crisis will Worsen, Daniel Yergin, July 11, 2022: https://www.project-syndicate.org/commentary/energy-crisis-will-deepen-no-supply-by-daniel-yergin-2022-07

16. Nuclear Energy Institute, Area required for wind, dwarfs land needed for nuclear power: NEI Land Area Required for Wind and Solar to replace a 1000 MW Nuclear Plant: https://www.nei.org/news/2015/land-needs-for-wind-solar-dwarf-nuclear-plants

17. World Nuclear Organization: https://world-nuclear.org/information-library/current-and-future-generation/nuclear-power-in-the-world-today.aspx

 18. Real Time US Power Grid link to EIA: https://www.eia.gov/electricity/gridmonitor/dashboard/electric_overview/US48/US48

19. No, we cannot electrify everything, Capital Research, December 2021 issue: https://capitalresearch.org/app/uploads/Capital-Research-2021-8.pdf

20. Michael Schellenberger article on German experience of “Green Power”: https://www.forbes.com/sites/michaelshellenberger/2019/05/06/the-reason-renewables-cant-power-modern-civilization-is-because-they-were-never-meant-to/?sh=6da16be6ea2b

21. CONGRESSIONAL RESEARCH CENTER REPORT, An excellent primer on energy with outstanding illustrations:https://crsreports.congress.gov/product/pdf/R/R46723

22. American Public Power Assoc. Electric Generation by Sources, 2022: https://www.publicpower.org/resource/americas-electricity-generating-capacity

23. International Energy Agency, How the Energy Crisis is Exacerbating the Food Crisis, June 2022: https://www.iea.org/commentaries/how-the-energy-crisis-is-exacerbating-the-food-crisis

24. Vaclav Smil, Scientist Interview on “How the World Really Works” by New York Times, April 2022: https://www.nytimes.com/interactive/2022/04/25/magazine/vaclav-smil-interview.html

25. Vaclav Smil Books: “Power Density”, “How the World Really Works”, “Energy and Civilization”, “Grand Transitions” and more. He has written about 40 books, most based on the importance of energy.

26. POWER Magazine, Sonal Patel, Sept 9, 2022, EPA Rules likely to shut down about 86 GW of coal generation in next few years: https://www.powermag.com/group-epas-coordinated-regulatory-assault-on-coal-power-could-push-retirements-beyond-86-gw-by-2030/?oly_enc_id=3247D5884312C9W

27. EIA Coal to Nuclear Report, Sept. 2022: https://www.energy.gov/ne/articles/could-nations-coal-plant-sites-help-drive-clean-energy-transition

28. You Tube, “How Much Energy Will the World Need”: https://www.youtube.com/embed/wDOI-uLvTnY

29. Dr. Nicolas Kokell, Sources of Primary Energy :  https://portfolio-pplus.com/Communicator/Details_Article/1023

30. Professor Furfari article Sept. 2022, Hopeless European Green new Deal: https://clintel.org/the-many-hopeless-european-climate-change-laws/

31. Bloomberg, China to Build 150 new nuclear plants, valued about $440 Billion. November 2021: https://www.bloomberg.com/news/features/2021-11-02/china-climate-goals-hinge-on-440-billion-nuclear-power-plan-to-rival-u-s#xj4y7vzkg

32. IEA Energy Costs to Produce Food, June 2022: https://www.iea.org/commentaries/how-the-energy-crisis-is-exacerbating-the-food-crisis

33. WSJ May 8, 2022, Power Plants Struggling With Electricity Shortages to Keep Power on: https://www.wsj.com/articles/electricity-shortage-warnings-grow-across-u-s-11652002380?cx_testId=3&cx_testVariant=cx_2&cx_artPos=0&mod=WTRN#cxrecs_s  

34. WSJ June 18, 2022, West Risks Blackouts From Drought and loss of Hydroelectric Capacity: https://www.wsj.com/articles/west-risks-blackouts-as-hydroelectric-power-dries-up-11624008601?mod=article_inline  

35. WSJ, Opinion, May 27, 2022, Jason Hayes, “Why Blackouts are Coming to Michigan” Regarding shutdown of Palisades Nuclear Generating Plant: https://www.wsj.com/articles/why-electricity-blackouts-are-coming-to-michigan-nuclear-power-plant-green-energy-renewable-climate-11653685521?cx_testId=3&cx_testVariant=cx_2&cx_artPos=5&mod=WTRN#cxrecs_s

36. NERC Warning of Blackout Risk: https://www.datacenterdynamics.com/en/news/north-american-electric-reliability-corp-warns-of-increased-risk-of-grid-blackouts-this-summer/

37. The Guradian (UK) China’s Premier Calls For More Coal Plants, June 24, 2022: https://www.theguardian.com/world/2022/jun/24/chinese-premier-calls-for-more-coal-production-as-electricity-demand-soars  

38. Global Food Supply at Risk Due to High Energy Prices, The Guardian, June 25, 2022: https://www.theguardian.com/australia-news/2022/jun/25/our-global-food-supply-is-at-risk-when-high-gas-prices-limit-the-creation-of-fertiliser

39. US and World Coal Reserves Map: https://www.researchgate.net/figure/Coal-reserves-volumes-by-countries-of-the-world-3_fig1_328037099

40. EIA 2nd reference on World Coal Reserves, EIA 2011: https://www.eia.gov/todayinenergy/detail.php?id=2930

41. American Geosciences institute, World Coal Reserves: https://www.americangeosciences.org/critical-issues/maps/interactive-map-coal-resources-united-states

42. EIA Total Energy Use 1950-2020: https://www.eia.gov/todayinenergy/detail.php?id=43515

43. St. Louis Fed. Renewable Power Increases have reduced Conventional Power Generation Capacity Factors, thus weakening cash flow for O&M and improvements: https://fredblog.stlouisfed.org/2020/10/renewables-have-increased-the-capacity-for-electricity-production/?utm_source=series_page&utm_medium=related_content&utm_term=related_resources&utm_campaign=fredblog

44. Fact Check on Wind Power Cost: https://www.factcheck.org/2019/07/does-wind-work-without-subsidies/

45. Forbes, Michael Schellenberger article on True Cost of Wind Power: https://www.forbes.com/sites/michaelshellenberger/2021/04/20/why-renewables-cause-blackouts-and-increase-vulnerability-to-extreme-weather/?sh=6400daf54e75  

46. EPA Retains Tools to Harm Coal Power Production, Utility Dive, July 1, 2022: https://www.utilitydive.com/news/supreme-court-epa-GHG-carbon-power-plant/626456/?utm_source=Sailthru&utm_medium=email&utm_campaign=Issue:%202022-07-01%20Utility%20Dive%20Newsletter%20%5Bissue:42837%5D&utm_term=Utility%20Dive

47. VOX, Electrify Everything! : https://www.vox.com/2016/9/19/12938086/electrify-everything

48. Stanford, Mark Jacobson, Net Zero Carbon by 2050 : https://news.stanford.edu/2015/06/08/50states-renewable-energy-060815/

Jacobson’s website: https://web.stanford.edu/group/efmh/jacobson/Articles/I/WWS-50-USState-plans.html

49. UN Net Zero Carbon website: https://www.un.org/en/climatechange/net-zero-coalition  

 50. Princeton University Net Zero Carbon Plan: Net Zero Carbon Project Princeton University Researchers, Jenkins et al: https://cmi.princeton.edu/annual-meetings/annual-reports/year-2019/the-net-zero-america-project-finding-pathways-to-a-carbon-neutral-future/

51. Cornell Daily Sun, Speaker discusses Coal Plants in a Death Spiral: https://cornellsun.com/2016/10/03/keynote-speaker-investigates-recent-transformations-in-the-energy-grid/

52. WSJ Australia Warning on Green Energy Risks:  https://www.wsj.com/articles/a-warning-from-australias-power-crisis-green-energy-anthony-albanese-11655659465?cx_testId=3&cx_testVariant=cx_2&cx_artPos=3&mod=WTRN#cxrecs_s

53. National Coal Council, Enhanced Oil Recovery using C02 from Coal Plants, 2012: http://www.nationalcoalcouncil.org/reports/07-10-12-NCC_Harnessing_Coals_Carbon_Content_to_Advance_Economy_Environment_EnergySecurity.pdf

54. Detroit News, Consumers Energy to End Coal Use in 2025: https://www.detroitnews.com/story/business/2022/06/23/michigan-panel-approves-consumers-energy-plan-end-coal-use-2025/7716918001/

55. Alliant and WEC Change Plans to Retire Coal to Meet Demand, June 22, 2022: https://www.utilitydive.com/news/wisconsin-utilities-coal-retirement-miso-delay/626005/

56. The Permian Basin, The Gift of An Almost Permanent Supply of Oil at 2.5 million barrels/day, Sept 2022: https://wattsupwiththat.com/2022/10/04/the-permian-basin-the-gift-that-keeps-on-giving/

57. Liberty Energy, “Bettering Human Lives, ESG Report” August 2022: https://investors.libertyfrac.com/press-releases/2022/08-02-2022-222014779

58. Donn Dears Blog on Electric Vehicles and Lithium Batteries: https://bit.ly/3RDXOfB

59. BP Statistical Review of World Energy 2022:  https://www.bp.com/content/dam/bp/business-sites/en/global/corporate/pdfs/energy-economics/statistical-review/bp-stats-review-2022-full-report.pdf

60. IEA World Energy Outlook Reports: https://www.iea.org/topics/world-energy-outlook#reports

61. EIA (U.S. Dept. of Energy) Annual Energy Outlook: https://www.eia.gov/outlooks/aeo/

62. China, Keeping Coal King, Bloomberg: https://assets.bwbx.io/images/users/iqjWHBFdfxIU/iBjpZ.bmbits/v0/-1x-1.png

63. Coal is King in China, Bloomberg: https://assets.bwbx.io/images/users/iqjWHBFdfxIU/i3CKBFPaA7g0/v0/-1x-1.png

64. China Climate Advisers Say More Coal Needed for Energy Security, Bloomberg, Nov. 15, 2022:
https://www.bloomberg.com/news/articles/2022-11-15/china-climate-advisers-say-more-coal-needed-for-energy-security?mc_cid=72c8bf23a3&mc_eid=dddcf9dc32&leadSource=uverify%20wall

65. Facts on EV Charging by EVESCO, Good explanation of electrical Demand for EV Charging: https://www.power-sonic.com/blog/levels-of-ev-charging/

66. EIA Electricity Generation Facts, 2021: https://www.eia.gov/energyexplained/electricity/electricity-in-the-us-generation-capacity-and-sales.php

67. Mark Mills, Prager Univ. Myths of Green Energy, Nov. 2022: https://twitter.com/prageru/status/1589634529253261312

68. Competitive Enterprise Institute, Fifty Years of Wrong Predictions, 2019: https://cei.org/blog/wrong-again-50-years-of-failed-eco-pocalyptic-predictions/

I hope these references are useful to you to discover facts and information that are not readily discussed by the Main Stream Media.

Yours very truly,

Richard F. (Dick) Storm, PE

Richard.storm@stormeng.com

American Energy Independence With a Rational Energy Policy is Needed Now!

America and all Developed countries require Energy to power our lives and our economy. It is time (for the government, energy savvy citizens already know this) to face the facts and reality that nearly 90% of the energy America depends on, including for our Defense of National Security, is sourced from conventional fuels or sources of natural gas, nuclear, oil, coal and old hydropower generation. Wind and Solar cannot replace these forms of energy and the path to Net-Zero Carbon will weaken our country. A Rational Energy Transition is needed over the next few decades. As a reminder, the Sankey Diagram below shows the total primary energy flows by sources and flow for all of 2021 forms of energy . Note that less than 5% of the primary energy provided to the U.S. was from wind and solar.

The two key words are PRIMARY ENERGY! As a couple people have asked me on EV’s…..”You mean the electricity has to be generated somewhere else to charge an electric vehicle?”

Yes, over 89% of the PRIMARY ENERGY we use is from conventional sources of Petroleum, Coal, Natural Gas, Nuclear and Hydroelectric and yes, electricity to charge an EV likely came from conventional sources.

I have met with numerous groups to discuss our energy future and every time I outline the current government path to Net-Zero Carbon the people I talk with are shocked that there is not a planned transition to reduced carbon emissions and sustaining a reliable, affordable energy supply. Why? I believe it is because those that are knowledgeable in all forms of primary energy production are a small minority. Similar for secondary energy production, such as for producing electricity and hydrogen. I estimate that the people who thoroughly understand energy production is less than 5% of American (and the world) citizens. Smooth talking non-energy savvy politicians, the United Nations, the Main Stream Media, World Economic Forum and Public Education have Hoodwinked the Public into Demonizing carbon and preaching and legislating Green Power incentives. These powerful innfluencers have forced wind and solar Green Energy Religion on Americans. It is not possible to switch all of America or the rest of the Free World to Renewable wind and solar energy. It is possible to have a smooth transition to increase carbon free nuclear power and nuclear power produced hydrogen over the next three decades, but not by 2030 or 2035 as is proclaimed by the Biden Administration. America has no energy policy, only a policy of demonizing carbon and forcing the citizens to depend on unreliable, intermittent wind and solar.

Energy Misinformation is World-Wide

My friend Vincent who lives in France has sent me dozens of informative documents on energy. One document he sent yesterday caught my attention. It is the opening introduction of Professor Samuel Furfari’s article published on the Friends of Science Blog of Calgary University. I will quote Professor Furfari as he captures what I believe to be true as well. Furfari is referring to Europe, but much of what he states is applicable all over the Free World:

Energy is life. Without energy, we could not live. That is why our distant ancestors adopted, then invented ways to create fire. The use of energy is essential for life: animals and human beings eat because their bodies need energy. Moreover, energy is also the blood that runs through the veins of the economic system. In recent years, instead of seeing energy as a vital commodity, environmental activists have succeeded in reversing the logic by blaming energy for all the planet’s ills, to the point where energy is no longer spoken of in negative terms. Energy has become the symbol of pollution and climate catastrophe. A few days ago, at the end of a lecture, a student confessed to me that he had been shaken because I had shown, with data, that the quality of life measured by the UN HDI index and life expectancy at birth depended on per capita energy consumption. This correlation is also valid with CO2 emissions since 82% of the energy used in the world is fossil fuel. He had never thought about it. No one had ever told him that.” Furfari continues….

“Will the current crisis be enough to bring us back to the common sense of the absolute priority of having abundant and cheap energy, as the founders of the EU said in the past? This is not certain, as the population has been so indoctrinated with negative and even catastrophic messages. But if the current crisis was to last and worsen, climate policies could face fierce opposition from the population, since it is true that the population cannot do without abundant and cheap energy, as the current panic demonstrates. Thanks to the development of technology and our energy resources (North Sea hydrocarbons and nuclear energy), the EU was able to escape the oil crises of the 1970s. The energy terrorism that may develop in the near future will have much more far-reaching consequences, as the EU is now much more dependent on energy consumption than it was fifty years ago.”

The foregoing is from a European viewpoint. My opinion/commentary now continues:

We Cannot Electrify Everything!

It is not even possible to install enough wind turbines and solar collectors across the U.S. to “Electrify Everything”. Further, we cannot electricfy everything and still sustain our high quality of living. For such products/materials as fertilizer, ammonia, food production energy, plastics, cement manufacture and steel manufacture. So what would a Rational Energy Policy look like? Here is my shot at offering one:

A RATIONAL ENERGY PLAN

Here is what a Rational Energy Plan would look like:

  1. Maintain Existing Coal & Nuclear Plants as If they will Run for 20 more years….because… we will likely need them.
  2. Reduce Federal Regulations on Oil, Gas, Coal production and all hard rock Mining within the U.S.A.
  3. Reduce Regulations and build more Refinery Capacity
  4. Approve Keystone and other Pipelines for Construction
  5. Reduce Federal Regulations on Coal Plant Emissions to levels in effect in 2020 (except CO2 restrictions that were later vacated by SCOTUS)
  6. Build New HELE Coal Plants, Equipped with Provisions for Future CCUS     (HELE=High Efficiency Low Emissions)
  7. Continue R & D for Energy Storage and Hydrogen Production
  8. Increase Hydrogen Distribution Infrastructure
  9. Keep Options of Continuing Internal Combustion Engines Beyond 2035 for those citizens that prefer Internal Combustion Engines
  10. Expand Oil & Gas Infrastructure to meet next 30 year Demand
  11. Increase the pace for designing, NRC Approvals, manufacturing and construction of new Small Modular Nuclear Reactors to be built all across the U.S.A. to replace the 102,000 MW’s of reliable, Dispatchable electric power production capacity that has been shut down since 2010.

Summary and Conclusions

When America’s economy and our productive capacity are restored, it will be with the result of reduced Federal Regulations and increased Domestic Energy production. To sustain life as we know it, each American on average needs about one million BTUs of energy equivalence each day. This includes energy for electricity generation, transportation, Industrial production, National Defense, commercial and residential uses. Over 90% of that energy is sourced from conventional sources of natural gas, oil, coal and nuclear. These numbers are substantiated by the Lawrence Livermore National Laboratory Sankey Diagram I placed as the first illustration. Yes, it shows 95% of the primary energy America runs on is from conventional forms of energy. It is Energy Fiction to believe that the conventional forms we use and depend on now can be provided by wind and solar as the Biden Administration and Congress have advocated. (I suppose we could add to this list of indoctrinators: the United Nations, World Economic Forum, Environmental Extremist groups, the MSM, U.S. Public Education and Woke corporations)

If the Biden Administration and Congress do not create a Rational Energy Policy as I have outlined above, then America’s Infuence in the World and our Economy will go into an ever increasing decline. As outlined by Professor Samuel Furfari, the same is true for Europe. “Energy is Life, Without Energy we cannot live”.

The Developed World runs on energy and America has the natural resources to regain Energy Independence.

Dick Storm, October 12, 2022

Quote of the Week: 
“Wherever the real power in a Government lies, there is the danger of oppression.” —James Madison (1788)
Ken Haapala President of SEPP

References and Additional Reading materials:

  1. Energy is Life by Samuel Furfari, Oct 17, 2022: https://blog-friendsofscience-org.cdn.ampproject.org/c/s/blog.friendsofscience.org/2022/10/17/energy-in-addition-to-the-security-challenge-now-the-safety-challenge/amp/
  2. The changing world of energy and the geopolitical challenges”. Samuele Furfari’s latest book is “The hydrogen illusion”.
  3. Europe’s Energy Crisis Was Created by Politics: https://mises.org/wire/europes-energy-crisis-was-created-political-intervention
  4. WSJ-Nord Stream Blasts Likely Sabotage, German Probe Finds, October 17, 2022: https://www.wsj.com/articles/nord-stream-blasts-were-likely-result-of-sabotage-german-probe-finds-11666016047?mod=mhp
  5. WSJ-Winter’s Approach Raises Stakes in European Energy Crisis, Oct 16, 2022: https://www.wsj.com/articles/winters-approach-raises-stakes-in-european-energy-crisis-11665926245?mod=djem_EnergyJournal
  6. Alex Epstein substack, October 2022, How a Fake Climate Emergency Created a True Energy Crisis: https://alexepstein.substack.com/p/how-a-fake-climate-emergency-created?utm_source=email
  7. No, Melting Greenland Ice is Not About to Swamp Coastal Areas, H. Sterling Burnett, The Heartland Institute: : https://www.heartland.org/news-opinion/news/no-melting-greenland-ice-is-not-about-to-swamp-coastal-areas
  8. Is Global Warming the Cause of Ian? The evidence says NO! Watts UpWith That: October 16, 2022: https://wattsupwiththat.com/2022/10/16/is-global-warming-responsible-for-hurricane-ian-the-evidence-says-no/ For references use this link.
  9. States to Ban Gas Cars Despite the Human and Environmental Cost, Epoch Times, September 26, 2022:   https://link.theepochtimes.com/mkt_app/states-to-ban-gas-powered-cars-despite-human-and-environmental-cost-of-electric-vehicles_4726635.html?utm_campaign=app-cc&utm_source=ref_share
  10. Sea Level Rise Jumpy After Last Ice Age, WUWT:
    https://wattsupwiththat.com/2010/12/01/sea-level-rise-jumpy-after-last-ice-age/
  11. The Week that Was by the Science and Environmental Policy Project, Edited by Ken Haapala, President: http://www.sepp.org/the-week-that-was.cfm
  12. Net Zero=Pro China, Pro Russia, Science Matters, Ron Clutz, October 2022: https://rclutz.com/2022/10/13/net-zero-pro-china-pro-russia/#like-27736
  13. Net Zero Watch, October 2022: https://mailchi.mp/dca1b92c985c/us-banks-threaten-to-withdraw-from-net-zero-alliance-191791?e=9e46528ac6
  14. Liberty Energy, Bettering Human Lives Report August 2022: https://www.libertyenergy.com/betteringhumanlivesv2/
  15. Donn Dears Politics of Energy Part 1 (Largest energy reserves): https://bit.ly/3J5OnTc 
  16. Donn Dears, Politics of Energy Part 2 :  https://bit.ly/3QuEuRs
  17. Donn Dears Politics of Energy Part 3: 
  18. Donn Dears, Destroying Energy Security Part 1 (SEC and ESG reporting):  https://bit.ly/3C1a5Xd 
  19. Donn Dears, Destroying Energy Security Part 2: https://bit.ly/3JVGWyD
  20. Donn Dears, Destroying Energy Security, Part 3: https://bit.ly/3A8cvRl
  21.  Donn Dears, China’s Coal-Fired Plants Dominate:  http://bit.ly/3RL6PEJ
  22. Donn Dears, Europe’s Rendezvous with Destiny: https://bit.ly/3caBprb 
  23. Donn Dears, IPCC Report, Part 1: https://bit.ly/3Aeruea
  24. Donn Dears, IPCC Report, Part 2: https://bit.ly/3AqFm53 
  25. CO2 Coalition Facts: https://co2coalition.org/facts/
  26. Competitive Enterprise Institute, Cooler Heads Website: https://go.cei.org/webmail/287682/949316776/68e507be334cf34c7d54b4b2a348b50f1d373ec69c94d0d629001f91129chttps://www.wsj.com/articles/the-coming-global-crisis-of-climate-policy-europe-germany-energy-prices-bankruptcy-winter-subsidies-borrowing-green-nuclear-116626510701e7d

Providing a Sustainable Million Btu’s per Day, per Person by Fuel Source

Each person that lives in a Developed Country and enjoys our high quality of life uses well over a million Btu’s per day. This post is a reminder of the importance of energy to power our lives and the sources of the energy we depend upon.

Introduction

The war on carbon has been going on for a long time. I have written my thoughts on the start of the war on carbon which has been escalating since the Clinton Presidency and was ramped up during Obama’s. The Biden Administration has further ramped up Climate Policies (aka war on carbon) which encompass the entire government, making the Clinton and Obama attacks on carbon compare as small nuisances. Then the United Nations Secretary General has piled on with his urging to ban investment in any fossil fuel production and to use the world’s financial institutions to cut off investment through ESG policies. The Main Stream Media and Entertainment and many “Woke Banks and large Businesses” have joined in to create a serious indoctrination program for the people of the world and tightened up the available financial investment to expand or modernize energy production facilities of any type. Not only the U.S., but the Climate Policies of the world to attain Net Zero Carbon by 2050 now has much momentum. The purpose of this post is to simply lay out the facts of the energy needs of today for anyone living in the Developed World.

The Importance of Energy

Energy use, economic prosperity and Quality of life go hand in hand. The title of one of Mr. Donn Dears recent books is: “NET-ZERO Carbon, The Climate Policy Destroying America”. 

At first glance, the sub title, “Climate Policy Destroying America” may seem to be an exaggeration. The intention of this short essay is to show that Mr. Dears is correct, if we move toward Net-Zero Carbon too quickly, it will destroy the American way of life and will cripple our economy. The word “Sustainability” means to me, that we sustain our quality of life as Americans have enjoyed for many years. Energy, quality of life and economic prosperity are all related. Kindly stick with me and read to the end to review the importance of conventional energy. 

100 Quadrillion Btu’s Per Year Energy Use

America has used right at 100 Quadrillion Btu’s (+/- 10)  annually of energy for the last twenty years. The EIA and the Lawrence Livermore National Laboratory (LLNL) have calculated and published this data for decades. Here is an excerpt of the LLNL description from their website.

The national economy is reenergizing, quite literally”

“In 2021, Americans used 5% more energy than in 2020, according to the most recent energy flow charts released by Lawrence Livermore National Laboratory (LLNL).

Each year, LLNL releases flow charts that illustrate the nation’s consumption and use of energy. In 2021, Americans used 97.3 quads (quadrillion BTU) of energy, which is 4.4 quads more than last year’s 92.9 quads, equivalent to a 5% increase. Both 2020 and 2021 annual energy consumption totals are less than 2018 and 2019, where Americans used more than 100 quads per year. A BTU, or British Thermal Unit, is a unit of measurement for energy; a BTU is the amount of heat it takes to raise 1 pound (~1 pint) of water by 1 degree Fahrenheit. 3,412 BTUs is equivalent to 1 kilowatt-hour, which is the amount of energy it takes to light an efficient LED lightbulb for a week. “ The chart below includes all forms of energy, including wind and solar which are included as the thermal equivalents of the electric power they produced. The chart shows “Total Primary Energy” which includes electricity generation, residential, commercial, industrial and transportation. This is my favorite chart for illustrating energy sources and uses. Suffice it to say, it is a lot of information in one chart.

The best single chart I know of to show Total Energy Flows by Fuel to end use
LLNL Energy Flow Chart for year 2021

Please note the quantities of solar and wind which are 1.5 Quads for solar and 3.33 Quads for wind. Yes, this is an increase from previous years. However, the total wind and solar is 3.85 Quads or right at 4%. 

My point is that Electrifying Everything if it were possible to take a magic wand and change all energy use to electric power, including heating, cooking, transportation and industrial production, then it will take a growth of 25 times what is installed now by nameplate power. When considering capacity factors of wind and solar it will actually be more like 75-100 times current installed capacity plus, technological advancements in energy storage would need to be accomplished. In essence, it is impossible to get there within 8 to 28 years (2030 or 2050) and still sustain our high quality of life and yes, our high standard of living. Not to mention Dispatchability, energy storage limitations and land use requirements. Also, the practical limitations of changing energy use for transportation, the second largest use of total primary energy after electricity generation, to electric or hydrogen power. How many of us would be willing to fly on a hastily developed hydrogen fueled jet aircraft? Change our lives to use EV’s for long distance drives? Give up the plastics, textiles and numerous other products that are created from oil, gas and coal? Let’s get back to what we do and enjoy through the use of today’s forms of energy.

So, How Much Energy, in Btu’s Does Each American Use per day?

The illustration below was prepared to show a Middle School class the equivalent forms of energy they would use in a day. For our high quality of living, it is not hard to see how we depend on an average of about a million Btu’s of energy each day.

From Dick Storm presentation to Middle School Students, March 2022

Not shown in the illustration is the energy that is used on our behalf to provide industrial production, military defense and transportation of food and products to our local stores or even deliveries to our door via Amazon, Walmart, UPS, FedEx or other delivery services. Also, about 1% of America’s energy is used to produce fertilizer for farming, not including the fuel for tractors and processing food. All of these energy uses averaged out come to (in a good year) about 100 Quadrillion Btu’s. Remember, up to now, 4% are from wind and solar.

Does it seem reasonabe to expect that we can electrify everything? Including aircraft propulsion, all light vehicles, trucks, ships, trains, fertilizer and more? I don’t think so.

From Dick Storm Presentation to Middle School Students

Think about your day and both the necessities and the conveniences made available through the use of energy. My heading stated we use an average of about a million Btu’s per person each day. For those that will read this post, I suspect each of you are using far more than a million Btu’s per day. For example if a person takes a two hour flight on a airline, even at 80 miles per gallon per seat mile, the per person fuel for a 1,000 mile flight is about 12.5 gallons of Jet A. The plane trip alone uses about a million five hundred thousand Btu’s. The LLNL and EIA data that show our “average use per citizen” include children and folks that live very modestly and do not travel much. Also, the importance of energy used for Industrial production (including producing products from oil feedstock) which provides jobs and a productive economy cannot be underestimated. Industrial production to compete with China cannot be powered by solar and wind any time soon.

Summary and Conclusions

Where extreme priorities have been imposed to switch to renewables such as in Germany, the UK, Hawaii and Texas, there have been issues of high costs, unreliability and economic impact. Some references for further reading are provided below.

I agree with the Title of Donn Dears book, “NET-ZERO CARBON, THE CLIMATE POLICY DESTROYING AMERICA

Respectfully,

Dick Storm, May 17, 2022

  1. Summer Blackouts by Failed US Energy policy Manhatten Institute: https://www.city-journal.org/energy-policy-failures-may-lead-to-summer-blackouts
  2. H. Sterling Burnett, Climate Change Policies put Policy before Food and lifting people from poverty: https://wattsupwiththat.com/2022/04/25/climate-misanthropes-say-fighting-climate-change-is-more-important-than-food-reliable-energy-and-peace/
  3. Hawaii, Solar Superstar WUWT April 27, 2022: https://wattsupwiththat.com/2022/04/26/honolulu-hawaii-top-solar-superstar-in-the-usa/
  4. Texas has Enough Wind and Solar Planned to Phase out Coal: https://pv-magazine-usa.com/2022/03/22/solar-and-wind-projects-could-eliminate-coal-in-texas/
  5. EIA Graph of Electricity Generation May 2022 by Fuel: https://www.linkedin.com/feed/update/urn:li:activity:6930994374252138496/?commentUrn=urn%3Ali%3Acomment%3A(activity%3A6930994374252138496%2C6931263125946077184)#
  6. Texas Grid Dashboard by ERCOT: https://www.ercot.com/gridmktinfo/dashboards
  7. Brace Yourself for High Electricity Costs this Summer, Forbes May 2022: https://fortune.com/2022/05/11/higher-electric-bills-this-summer/
  8. Lawrence Livermore Lab Energy Flow Chart, 2021 Sankey Diagram of primary energy flows: https://flowcharts.llnl.gov
  9. LLL Discussion of Solar and Wind increases, May 2022: https://www.llnl.gov/news/americans-move-more-solar-and-wind-power-2021
  10. Forced Electrification, The Next Stage of Environmentalists War on Consumers, Capital Research Center, Nov. 2021: https://capitalresearch.org/app/uploads/Capital-Research-2021-8.pdf
  11. National News on Nuclear Power needed for the future carbon free generation January 23, 2022: https://www.nationalnewswatch.com/2022/01/18/race-to-cut-carbon-emissions-splits-u-s-states-on-nuclear-b/#.Ye2BWS-B2J9  
  12. Donn Dears Blog, access to all articles: https://ddears.com/donns-articles/
  13. The Right Stuff Climate Team (Retired NASA Engineers): https://www.therightclimatestuff.com
  14.  93.5% of our Energy is Used in Heat Engines: https://wordpress.com/post/dickstormprobizblog.wordpress.com/736
  15. Dick Storm USCB-OLLI Courses, Energy and Electricity, History of Energy and Electricity and the Future of Energy and Electricity. The four parts of the “History of Energy and Electricity” are on my website: https://dickstormprobizblog.org
  16. EPRI (Electric Power Research Institute) video: https://www.youtube.com/watch?v=42UqxqCCYs
  17.  Real Time US Power Grid link to EIA: https://www.eia.gov/electricity/gridmonitor/dashboard/electric_overview/US48/US48
  18. What is Behind the Energy Crisis: https://www.wsj.com/articles/energy-crisis-fossil-fuel-investment-renewables-gas-oil-prices-coal-wind-solar-hydro-power-grid-11634497531?mod=series_climatefinancemarkets 
  19.   Energy Exec Responds to Elizabeth Warren, Dec 8, 2021: https://www.wsj.com/articles/stupid-inflation-tricks-round-2-elizabeth-warren-toby-rice-eqt-energy-prices-natural-gas-11638990465?mod=MorningEditorialReport&mod=djemMER_h  
  20. . High Natural Gas Prices Cause Rise in Fertilizer and Food Prices, Dec. 16, 2021: https://www.wsj.com/articles/surging-fertilizer-costs-push-farmers-to-shift-planting-plans-raise-prices-11639580768?mod=itp_wsj&mod=djemITP_h
  21. Dick Storm’s views on Electrify Everything, Capital Research Center, Nov. 2021:https://capitalresearch.org/article/forced-electrification-part-4/
  22. Germany’s Nuclear Surrender Opinion, Dec. 24, 2021, WSJ: https://www.wsj.com/articles/germanys-energy-surrender-nuclear-power-angela-merkel-russia-vladimir-putin-11640207188?cx_testId=3&cx_testVariant=cx_2&cx_artPos=0&mod=WTRN#cxrecs_s
  23. Peace Through Strength & Free Markets are what built America, Phil Gramm and Mike Solon, March 2, 2022: https://www.wsj.com/articles/peace-through-strength-economic-freedom-open-trade-china-ccp-economy-america-competes-act-antitrust-biden-11646154226?cx_testId=3&cx_testVariant=cx_130&cx_artPos=7&mod=WTRN#cxrecs_s
  24. Net Zero Carbon, The Climate Policy Destroying America” by Donn Dears. Available on Amazon

Energy & World Peace

The United Nation’s Highest Priority In November 2021 to Save The Planet Was COP-26. Which Is More Important , Peace in the World, The Paris Climate Agreement or Avoiding World Famine and Improving the Quality of Life For All of the People of the World, Including Ukraine?

By Dick Storm

Introduction

Horrible crimes against humanity are being committed in the Russia-Ukraine war. Innocent people are being murdered, homes demolished by military bombardment and artillery, world food production slowed(3,4,5) and what are the leaders of the world concerned about? Manmade Climate Change, the most successful scientific hoax in the history of the world. Three world leaders could improve world peace and start the correction of the mess the world is in today if they would change the priorities of the UN. Who am I referring to: Joe Biden, Justin Trudeau and the United Nations Secretary General, António Guterres.

Remember the UN priorities in November 2021? If not, here is a review of what these three leaders considered the most sinister problem the people of the world would face in the future. Flashback to Scotland, November 2021:

Biden arriving in Scotland for COP-26
Guterres Addressing COP-26, Stating the need for “Climate Action”
Justin Trudeau at COP-26 in Scotland

What is The Purpose of the United Nations and The Paris Agreement? World Peace? Protection of the Environment?….or One World Government to Control The People of The World?

As the world is on the threshold of nuclear war with a world food crisis likely next winter from reduced fertilizer availability and massive unproductive farmland in a war zone, these three leaders and many other sycophants have the Paris Agreement for Climate Change Policies as their top agenda, instead of the best interests of their constituents, world peace and improving the human development index of the people of the world.

I feel strongly that the top priority of these leaders and the U.N. is not concern for the planet that drives them. It is politics and control of the world’s citizens. In short, power over people. For example, the UN Secretary General’s background is copied below. This is from his Bio on the UN web page, From Mr. Guterres Curriculum vitae: “For many years Mr. Guterres was active in the Socialist International, a worldwide organization of social democratic political parties.”

Let me digress and quote the past president of the Czech Republic on the “Climate Zealots” such as Guterres, Biden, Kerry, Gore, Trudeau and many more.

Vaclav Klaus is Past President of The Czech Republic and grew up under Communism then had to wrestle with policies by the “Greens” of Europe. An Economist by training. His words, from about 2007…..“Global Warming is a false myth and every serious person and scientist says so. It is not fair to refer to the U.N. panel. The IPCC is not a scientific institution: it’s a political body, a sort of non-government organization of green flavor. It’s neither a forum of neutral scientists nor a balanced group of scientists. These people are polititicized scientists who have arrive there with a one-sided opinion and a one-sided argument”(49)

Justin Trudeau also could help guide the United Nations to a truly serious priority, but according to Peter Schweizer’s recent book, “Red Handed”, Trudeau also ranks political power above world peace. See page 187 describing the Trudeau family and links to China: Justin Trudeau is quoted in 2013: When asked which country he admired the most replied “There is a level of admiration I actually have for China….because their basic dictatorship is allowing them to turn their economy around on a dime and say, ‘we need to go greenest, fastest—we need to invest in solar’ I mean, there is flexibility that I know Stephen Harper (the Canadian PM at the time) must dream dream about having a dictatorship that he can do everything he wanted, and I find that quite interesting”      

Avoiding Famine

It should be blatently obvious that ranking peace and the world food supply should be more important than the Paris Climate Agreement which is based on a scientific hoax anyway. Ukraine alone supplied about 12% of the global wheat before the war, and was the biggest producer of sunflower oil. About two-thirds of the country’s wheat exports had already been delivered before the invasion, but the rest is now blocked, and farmers may be unable to continue with spring planting, or take in grain harvests in the summer. A headline in the “Times of Israel” reads, “Israel scrambles for solutions as Ukraine war chokes off egg, wheat imports”Industry figures predict egg shortage and sky-high wheat prices just in time for Passover holiday. The prospect for the world later this year is shortages of food across the globe. (3,4,5, 30) 

Ukraine Grain Field from Times of Israel

Energy impacts Fertilizer too! Ukraine and Russia are also major producers of fertilizer, prices for which had already leapt under high energy prices – and the war is sending energy prices higher still, with further impacts on agricultural production costs.

Fertilizer costs in the U.S. have also tripled this year. Partly because of Biden’s energy policies and exacerbated by the Russian invasion of Ukraine.  The impact of energy on food availability goes beyond higher cost Diesel fuel for shipping transportation fuel in the supply chain. Fertilizer and farmland in areas of conflict are a huge problem. (2,3,4,9,10)

Perhaps better kept as a separate subject to write on, but most people are not aware that between 30 to 40% of the U.S. corn crop is used to produce Ethanol for a gasoline additive that lowers the energy equivalent of gasoline and reduces auto mileage. Suffice it to say, energy and environmental policies that promote burning food for fuel also affects the world food supply.(16,17)

How is Energy Linked to World Peace?

I began this essay on the priorities of the leaders of the world and the priorities they saw as top priority in November 2021. Well, if you think the Mainstream Media has been duped and indoctrinated then you are not alone. While the world’s media attention was on the War on Carbon, very serious problems were brewing and under-reported. Kindly take a look at the six charts below: 1. Total primary energy of the world, 2. Coal Consumption by Region, 3. COEmissions of the World, 4. Total Energy by Source for China and 5. Total End Use of Coal Fuel for Products and 6. China, The World’s Superpower of Manufacturing. 

Over 50% of the world’s Fossil Fuel energy is being used by China to manufacture over 50% of the world’s steel, aluminum and just about every other product needed by the free world. These are easily verifiable facts reported by Our World in Data, IEA.org, the United Nations, EIA  and Statista. Energy and Economic Prosperity are inextricably related.

Energy Use by China, U.S.A., Japan, EU and India By IEA
IEA Graph of Total CO2 Emissions from Combustion Processes 1900 2021

So what is driving the recent rapid increase in world CO2 emissions? According to the IEA, it’s mainly China:

The rebound of global CO2 emissions above pre-pandemic levels has largely been driven by China. . . . China’s CO2 emissions increased by 750 Mt over the two-year period between 2019 and 2021. China was the only major economy to experience economic growth in both 2020 and 2021. The emissions increase in China more than offset the aggregate decline in the rest of the world of 570 Mt between 2019 and 2021. . . . With rapid GDP growth and additional electrification of energy services, electricity demand in China grew by 10% in 2021, faster than economic growth at 8.4%. The increase in demand of almost 700 TWh was the largest ever experienced in China. With demand growth outstripping the increase of low emissions supply, coal was called on to fill 56% of the rise in electricity demand.(47)

Total Energy Supply (TES) By Source, People’s Republic of China, 1990-2019

The South China Morning Post” reported April 1, 2022, quoting “China’s Zhang Jianhua, chief of the National Energy Administration: “It signed an agreement to be supplied with 100 million metric tonnes of Russian crude oil over the next 10 years and a 30-year gas supply contract.

The world’s second largest economy suffered a nationwide energy crunch in September of last year amid local decarbonisation and energy saving campaigns, which has forced policymakers to adjust energy policies.

In the 14th five-year energy plan for 2021-25 released last week, Beijing said it would set annual crude output at around 200 million metric tonnes and lift natural gas output to more than 230 billion cubic metres from 205.3 billion cubic metres.

Coal and thermal power will remain the bedrock of China’s energy security strategy, Zhang wrote in the article.” (31)

The above is a direct quote from the SCMP, except the bold and underlining of the last line which was by me.

A recent post in WUWT stated, “China Continues To Laugh At Western “Green Energy” Foolishness”(47)

Why? The graphs above show China’s energy  sources and growth in consumption. Economic prosperity is powered by Energy and China has used a lot of energy to become the world’s largest manufacturer.

Russia is the World’s Gas Station, China is the World’s Largest Manufacturer, Still think the UN Has it Right with the War on Carbon as their Top Priority?

China continues to power their mammoth manufacturing might with coal plants. We should remember our history, do you remember the term “The Arsenal of Democracy” when America provided the remarkable production of airplanes, tanks, guns, ships, arms and materiel to help the Allies win WWll? Some say “History Repeats”…..and if we switch to current events, Russia and China are very cozy with each other at this horrible time for Ukraine.

My point is that energy is a pre-requisite for economic prosperity. China gets it. China, Environmental Extremists, Socialists and Russia have duped the UN and the world leaders into believing the planet is imperiled by 0.041% carbon dioxide that is in the atmosphere. Meanwhile, China burns over half of the world’s coal to power their industries. Russia remains the world’s gas station and holds Europe hostage to Russia’s gas (and more) while the Green’s of Germany shut down safe, proven, reliable and reasonable production cost coal and nuclear power plants, making them beholden to Russian energy. This is nuts.

China has risen from a “Developing Country” in 2000 to the second largest economy in the world. They not only manufacture much of the steel, aluminum, rare earth minerals for batteries, solar panels and wind turbine components, they also manufacture much of the Pharmaceuticals used in the world and in the U.S. Have you tried to purchase a made in U.S.A. Drug lately? This brings me to banking. As a small businessman about thirty years ago, I remember how important banks were to sustain our business. To provide business loans for expansion, cover payroll until the invoice for products or services was paid and for conducting commerce in other countries. Banks and the size of banks is one metric to use to judge a country’s economic prosperity.  China seems to me, to be pretty slick in their approach to dominating the world. They quietly support Russia and other rogue nations while they focus on producing products, acquiring world natural resources and taking over the world by using the weaknesses of Democracy & Capitalism to exploit their Financial muscle. Let’s take a look at China’s financial muscle. To be perfectly honest, the ranking of the world banks surprised me and I thought I kept up with world business news.

China and Banking

China now has five of the world’s ten largest Banks. Yes, being the world’s largest manufacturer has it’s advantages. It creates wealth which can then be converted into International Influence. The China “One Belt, One Road” or “Belt and Roads Initiative” is an example that is playing out around the world. Also, I am told by a financial expert, China holds about 4% of the U.S. Treasury debt.

A lot of people who have not run a business do not understand the need for working Capital. When a company cannot get loans to cover everyday costs or to finance future improvements they go out of business. We might ask some questions regarding the ESG Movement and Regulations that are pending with regard to discouraging or demonizing investments in fossil fuels (and suppliers to fossil fuel producers) by US investors. Is there a sinister, foreign influence side to the ESG movement and Federal Regulations? Here is the list of the top ten banks of the world. Yes, five of the top ten are Chinese.

My point is, manufacturing requires lots of energy. Especially primary metals and heavy manufacturing. As seen from the graphs above, China has grown enormously in manufacturing capacity since they entered the WTO in 2001. To put it in perspective, China built more electric generation capacity in twenty years than the U.S. did since the days of Thomas Edison and George Westinghouse 100+ years ago.

Getting back to finance, did you catch the small news item last week? As it is related to energy, Saudi Arabia is considering acceptance  of the Chinese Yuan for oil and China will be pushing to use other currency than the USD as they continue to grow their economy. (50)

Let’s Review the Sources of the Dependable, Dispatchable and in 2020, Reasonable Cost Energy that We Depend On

If you take what you see in the newspapers and on TV seriously, you would think that we only have a little way to go to convert our economy to zero carbon. This is not true!

I cite the example of a usually conservative Newspaper, the Wall Street Journal. This is a screen shot of a video they had last year which was based on facts, but at the same time misleading the public on the success of “Green Energy”.

WSJ Video, Screen Shot with my Text Added to Be Wary of Headlines such as this

Yes, the 90% of “NEW GENERATION” in 2020 was Renewable, but the true useful energy production was less than 4% of the total energy provided to the U.S.A.

This is a reminder, over 90% of America’s energy is provided by conventional fuels such as oil, natural gas, coal, nuclear, waste to energy, biomass and old hydroelectric power stations.  The Lawrence Livermore Labs Sankey Diagram, in my opinion, is the best single illustration to show true energy flows from the sources to end use. It is copied below for the year 2019. This is simply the true facts of where we obtain our energy:

America has been using right at 100 Quadrillion Btu’s of energy for decades. The next chart below, shows the historical energy use from 1950-2019.  This is a useful chart to consider the transfer of energy from fossil fuels to electric vehicles. Notice that only 3.78% of our Total Energy was provided by solar and wind in 2019. Now imagine the futility of replacing the 37% of our Total Energy now provided by petroleum, with EV’s. The Government Net Zero Carbon plans to replace not only the petroleum but also Natural Gas and Nuclear. The Total Energy supplied by Petroleum is about 37%, Gas 32%, Coal 11.4% and Nuclear 8.5%. These “Conventional sources of energy total 88.9%. Replacing this energy with renewables by 2030 or even 2050 will require an enormous technological breakthrough. The government should not promote policies based on miracles.

To keep our same freedom and high quality of life, it requires each of us 331 million Americans to utilize an average of about a million Btu’s in energy each day.  Averages are often misleading, consider the millions of Btu’s used by the world elitists that traveled to Scotland for COP-26. My understanding is that there were over 400 private jets and that the fuel used for these delegates exceeded the total petrol used by Scotland for an entire year. That should provide a clue regarding the sincere interest of the participants in the UN Climate talks to save the planet.   It is reasonable for each of us living in the Developed World to continue using our allotment of about a million Btu’s of energy each day.

America’s Total Energy Use has been steady at about 100 Quadrillion Btu’s each year for the last 20 years, EIA

My Suggestion, On How to Fix this Energy, World Peace and Food Supply Mess

The War of Carbon in my viewpoint is contributing to International conflicts and harming world peace. If Joe Biden would  rescind most of his Executive orders  including drilling on Federal Lands, Building the Keystone Pipeline and scrapping the Paris Climate Agreement, it would, in my opinion, contribute to world peace and much more. (1,2,3,5,13)  

The Biden administration is testing new depths of mind-blowing political dysfunction, by begging OPEC for more oil, while at the same time maintaining their attack on the US domestic oil industry. (28) Speaking of attacks on the energy producers that we depend on…..

ESG, One of America’s Self Inflicted Roadblocks for a Sane Energy Policy

The (ESG) movement is harming U.S. productive capacity of conventional fuels that are needed. (See above Sankey Diagram to show what we need) These actions are pushed by environmental groups, by government and by big business. (33, 34, 35, 36, 37, 38, 39, 40)  These ESG punitive actions have been ramped up, such as Biden’s “Whole Government Approach to Climate Control Policies” with involvement of the Securities and Exchange Commission, the EPA, IRS Tax policies and more. 

Meanwhile, NGO’s also are attacking US Energy producers. Does this look to you like it could be coordinated with America’s world competitors or enemies? It does to me. Check reference #44 entitled, “What Divestment From Russia Means for Activism Against Fossil Fuels” then the sub title: “It’s time to scale up fossil fuels divestment”(44). When 80% of the energy we depend on is from oil, gas & coal, does this seem like a Patriotic and good action? Not in my book. Another excellent reference on the good that Fossil Fuels do to keep America strong and to improve the quality of life for all of the people of the world.  The publication by Liberty Oilfield Services is entitled “Bettering Human Lives, 2020 ESG Report”(45)  

It could be argued, that keeping America energy independent and the Free World less dependent on rogue nations is important for national security. Look at the mess Europe is in now with their dependence on Putin’s Russian natural gas. The Greens helped push Europe toward Green Energy and they are working hard here in the US too. The environmental extremists were successful in stopping all major new coal plants from being constructed in the US since about 2012. The last major Utility scale clean coal plants I am aware of are Turk in Arkansas and Longview in West Virginia. Even then to obtain operating permits, the environmental extremists were paid off in settlements. These settlements were millions of dollars.(46)  Quite honestly, it is extortion which was enabled by the US government. How does this make America stronger and more energy independent?

How About Clean Air?

Before Biden’s Executive orders to push America toward intermittent green energy, our air was and remains amongst the cleanest in the world. The EPA Graphic copied below shows the trends of cleaner air from 1970-2020. This is regarding the six major pollutants that are a real threat to health. I just like everyone else enjoy and appreciate clean air and clean water. I also like my freedom and the American life style that I have enjoyed all of my life.

From EPA website

From my personal experiences of traveling around the world, I can honestly say America’s air is as clean or cleaner than most other countries that I have visited either on business or pleasure. Note the EPA chart above does show the increases in population and GDP from 1970 to 2019, as the six aggregate named pollutants were steadily reduced. There does come to be a point of diminishing returns on air pollution controls just like most other problems. That is, unless you are a Bureaucrat and wish to keep making more and more and stricter yet Regulations. That is the case, in my opinion of the restrictions on COand the Net Zero Carbon and Extreme Green policies.  These Regulations and Executive Orders are harmful for American competitiveness and harmful for Peace and Prosperity of the world.

Conclusions

  1. The Net-Zero Carbon Climate Policies are contributing to turmoil in the world by weakening America and NATO Allies. The Paris Agreement for working toward Net Zero Carbon is politically driven, not by concern to save the planet.
  2. The Green Energy Movement in Europe should be an example for the U.S. to learn from. They have had extreme cost escalations and, in some cases, rolling blackouts.
  3. Conventional Fuels of Natural Gas, Coal, Oil, Nuclear, Hydroelectric and Biomass provide over 90% of our energy. Ramping up Renewable solar and wind from about 4% to 100% is unrealistic and impossible to achieve without technological breakthroughs.
  4. The ESG Movement (Environmental Social and Governance) is Discouraging needed investments in oil and gas production as well as harming most all Energy Producers. Check references 33 through 39 for more details.
  5. If Net Zero Carbon was really needed or important, then the Government would encourage the building of more nuclear power plants. Hundreds of them as most of the about 20% of our electricity and over 50% of our carbon free electricity is produced by nuclear now. Most of these nuclear plants were started up in the 1970’s and 1980’s. (41, 42, 43)
  6.  World Peace and Prosperity could be better achieved if the world leaders were to focus on the true problems of the world, rather than a war on carbon.

The foregoing are selected facts and data to support my claim that if President Biden were to rescind his 2021 Executive orders and roll back EPA, Dept of the Interior and other Government Regulations to those in effect when he took office, America could begin a recovery of correcting inflation, supply chain issues, increased food production for the world, improved economic growth & Prosperity and even leading the world to peace.

Respectfully submitted,

Dick Storm, April 5, 2022

References and Resources for Further Reading to Support My Conclusions:

  1. Joe Biden Executive Orders List From January 20, 2021: https://www.marketwatch.com/story/all-of-president-bidens-key-executive-orders-in-one-chart-2021-01-21
  2. Peace Through Strength & Free Markets are what built America, Phil Gramm and Mike Solon, March 2, 2022: https://www.wsj.com/articles/peace-through-strength-economic-freedom-open-trade-china-ccp-economy-america-competes-act-antitrust-biden-11646154226?cx_testId=3&cx_testVariant=cx_130&cx_artPos=7&mod=WTRN#cxrecs_s
  3. World Food Supply Insecurity, WSJ: https://www.wsj.com/articles/ukraine-war-stokes-insecurity-in-the-worlds-food-supply-11647343035?mod=Searchresults_pos20&page=1
  4. Fertilizer Prices Worldwide are increasing, WSJ: https://www.wsj.com/articles/ukraine-war-hits-worlds-farmers-as-russia-cuts-fertilizer-supplies-hurting-brazil-11646487815?mod=article_inline
  5. Surging Fertilizer Prices Push Farmers to shift Planting Plans, Raise Prices : https://www.wsj.com/articles/surging-fertilizer-costs-push-farmers-to-shift-planting-plans-raise-prices-11639580768?mod=itp_wsj&mod=djemITP_h
  6. IEA Energy Profile of China: https://www.iea.org/countries/china
  7. Germany’s Energiewiende description by World Nuclear Association. : https://world-nuclear.org/information-library/energy-and-the-environment/energiewende.aspx
  8. German Magazine Der Spiegel article on the importance of coal in Nov. 2021: https://www.spiegel.de/international/business/troubling-addiction-the-world-is-failing-to-phase-out-coal-a-6d2007de-8196-4466-aaca-8b6a2714ec78
  9. World Food Crisis Likely due to Russia-Ukraine War, The Guardian, March 14, 2022: https://www.theguardian.com/world/2022/mar/14/ukraine-invasion-worldwide-food-crisis-warns-un
  10. Eleven-year-old article on the importance of Ukraine Grain, the Guardian: https://www.theguardian.com/world/2010/jul/20/ukraine-grain-farming-exports
  11. Top Banks in the world, lexis Nexis: https://risk.lexisnexis.com/insights-resources/article/bank-rankings-top-banks-in-the-world
  12. Saudi Arabia considers payment for oil with Yuan, Bloomberg, March 15, 2022: https://www.bloomberg.com/news/articles/2022-03-15/yuan-surges-after-report-on-saudis-accepting-currency-for-oil
  13. Biden’s Plan to starve Americans of Fossil Fuels, Paul Driessen, CFACT: https://www.cfact.org/2022/03/27/bidens-plan-to-starve-america-of-fossil-fuels/
  14. “Greenpeace Environmentalism in Europe, Allowed Putin to Invade Ukraine”, CFACT: https://www.cfact.org/2022/03/09/greenpeace-environmentalism-allowed-putin-to-invade-ukraine/
  15. Competitive Enterprise Institute, Background on the Clean Power Plan: https://cei.org/clean-power-plan/
  16. Scientific American, Rethinking our Corn to Ethanol Policy: https://www.scientificamerican.com/article/time-to-rethink-corn/
  17. Corn for Ethanol, Univ. of Nebraska: https://cropwatch.unl.edu/bioenergy/corn
  18. Why your Electric Costs are Surging and likely to go higher, March 15, 2022: https://www.wsj.com/articles/why-your-electric-bill-is-soaringand-likely-to-go-higher-11647250380?mod=hp_featst_pos4
  19. Germany’s Nuclear Surrender Opinion, Dec. 24, 2021: (See last reference #51 below)
  20. Factories close in UK due to High Energy Costs, WSJ: https://www.wsj.com/articles/surging-energy-prices-close-u-k-factories-another-bottleneck-in-a-world-full-of-them-11631792586?mod=Searchresults_pos5&page=1
  21. Behind the rise of U.S. Solar,  Built with a Mountain of Chinese Coal WSJ: https://www.wsj.com/articles/behind-the-rise-of-u-s-solar-power-a-mountain-of-chinese-coal-11627734770?mod=Searchresults_pos18&page=9
  22. If Renewables are so Cheap, then Why is Germany’s Electricity so Expensive? American Experiment : https://www.americanexperiment.org/if-renewables-are-so-cheap-why-is-germanys-electricity-so-expensive/
  23. United Nations News, November 2021, COP-26: https://news.un.org/en/news/topic/climate-change
  24. United Nations, News regarding “World Peace and Sustainability” March 22, 2022: https://news.un.org/en/story/2022/03/1115272
  25. Scottish News, “Private Jets of Climate Elites Blast More CO2 to Travel to COP-26  than 1600 Scots Pump Out in a Year”: https://www.dailyrecord.co.uk/news/scottish-news/private-jets-flying-cop26-blast-25338840
  26. Donn Dears articles on the true facts and Common Sense of the Importance of Energy, including “How Europe Dithers” while the Russians prepared for war: https://ddears.com/donns-articles/
  27. WUWT Blog, “Arab Nations Respond to Global Energy Demand for Energy Security”, April 3, 2022: https://wattsupwiththat.com/2022/04/02/whos-talking-climate-change-now-arab-states-respond-to-global-demand-for-energy-security/
  28. Biden Suspends Oil and Gas Leases to Protect the World from Climate Change, WUWT January 2021: https://wattsupwiththat.com/2021/01/21/biden-suspends-federal-oil-and-gas-permits-because-climate-change/
  29. Toronto Sun, “Oh the Hypocrisy of Climate Change”: https://torontosun.com/news/world/oh-the-hypocrisy-private-jets-pack-scotlands-climate-conference
  30. Times of Israel, “Israeli’s Scramble For Food” : https://www.google.com/url?q=https://toi.by/nwkDto&source=gmail&ust=1649072066572000&usg=AOvVaw1zxNxuPXllU7WBiaJoMgyM
  31. South China Morning Post, Energy News regarding Russia-Ukraine War, April1, 2022: https://www.scmp.com/economy/china-economy/article/3172764/china-vows-bolster-energy-security-ukraine-war-stokes-period
  32. IEA, Total Primary Energy Use for World 1971-2017: https://www.iea.org/data-and-statistics/charts/total-primary-energy-supply-for-the-eu-and-selected-countries-1971-2017 ESG and Climate Related Financial News to Cripple U.S. Conventional Fuels Production:
  33. BANK OF AMERICA CEO, Nov. 9, 2021: https://www.wsj.com/articles/why-financing-the-multi-trillion-dollar-transition-to-net-zero-isnt-that-hard-11636018200
  34. Who is Driving “Climate Funds”: https://www.wsj.com/articles/climate-funds-whos-driving-growing-demand-11637165424?mod=latest_headlines
  35. WSJ Citi Bank to eliminate some Clients that are not “Green” enough, Dec. 7, 2021: 
  36. https://www.wsj.com/articles/citigroups-jane-fraser-expects-to-shed-some-clients-for-climate-purposes-11638912251?mod=business_minor_pos15
  37. WSJ Finance ESG Conflict of Interests, Jan 29, 2022: https://www.wsj.com/articles/wall-streets-green-push-exposes-new-conflicts-of-interest-11643452202?cx_testId=3&cx_testVariant=cx_5&cx_artPos=0&mod=WTRN#cxrecs_s
  38. ESG Investing Nov. 18, 2021: https://www.wsj.com/articles/climate-and-environment-focused-funds-dominate-esg-11637092844
  39. SEC Requirements for Climate Change Disclosure March 21, 2022: https://www.wsj.com/articles/sec-to-float-mandatory-disclosure-of-climate-change-risks-emissions-11647874814?mod=djemalertNEWS
  40. Blackrock Climate Policies to Make Money Jan. 7, 2022: https://www.wsj.com/articles/larry-fink-wants-to-save-the-world-and-make-money-doing-it-11641484864?mod=itp_wsj&mod=djemITP_h
  41.  Small Modular Reactors, WSJ, Aug. 2021 : https://www.wsj.com/articles/utilities-eye-mini-nuclear-reactors-as-climate-concerns-grow-11627905600?mod=article_inline
  42. WSJ Saturday Essay on the Future of Nuclear Power in a Carbon-Free World: https://www.wsj.com/articles/is-nuclear-power-part-of-the-climate-solution-11641571176
  43. World Nuclear Association, Nuclear Power Facts: https://world-nuclear.org/information-library/country-profiles/countries-t-z/usa-nuclear-power-policy.aspx
  44. An interesting post by the Sierra Club, entitled, “What Divestment from Russia Means for Activism Against Fossil Fuels From Russia” March 22, 2022: https://www.sierraclub.org/sierra/what-divestment-russia-means-for-activism-against-fossil-fuels
  45. Liberty Oilfield Services, 2020 ESG Report, “Bettering Human Lives”: https://www.libertyfrac.com/bettering-human-lives-2020-esg-report/
  46. Settlement of John Turk Power Plant with Environmental groups, Arkansas Times, 2011: https://arktimes.com/arkansas-blog/2011/12/22/sierra-club-audubon-settle-with-swepco-on-turk-power-plant  and https://www.aep.com/news/releases/read/1235/AEP-
  47.  China Continues To Laugh At Western “Green Energy” Foolishness, April 2, Manhatten Contrarian: https://wattsupwiththat.com/2022/04/03/china-continues-to-laugh-at-western-green-energy-foolishness/
  48. China’s Energy Dream, Patricia Adams, GWPF: https://www.thegwpf.org/content/uploads/2021/12/Adams-Chinas-Energy-Dream.pdf
  49.  Vaclav Klaus Book, “Blue Planet in Green Shackles”, published in English in 2007 by Competitive Enterprise Institute
  50. Saudi Arabia considers acceptance of Yuan for Oil payments, WSJ March 15, 2022: https://www.wsj.com/articles/saudi-arabia-considers-accepting-yuan-instead-of-dollars-for-chinese-oil-sales-11647351541

51. Germany’s Nuclear Surrender:

Mentoring the Middle School Students

Helping our youth to understand the importance of energy and electricity to energize our good lives

Why Should We Invest Time with the Public School Students?

From a personal viewpoint, I have always considered it a high priority to do my best to support energy education of the public and especially our public school students. A great group to start with if we wish to improve the general public’s understanding of the importance of energy. Perhaps if we start with the youth, they will educate their parents on the facts; That conventional sources comprise about 90% of the total energy that makes our high quality of life possible. By conventional, I mean, Natural Gas, Nuclear, Coal and Hydroelectric.

All of us who have been employed in the supply chain of producing energy understand the rarity of energy savvy people we meet who are not or have not been closely involved with our industry. So, when an opportunity to present a short class on energy and electricity generation came up at our local Middle School, I accepted the invitation. Here are some of the slides I will use for this group of 8th Graders.

The general public’s knowledge of energy and it’s importance seems to be limited to gasoline prices. When in a social setting and I discuss the U.S. need for 100 Quadrillion Btu’s of energy and where it comes from, most people’s eyes glaze over and are not very interested. However, with the Russia-Ukraine war, it seems folks are more interested now than they were a few months ago. Perhaps timely to give a course on energy fundamentals.

Each American uses about 800,000 to 1 million Btu’s every day

Our Lifestyles Depend on Energy

How did I come up with 800,000 – 1,000,000 Btu’s per person, per day? Here is how: America uses right at 100 Quadrillion Btu’s annually. If 100 Quadrillion (15 zeros) is divided by the population of the U.S.A. of about 330 million people, the result is about 303 million Btu’s per person. This is the average energy use for each of us. Then, divide 303 million by 365 days per year and it is 830,000 Btu’s per day. The above illustration shows how we may use our portion of fuels to consume our share of the Nation’s energy. If we are traveling by car for an interstate trip, we can easily use more than a million Btu’s in a day. Likewise, ordering a large shipment of furniture or heavy goods from Amazon or other on-line Retailer will require energy to be used on our behalf to deliver our products to the door. You get the picture.

Another way to illustrate 300-330 million Btu’s is to show the equivalence in barrels of gasoline, Diesel Fuel, propane or coal. Also, nuclear. This is shown below.

Annual Equivalent Per Capita Energy Use of 300-330 Million Btu’s/person

So Where Did You Come up with 100 Quadrillion Btu’s?

The U.S. Department of Energy has been measuring, calculating and reporting total primary energy use for decades. I have been watching this and America’s energy use has held right at 100 Quadrillion Btu’s +/- 10%, for the last twenty years or so. Below is the Sankey diagram which shows 2019 total primary energy flows. The sources are on the left and uses are on the right. This is how the breakdown of uses was established: 37% electricity generation, 28.1% transportation, 26.4% Industrial, 11.4% Residential and 9.41% Commercial.

I stated above that the U.S. has used right at 100 Quadrillion Btu’s for decades. The chart below published by the EIA (Energy Information Administration) shows the total energy used 1950 to 2019. The differences in “Production and Consumption” are imports. As of December 2020, America produced as much energy as we consumed. Again, right at 100 quadrillion Btu’s.

Let’s Drill Down to See Where the Energy Is Used in SC to Generate Electricity

Currently and at least through 2030, over 50% of South Carolina’s electricity will come from nuclear power generation.

S.C. has four large nuclear power plants with a total of seven generating units. Here is a map of where they are located.

The second largest source of our electricity is natural gas fuel. This is burned very efficiently in power plants such as this. The newest natural gas generating plants can obtain thermal efficiencies over 60%.

Coal fuel was over 50% of Santee-Cooper’s electric generation about ten years ago. Since then, natural gas fuel became lower in cost and abundant and has replaced much of the coal power generation. However, today natural gas prices are increasing and it is likely that coal fuel will be more economical to generate our electricity not generated by nuclear and renewables.

The Santee-Cooper coal plants that provide electricity to our local electricity distributor, Palmetto Electric Co-Op are shown below.

Santee-Cooper Coal Plants

Isn’t Most of Our Power Provided by Solar, Wind and Hydro-Electric?

No! That is a popular misconception. Even the Wall Street Journal has misled people into thinking that most of our electricity is generated by renewables (wind, solar and hydro). The data above show the true facts of the sources of our electricity and total energy.

Note that of our total energy in 2019, wind and solar together only provided about 3.8% of America’s total energy. The 96.2% was provided by conventional forms of energy such as nuclear, natural gas, coal and hydro-electric. The WSJ Headline is accurate in stating that 90% of the New Electricity Generation in 2020 came from Renewables. That is because they used “Nameplate Capacity” for the Renewables and the simple fact that the “Old coal, Nuclear, Coal and Hydroelectric” plants are very robust, reliable and have long lives when properly maintained.

The Santee-Cooper Pinnopolis Dam, Hydro-Electric plant is shown above. When I use the term “Old Hydroelectric plants”, this is where I was coming from. If you look at “Total Renewables Energy” on the Sankey diagram above, you will see that most of the renewable generation is from old hydroelectric plants. In 2019 that was about 2.5% of our total primary energy as compared to 1.04% solar.

These are the hydro plants operated by Santee-Cooper. Located about 100 miles north of Hilton Head near Moncks Corner, SC.

Solar

Much is written in the news about solar and many people are of the impression that solar is a major source of Bulk Electric generation. The fact is that yes, much money is being invested in solar but the total generation is very small when compared to nuclear, gas and coal. Here below is a much hyped solar farm on the east side of I-95 about 50 miles north of Hilton Head. It is about 15 acres and during a bright sunny day will produce about 3.5 MW.

By the way, if 3.5 MW seems like a lot of electric power consider that on a hot summer day Hilton Head Island uses about 180 MW during peak Demand.

Palmetto Electric Co-Op distributes electricity on Hilton Head Island. They obtain most of their Bulk Power wholesale from Santee-Cooper which is owned by the state of SC. Generation capacity of Santee-Cooper power plants is listed below. Note, most generation capacity is coal, nuclear and natural gas.

Electricity is Secondary Energy and uses about 37% of America’s total Primary Energy. The other 63% of Energy is Important to Fuel Our High Quality Lives!

The Federal government, at this point in time, is stating and making policies that would “Electrify Everything”. Especially transportation. Most large automobile manufacturers have stated that they plan to phase out the Internal Combustion Engine by 2035. That is only 13 years into the future.

Think about the chart above. Yes, 96% of our Primary Energy comes from conventional sources. (I consider nuclear, coal, gas, biomass and hydroelectric all conventional sources) The highest percentage of primary energy is from petroleum. America uses about 20 million barrels per day of oil. To illustrate what 20 million barrels per day looks like, take a look at the photo below. This is a picture of me standing in front of a portion of the above ground Aleyeska pipeline in Alaska. It is above ground because of passing through frozen tundra and the heated oil must be above ground for environmental and pipeline integrity concerns. This pipeline is capable of moving about 2 million barrels of oil per day. So, to imagine the quantity of oil that America uses, picture 10 of these pipelines side by side. Yes, 10 pipelines like this. At 42 gallons per barrel, that is a lot of oil.(2)

Most rimary energy is used in “Heat Engines” that convert heat energy to motive force. Another point to imagine, is if the about 275 million light trucks and cars registered in the U.S. were converted to EV’s…..This could create Demand for an enormous amount of electricity. However, in some cases the electricity needs to be “Dispatchable” when it is needed, such as in charging EV’s on a road trip. In other cases such as long range aircraft and ship propulsion, electricity is not an option with current technology. Fossil Fuels are important to fuel our lives.

Heat Energy from fuels is enormous. Just a reminder of the definition of a “Horsepower” and a BTU (British Thermal Unit).

A horsepower is equivalent to the work accomplished by lifting a weight of 550 pounds in one second or 33,000 Foot pounds per minute. One BTU converted at 100% thermal efficiency to work is equivalent to 778 Foot pounds. A gallon of gasoline contains between 115,000 and 125,000 Btu’s. So one gallon of gasoline is worth over 90 million foot pounds of work.

Perhaps a reminder of agricultural productivity is timely. At the turn of the 20th Century, about 40% of our population was required to work on the farms to feed our nation. Then, we changed from muscle power of animals to mechanized farming, using tractors. The work of a team of horses could be accomplished with a single gasoline powered tractor.

A reminder from U.S. history…..Our Economy became the largest in the world as America switched from muscle power of draft animals and humans to mechanization powered by fossil fuels.

Summary and Conclusions

  • Energy and Economic Prosperity are inter-related
  • America has used about 100 Quadrillion Btu’s annually for decades and to preserve our high quality of life, will continue to require 100 Quadrillion+ Btu’s each year into the future
  • Fossil fuels provide about 80% of our total primary energy
  • Conventional forms of energy, including Gas, Nuclear, Coal and old Hydroelectric plants, provide over 90% of our primary energy
  • The Mainstream News, Entertainment and Misguided Politicians are wrong to attack fossil fuels. Donn Dears book(4) Net Zero Carbon, Climate Policies Destroying America” lays out facts and policies to support the title

When I am in the classroom, I will not discuss the politics of “Climate Change”, only the facts on energy and electricity. I hope all of my friends employed in energy industries do likewise to attempt to set the record straight on the importance of energy and electricity.

Yours very truly,

Dick Storm, March 9, 2022

References for further reading and research:

  1. Dick Storm USCB-OLLI Courses, Energy and Electricity, History of Energy and Electricity and the Future of Energy and Electricity. The four parts of the “History of Energy and Electricity” are on my website: https://dickstormprobizblog.org
  2. Global Energy Monitor, Alaska Pipeline facts: https://www.gem.wiki/Trans-Alaska_Oil_Pipeline_System
  3. Dick Storm’s views on Electrify Everything, Capital Research Center, Nov. 2021:https://capitalresearch.org/article/forced-electrification-part-4/
  4. Net Zero Carbon, The Climate Policy Destroying America” by Donn Dears. Available on Amazon
  5. Alabama Power, Miller Steam Plant, An intersting video of how a large coal plant works: https://www.youtube.com/watch?v=0ftl-WM6wms
  6. A more factual asessment of Sea Level Rise to counter the exaggerations by movies on Climate Catastrophe’s, about 1.36 ft/100 years:  https://www.tidesandcurrents.noaa.gov/sltrends/sltrends_station.shtml?id=8534720 and WUWT Sea Level Rise: https://wattsupwiththat.com/2021/06/14/sea-level-rise-fastest-in-2000-years-or-not/
  7. National News on Nuclear Power needed for the future carbon free generation January 23, 2022: https://www.nationalnewswatch.com/2022/01/18/race-to-cut-carbon-emissions-splits-u-s-states-on-nuclear-b/#.Ye2BWS-B2J9