Harold Hamm’s new book, “Game Changer” is a fact filled true story that is better than fiction. An easy read and it clearly shows the importance of energy and economic prosperity. An incredible case study of how hard work, tenacity, risk, policy changes and applied science America was able to, in just a few years, rise from energy scarcity to becoming energy independent and become a net energy exporter. Hamm ties together the facts of science, policy and business success. A very important read for anyone interested in the importance of energy.
A Few Takeaways and Excerpts…..
pg 109 “The Renaissance: America Achieves Energy Independence”
pg 102 With modern directional drilling practices, we can now drill over three miles laterally (without any sidetracks) and literally hit a target as small as a penny—or quarter, adjusting for today’s inflation” Horizontal drilling is an American invention and applied by Hamm and his colleagues with incredible science, skill and grit.
pg 117-Made the U.S.A.... “Good things flow from American Oil”….”Extraordinary, Incredible, game changing, life improving things—for All Citizens—Flow from American Oil”
“In 2019, we became a net energy exporter, in other words, we were energy independent and able to sell the overflow of both oil and natural gas overseas to our allies”
pg 153 “Pipelines Our National Circulatory System”….”America has over 190,000 miles of pipelines transporting oil and over 320,000 miles of pipelines transporting natural gas. In contrast, the Interstate Highway System is about 47,000 miles”
pg 95 “Shale Yes! Cracking the Code of the Bakken” , Stephen Moore writes in “How North Dakota Became Saudi Arabia in the Wall Street Journal, Oct. 1, 2011”
“Our estimates today are at the higher range near thirty five billion barrels and could go higher with secondary and possibly tertiary recovery, CO2 injection, and continued advances in technology.”
pgs 128-130 Domestic Production since Joe Biden Assumed Office: HH chronicles policies, statements and Biden Administration policies starting in 2019 through October 2022 that harm domestic oil and gas production. It is a very detailed list of 23 anti fossil fuel actions: Copied below are just five of the bullets……
The list begins July 31, 2019 “When asked if there would be any place for fossil fuels in the Biden Administration, Biden responded, “No…we would make sure it’s eliminated and no more subsidies….(for) any fossil fuel”
February 5, 2020-Biden stated, “We are going to get rid of fossil fuels”
January 20, 2021- On the day of his inauguration, President Biden revoked approval for the Keystone XL pipeline
May 28, 2021- President Biden proposed a budget that would increase taxes on energy producers by $35 billion
March 21, 2022- The Biden Administration’s Security and Exchange Commission proposed a rule change to divert investment away from carbon energy
pg 193-Harold Hamm’s Short List of Recommendations for U.S. Energy Policy:
“Don’t become dependent on foreign regimes. We see what happens when a country doesn’t have oil and gas reserves. Just look at Europe today.
Provide a free market for all forms of energy. Take the government out of the business of picking winners and losers through market-distorting subsidies.
Return to common sense regulatory policy by repealing and rescinding crippling and punitive regulations.
Provide for a pipeline infrastructure system using Interstate Commerce protection for the safe movement of all energy including oil and natural gas.
Streamline the permitting process for oil and natural gas drilling and completion on federal lands, which result in $20 trillion in unrealized energy wealth for America”
Please Buy and Read Hamm’s Book!
Yours very truly and in hopes that Hamm’s book will be read by many,
The University of South Carolina provides OLLI programs (Osher Lifelong Learning Institute) which include Geopolitics, Science and many other courses. I am an instructor on energy and electricity. Two other instructors that I respect and have enjoyed their courses are retired senior military officers. General Craig Whelden served in the Pacific and has taught several courses on the “Rise of China”. I took notes from his courses and combined his information with my experiences in the relationship of energy & electricity generation. These thoughts are posted here. Retired Navy Captain, Greg Blackburn has taught several courses on Economics and the “Fate of Nations, Their Rise and Fall and Rise Again”. I took notes on Captain Blackburn’s and General Whelden’s courses and posted my thoughts as of January 2021 here.
As I read a LinkedIn post by CS Krishnedev earlier this week, these three OLLI courses came to mind. (Rise of China, Fate of Nations and Energy & Electricity) Mr. Krishnadev’s post is here. In his post, Krishnadev discusses how China is far ahead of the west in the design, construction and deployment of nuclear power plants.
Photo from Krishnadev, CS Post on LinkedIn, August 13, 2023
Leaders in Heavy Manufacturing of Nuclear Power Plant Reactors and Steam Generators
America invented nuclear power and held the lead for many years in the design, manufacturing, construction and operation of nuclear power plants. The Combustion-Engineering Chattanooga facility comes to mind as one of the most capable and advanced nuclear and fossil manufacturing facilities in the world. That was then.
Of course, the magnificent C-E Facilities are gone now. So are the thousands of talented and experienced engineers, technicians and craftsmen. Westinghouse is a fine American name but was sold off long ago. Babcock & Wilcox is still based in the U.S. and involved, but the company is downsized from the 35,000 or so employees that worked there in the 1960’s and 1970’s. I started my power generation career with B&W in 1966, so it is with personal knowledge and experiences that I remember this. The photo below is a Reactor vessel being loaded onto a barge from the Mt. Vernon Indiana manufacturing facility.
From “B&W Steam, It’s Generation and Use”. 39th edition
Specialized manufacturing tools, such as the Gun Drill shown below is used to drill approximately 16,000 precise holes through a 24″ tube sheet to manufacture a steam generator, such as the one below for the B&W Once Through Steam Generator.
From B&W “Steam, It’s Generation and Use” 39th Edition, 1978
The highly successful B&W Once Through Steam Generator as used at Oconee, Three Mile Island, Crystal River and other Nuclear Steam Systems is shown below.
Nuclear Steam Generator from B&W Steam, It’s Generation and Use” 39th edition
View inside the Containment building showing the Reactor and Once Through Steam Generators. To provide a reference of the size of these, the nozzle at the top of the steam generator in the upper left of the photo below is 36″ diameter.
B&W “Steam, It’s Generation and Use” 39th edition
These pressure vessels were built using the most advanced manufacturing, welding and non-destructive testing techniques in the world. However, after the 1979 Three Mile Island incident, very few new NSS’s were manufactured in the U.S.A. Eventually the Combustion-Engineering manufacturing facility in Chattanooga was shut down and B&W downsized. The Westinghouse Electric Corporation which was the pioneer designer and manufacturer of nuclear power plants (starting with the U.S. Navy Nautilus and Eisenhower’s “Atoms for Peace” Initiative) was broken down into numerous business units and sold off. The nuclear power business unit was sold in 1999.
The World Nuclear Association lists the current major manufacturers of heavy pressure vessels. This list is shown below. Much of the heavy manufacturing equipment such as Electroslag Welding, 15,000 ton presses, precision gun drills and other heavy manufacturing equipment once available in Chattanooga and other locations in the U.S. has been lost.
Here are the Heavy Pressure Vessel Manufacturers listed by the World Nuclear Association that are capable of fabricating nuclear reactor pressure vessels, today.
The enormous presses, rolls, welding, machining and forging apparatus that the U.S. once was a leader in are now gone and will take a huge government policy commitment and large capital investments to replace. A new workforce of tens of thousands of engineers, technicians and craftsmen will have to be trained as well. In other words, the entire Supply-Chain, including education will have to be rebuilt. This, if accomplished would be on a scale of President John F. Kennedy’s “Moon Shot” commitment of 1960.
Summary & Conclusions
If the U.S. was really committed to “Electrifying Everything”, that is, everything possible. Then the most practical and proven fuel to provide carbon free electricity is nuclear. An excellent OpEd was published in the TN Star Tribune newspaper a couple years ago on this. I copied it, along with my thoughts, onto my blog, here.
The Net-Zero Carbon path if continued, will further weaken the U.S.A. and strengthen the CCP. I do not have anything against the Chinese people and the many millions that have been lifted from poverty by China’s Development of many coal, nuclear, hydroelectric and renewable power production power plants. However, I am frustrated that the current U.S. leaders, have put the U.S. on a path of decline in manufacturing and economic strength. Also, a decline in influence in the world and a decline in military capability. Much of the decline is due to energy policies that are at a literal “War on conventional forms of energy”. The “Green New Deal” (aka Inflation reduction Act) incentivizes the myth of renewable power in an impossible to achieve replacement of fossil and nuclear fuels.
I have been a supporter of “All Fuels are Important” and that the U.S. should be utilizing all fuels that are available within our borders. Including coal, oil, gas and uranium. It is a myth to believe that wind and solar can replace coal, oil, gas and nuclear fuels. One of my blog articles on the impossibility of reaching Net-Zero Carbon is here. The government’s policies which penalize conventional fuels and incentivize renewables, if continued, will weaken the United States.
The course taught by my friend Greg Blackburn, “The Fate of Nations”, comes to mind. A screen shot of one of the slides he used is copied below. The current U.S. Climate Policies are contributing to the Rise of China and the Decline of America. It is my hope that the voters will elect members of Congress and a new President that will wake up and stop the madness.
The Bureaucratic Agencies of the Biden Administration since Biden’s inauguration have created ever worsening Regulations that are weakening our country and literally forcing the economic decline of our nation. It is as if the Biden policies are being dictated by Xi Jinping and Vladimir Putin. The Biden policies are weakening America, day by day from within. I have used the term, “Self-Sabotage”.
America has the largest coal reserves in the world, about 22% of the world’s coal. America also has all the uranium needed to fuel our nuclear plants and enough oil and gas to provide the primary energy America needs for decades. So, why have we allowed a minority of people and leaders to smear and demonize the conventional fuels that we depend on every day? Worse yet, allow them to weaken our country.
Introduction
Are Blackouts and Gas Lines Inevitable? Is that what it will take for American Voters to Wake up and Elect Leaders to Reverse the Atrocious Policies of the Green New Deal? (aka “The ridiculously named, “Inflation Reduction Act”)
Last week I was having a conversation with a friend who is developing a proprietary process to reduce the CO2 emissions of coal and with a goal to make coal combustion as clean or cleaner burning, than natural gas. My friend Steven asked me, “If we reduce carbon dioxide emissions by 70%, reduce all other pollutants to near zero and basically make coal as clean or cleaner than natural gas, Do you think we could get public acceptance?” I thought about my answer and paused. As I recall, my answer went like this. “That will be hard to do, because there has been 50 years of indoctrination and demonization of first coal and now all fossil fuels, including gas. However, as people experience energy shortages, gas lines, food shortages, inflation and Blackouts, their perceptions should change”. Energy provides Life as we have come to know and enjoy it!
Energy shortages and energy poverty is the path our government has set us on, unless, somehow, we change the perceptions of the sources of energy that America has within our borders. Sustainable living, by my definition, is to sustain the 21st Century life-style that science and technology has made possible over the last 100 years. We enjoy very high quality of lives, including reasonable cost food production for us to share with less fortunate countries. Our quality of life and existence depends on energy. Think about how you missed energy during the last hurricane or winter storm when you might have been without adequate energy for a day or two. That does not happen very often in the U.S., but if current climate policies which demonize and restrict conventional forms or energy are continued, then energy shortages could become the new normal.
Perceptions Matter
On the topic of clean coal combustion I remembered a presentation to the American Coal Council membership that I presented in 2008. The title of the presentation is “Enhancing the Perceptions of Coal”. The purpose of the presentation was to stimulate interest amongst the members of the American Coal Council to encourage ACC members to become more engaged in public energy education. This has been a concern and passion for me since the 1990’s when the “War on Coal” was accelerated by the EPA of the Clinton Administration. Back then, we thought “New Source Review” was as bad as it would get for coal power. (EPA-NSR info here. Check this list of 31 Utilities that were wrongly forced to pay enormous cash settlements and/or shut down coal plants).
How Did We Get Into This Mess?
I was mistaken on the power of government to proceed with such un-American policies and I along with many others underestimated the harm to public perceptions that Obama, the Environmental Extremist/Activists, Liberal Democrats, NGO’s, the World Economic Forum, the Main Stream Media and “Woke corporations could cause. My blog post on my view of the history of the U.S. War on Coal is here and David Blackmon’s sub stack post “Carbon Fascism, Where it Came From”here. The “Shale Gas Revolution” came to fruition after 2008 and abundant gas supplies provided reasonable cost electricity generation from quickly built gas turbine combined cycle power plants. Here is a chart of natural gas prices over a five year period 2006-2011 leading up to the Shale Gas Revolution in electric power generation.
From 2012 Presentation by Storm Technologies to a Florida Utility with the purpose of explaining why Excellence in Operations & Maintenance of Coal Plants is Important Remain Competitive. Data from EIA
The cheap Shale Gas ( I hate the word Cheap, but feel this is an appropriate place to use it) created a domestically available, abundant Primary energy fuel that electric Utilities could and did burn instead of coal and at no increase in production cost to be passed on to the consumer. When gas prices dropped below about $2.25/million Btu.
The production cost component of electricity from the primary energy source, natural gas is about 90% fuel cost. Also, gas turbine combined cycle plants could be permitted easily and rapidly built for much less cost than a clean coal plant. About $1,000/kWh capacity vs. about $3,000/kWh capacity for coal. Of course, permitting a coal plant was and remains nearly impossible with strangling Federal Regulations. Therefore, as gas prices tumbled due to an enormous supply increase, gas became less cost than coal as a power generation fuel. Many GTCC plants were built during this time.
Therefore, the Shale Gas Revolution provided cover for the Green Policies that became very extreme during the “Reign”of Gina McCarthy, The EPA Administrator, During the Obama Regime
Here is a graphic from one of my OLLI courses on power generation by fuels, 2004 and 2019.
Five points of my ACC 2008 presentation: This presentation summarized the timeline of Perceptions of energy 1950-2008 and suggested actions to change the perceptions of the public on coal.
Have We Passed the Tipping Point? Are We Doomed to Energy Poverty and Unreliable Electric Power Generation, Blackouts & Brownouts? Can Politicians Fix the Flawed Policies? Will They?
I read the Hill article criticizing Donald Trump’s speeches where Trump stated that if elected, “I will end green new deal atrocities the first day”. At first I was encouraged at the headline but then reading the article it went on to explain that the “Green New Deal” is codified as public law, enacted by Congress and signed into law by President Biden as the so called, “Inflation Reduction Act”. Therefore, according to the Hill and my rudimentary understanding of how laws are created or changed, it will take both Congress and the President to shut down what President Trump refers to as “Green New Deal Atrocities”. I agree with Trump, but getting Congress to take action seems like a tall order.
The Consequences of Continuing the Net-Zero Carbon Path
Frequent disruptive energy shortage events such as Blackouts, gas lines, loss of industrial productive capacity, deindustrialization,
food shortages and massive job losses. These are All possible with a shortage of energy.
When these occur, Congress may wake up? It should not take energy shortage emergencies to engage Congress. This time, energy shortages are likely to be worse than the 1973 and 1978 Oil Embargoes. In my lifetime I remember the 1973 Oil Embargo and Congress providing a clear path for the Alyeska pipeline to be built in record time of two years 1975-1977.
A coming energy crisis worse than 1973 is likely and it is not just me saying that. Fatih Birol head of the IEA, Daniel Yergin of Cambridge Energy Associates and others have stated this warning.
If we do have energy shortages worse than the mid 1970’s, then Congress may reign in the EPA and other government Bureaucrats? But with Biden as President, it will be hard. I have written other posts on the importance of energy here and here. America has been moving forward on energy policy like a Train Wreck in slow motion. Michele Bloodworth of America’s Power wrote in her Commentary“Are We Headed for A Reliability Train Wreck” in POWER Magazine.
Happening In Plain Sight!
Watching this is frustrating, painful and wrong. America is the strongest nation in the world with millions of smart technically trained engineers, it is not necessary for our great country to experience energy shortages. Yet, that seems to be the path that the government has chose.
The high quality of living that we have been accustomed to requires a lot of primary energy. About 300-330 million Btu’s per capita/year. Previous posts hereand here cover my thoughts on the energy we use and depend on. All totaled this is about 100 Quadrillion Btus/annum for the entire population of the U.S.A. This has been steady for about the last 25 years. Note the chart below from the EIA:
The fuels that provide this needed energy are about 93% conventional fuels, natural gas, nuclear, gasoline, Diesel, Jet Fuel, Nuclear and Coal. These fuels and their importance is described in my posts here and here.
Self-Sabotaging America’s Energy Infrastructure, Specifics
Some of the specific actions by the government as part of the misguided War on Carbon:
In 2008 I was worried about the “Perceptions of the Public on Coal. The harm done by indoctrinating the public and literally demonizing carbon has now put America on a path of energy poverty as we had in 1973 and 1978 with the oil embargoes.
Electric Vehicle Mandate (BTW This started in 2012 with the Obama Administration and the impossible to achieve Fleet Mileage mandate of autos required to achieve 54.5 mpg by 2030)
EPA Rules to Shut Down Coal Plants
Formation and expansion of RTO’s which have destroyed accountability for generation reserves from Regional Utilities. Such as PJM, ERCOT & MISO
BLM Rules to Restrict Mining
Biden Order to Shut down Keystone Pipeline
U.S. Refining Capacity is Reduced 5%, yet demand has been increasing
Federal ESG guidelines to restrict investments in fossil fuels
EPA Rule is proposed (in spite of SCOTUS past ruling) to Require CO2 Capture of Gas Power Generation Plants by 2040
Biden rescinded Trump era reductions in Federal Regulations on American energy production
Biden Executive Order to Reduce Fossil Fuel Production on Federal lands and increase Green energy to tackle the Climate Cris. Full EO here.
EPA aggressive enforcement of “New Source Review” (NSR) to penalize coal plants
Sweetheart deals between NSR settlements and EPA Lawsuits brought against coal plant operators, to fund NGOs that continue to influence further Self-Sabotaging Regulations. Example of one of last clean coal plants built in U.S. here.
Many more…..
The American Energy Alliance published a list of 100 ways the Democrats and Biden have made producing energy in America more difficult. The is as of May 2022 and the war on carbon continues. The AEA list is here.
So, what are we going to do about it?
To be perfectly honest with you, I am frustrated that our government is controlled by elected, appointed and career Bureaucrats, many who believe believe in the misguided green energy myth. To put the number in perspective, there are about 19.23 million state and Federal government employees, according to Statista.
Back to my ACC presentation in 2008. One slide I used is copied below. This quote, was used by President Kennedy in one of his famous speeches and he attributed it to Edmund Burke:
Yes, it is a small minority of leaders that have waged a very effective war on carbon. It is not only a matter of demonizing carbon, their goal is to control our lives and to de-industrialize, de-populate and downsize the energy use to lead to a smaller population on the planet. Donn Dears, Dr. Tim Ball, myself and many others have written about the U.N. Agenda 21 and the U.N.-IPCC. My blog with references for further reading is here. The small number of “leaders” have influenced electric utilities, the Entertainment Industry, the MSM and many “Woke” businesses and corporations to promote Green Propaganda. Again referring to David Blackmon’s excellent piece, “Carbon Fascisim, Where it Came From” here, Blackmon enumerates the small number of people who have initiated the ludicrous (some would say, evil) policies on the Free World. The frightening aspect of Federal rules and laws is that only 435 members of Congress plus nine Supreme Court Justices can codify anti-American energy policies that will be very hard to reverse. Congress, in my view, has been negligent in delegating full authority for the protection of public health to the EPA. It started out well in 1970. However, since then the EPA employs, about 15,000 and like other government agencies, have been weaponized against the best interests of America by Biden and Democrats in Congress. The war on conventional energy began with Clinton, continued with Obama and now has reached criticality with the Biden Administration.
It is this reality that concerns me to ask the question, “Are we doomed to face Energy Poverty?” What about the 3 Billion souls in Developing countries that use less electricity a year than we use to power our refrigerators for a year and cook over open fires fueled by cow dung or firewood? Then there is the concern of fertilizer production which is crucial for food production. Dr. Samuele Furfari has written an excellent article in European Science here. Another Blog on Substack, “Carbon Myopia” by Robert Bryce is here and Liberty Energy’s report on “Bettering Human Lives” is here.
Dr. Furfari’s article is entitled “Agriculture: Who Wants to Replace 22 Billion Human Equivalents?” The basic message from Dr. Furfari is, “energy has replaced muscle power over the last 120 years and the simple math to arrive at the muscle power of 22 Billion people is: A steam horse is worth 736 watts and an average man is worth 100 watts, so we have 30 million tractors x 100 horsepower x 7.36 = 22 billion“
Slide from Dick Storm presentation to Rotary Club on “Demystifying the Importance of Energy”
Furfari’s article is worth reading for some excellent background on the importance of energy to produce food for the world. More articles and books by Dr. Furfari are included in the references below.
What are the Western World leaders thinking?
They Certainly do not understand the basics pf energy and electricity generation. Check these Blogs of Robert Bryce (Carbon Myopia) here and David Blackmon’s (Carbon Fascism) here. Also, as noted above, the books and articles by Samuel Furfari, Donn Dears and Vaclav Smil are all very well researched and well written.
So Why Am I Worried?
Even my conservative red state of S.C. is headed for a path of electricity shortages. I wrote about this on my blog here. The Federal laws that have been enacted by Congress and approved by President Biden plus extreme anti-carbon based rules by EPA Regulations, in my view, these are simply un-American. Why? To be polite, I chalk it up to our leaders being ignorant in the fundamentals of physics and energy. A darker reason is if a number of the elected officials and NGOs that influence the EPA and government officials may have been influenced by NGO’s and including foreign Dark money. The next post on this blog will be an Appendix to include references for further reading to support my assertions.
In Our Republic, The Citizens Get The Leaders They Deserve! (Really, Do we?)
About 25 years ago when Bill Clinton was President, I remember working at a Canadian Utility. I made the mistake of commenting on my views of the EPA anti-coal policies of Carol Brower, who was then the head of the EPA in the Clinton Administration. My Canadian friends remarked, “In a Democracy you get the leaders you deserve”. I was humbled, embarrassed and thought, that was dumb of me to complain of U.S. politics amongst Canadians. My mistake and I attribute the gaff to just feeling at home with friendly folks that just happened to be Canadian citizens, only a two hour flight away. The point is, the remark, “In a Democracy We Get What We Deserve” has stuck with me. In our Republic, “Do We Get the Leaders We Deserve?” Let’s take a look at some reasons to be concerned. All of my energy engineer friends know how foolish and wrong the “Green New Deal” is. One friend, Donn Dears, told me privately, “This is a battle America must win!” Dears has written about a dozen books and is an acknowledged expert on energy and energy policies. Other energy and environmental science experts have also written extensively. Amongst them are Dr.’s Vaclav Smil, Judith Curry, Richard Lindzen, Steve Koonin, the NASA Right Stuff Team, CO2 Coalition, Heartland Institute, CFACT, American Energy Alliance and dozens of others that have written on energy and climate policy. My previous blogs have outlined the flawed science and reasons for destroying the energy infrastructure that powers America. However, the elected officials of the political party that favors these un-American, anti-conventional fuels policies are in power now and may in fact, win again in 2024. Some of the major influencers are mentioned in my post here. Why am I concerned? Because the carbon haters have done a very effective indoctrination (Scare Mongering) of millions of voters. Please read on…
Elections Matter and Here are Some Reasons of Why I am Concerned
Energy illiteracy in America is widespread. The indoctrination and demonization of carbon and nuclear energy has created a perception that many reasonably well educated people favor the “Myth of Green Energy”. I say this based on the successful indoctrination/Demonization of carbon by the U.N. , the World Economic Forum, The Sierra Club, The Natural Resources Defense Council, many other Environmental NGOs. Here is a figure I created for a presentation to the ENERUM, energy forum in Columbus and a couple other public meetings. A short review of “Demystifying Energy” is here.
Planned parenthood which is over 40% funded by Taxpayer dollars, the MSM, Entertainment and the entire Democrat Party which is strongly supported by all of the above. From what I have read about the 2020 voting patterns of suburban women, many voted on the single issue of abortion, based on the recommendations of “Planned Parenthood”. In my previous post, I showed publications that connected Planned Parenthood with the Sierra Club and other “Green Energy” supporting organizations. If you are curious, check the previous post here. Ken Braun of the Capital Research Center provides documentation of the sources of funding for the war on fuels. Names of Foundations from such well known wealthy donors such as Bloomberg, Bezos, MacArthur Foundation, Ford Foundation and others. One Sierra Club and Planned Parenthood alliance letter is here.
The anti conventional energy activists are funded with Billions and Billions of dollars. Check the links to the Capital Research Center’s Ken Braun article here. Then there is this report of the great American name “Ford” Foundation and how they have cooperated with the CCP, here.Henry Ford would not approve as this is against everything he stood for. So much for Donor Intent.
My point is, public indoctrination on green energy is widespread and well funded. The mis-perceptions are fueled by a distorted & fake science that carbon and nuclear are harmful. The gullible public with a general energy ignorance has accepted the 50 year indoctrination.
Next time you are in a social setting, just gently ask the average, educated persons you are with, how many Btus are there in a kWh? (3412.6), or how many Btus are there in a gallon of gasoline (about 125,000). Harder yet, how many foot pounds of energy at 100% efficiency is one BTU equivalent to? (778). More simply, “What is the difference between Primary and Secondary Energy? See what I mean. Now take a look at the U.S. Demographics to elect new leaders.
The 2020 election outcome by counties. The figure below was/is reported in the U.S.A. Today after the 2020 election. Here
The majority of the people in most of American counties favored the policies of Donald Trump. Thus the vast amount of red counties that are shown on the map above. However, land and counties do not vote, people do. Therefore the people of the cities with the minority of land area has the majority of voters. Many of these voters are strongly indoctrinated with propaganda from NGOs, Planned Parenthood amongst them and have been traditionally Democrat strongholds. Over 50% of Americans live in cities and although cities use enormous amounts of energy, the (D) voters not being energy savvy, tend to vote for Democrat candidates, regardless of the foolish and un-American policies they stand for. This is one reason I wrote on the importance of Energy Education here.
If the popular vote determined the outcome of a national election, it would be controlled by just three or four large Metropolitan areas such as NYC, LA, Chicago and Atlanta. Ironically, on an energy use basis, these cities use much more electricity than Rural areas. But the voters in these large Metropolitan areas have typically chosen Democrat candidates that are against conventional energy and they are for the most part, trained in Political Science, no in energy and electricity generation. Most do not know the difference between Primary and Secondary energy, yet they will proclaim as Energy Secretary Jennifer Granholm has implied…., “Electrify Everything”. Here is the unauthorized Biography of Jennifer Granholm’s by Ken Braun. Granholm, trained as a lawyer is typical of the creators of American energy policy.
My Conclusion: We have a lot of work to do to Educate the Public on the True Facts of Energy and Electricity Generation
I urge my friends and associates to get involved in educating your neighbors, friends and every person you can on the true facts. I know it is hard for anyone employed full-time to do extra curricular presentations to civic clubs, schools, Colleges and any gatherings of more than 25 people who will listen. But if not those of us that understand energy and electricity generation, then who will do it?
We must change the “Perceptions of Conventional Energy”, not only coal. Also, oil, gas and nuclear.
Respectfully and very truly yours,
Dick Storm, July 30, 2023
Green Energy Crisis, Part 4 – Appendix Will be uploaded as a separate post at a later date. This will include extensive Reference Links, Books and Information for those who are interested in further Research
In parts 1 and 2 of this Green Energy Series, the Green Energy Crisis and which people and organizations caused it. (part 1 here and part 2 here) The purpose of this post is to attempt to explain the impossibility of replacing conventional forms of Primary energy with wind and solar.
America consumes right at 100 Quadrillion Btus of energy each year. This has been fairly constant for decades. My previous posts here and here have explained this. Broken down to a per capita basis this is about 315 million Btus per year, per person/year. This is as compiled by the EIA and each BTU of energy is based on the thermodynamic equivalent of the following. From BP stats here:
1 British Thermal Unit (BTU) = 778 foot pounds of energy
3412.6 BTUs = 1 kWh of electricity
1 Barrell of oil = 42 gallons
1 Barrell of oil=. 5.8 million BTUs
2,545 BTUs = 1 Horsepower
The book, “Clean Energy Crisis” by Donn Dears is an outstanding reference and short read. I will use Mr. Dear’s books, data and calculations for much of this post.
What are the sources of America’s Primary energy now? The two charts that show this best are the Statista Bar chart and the Lawrence Livermore Laboratory Sankey Digram. Both are copied below:
Electrify Everything? Really, Think Again?
The government, MSM, Entertainment, Woke corporations (and there are a lot of them), public school education, the WEF, Environmental Extremists and many politically active organizations have waged a Demonization of conventional fuels since about 1970(13). My take on this history of environmental extremism is covered in part 2 of this series.
Electrifying everything, of course, (such as transportation EV’s) will require much more electricity generation. That is, if we are to continue to live our high quality of living and freedom of travel.
Sustaining our current life-styles and economy will require an average of about 315 million Btus/person/year.
This math is a fact and it is provided by the EIA. Please note the Statista and Sankey Diagrams above which show the Total Primary Energy Flows for 2021. The key word is Primary Energy. Electricity is Secondary Energy. Note that about 37% of the total Primary Energy was used to generate electricity. Of that total, less than 5% of the total Primary Energy used to generate electricity was provided from solar and wind. Let’s go to Mr. Dears book, Clean Energy Crisis and take a look at what it would take to replace fossil fuels. It is my understanding that Mr. Dears book calculations are projected from normal electricity growth, not including “Total Electrification of Transportation” and NOT to provide for Industrial Reshoring of industries lost to China over the last 20 years, especially primary metals industries such as steel, aluminum and copper. Primary metals production is particularly energy intensive.
These numbers below are the number of units of each form of carbon free generation that it would take to provide the electricity demand expected in 2050. Keep in mind, future predictions of any kind are always done with uncertainty.
Wind Turbines- 995,141 units of 2.5 MW each
PV-Solar Panels- 139,964 MW per year, every year till 2050
Nuclear- 851 new nuclear units comparable to Southern Company’s Plant Vogtle in Georgia. This is building 31 new nuclear units every year, till 2050 (The Plant Vogtle Nuclear Power Plant expansion of just two units has been in progress of construction since 2009)
The combined design, manufacturing, construction and commissioning of replacements for the existing installed capacity of coal, gas and nuclear plants would take over a hundred years to build, in my opinion. I recommend reading and referring to Mr. Dears book to form your own opinion. Below is a paragraph from chapter 8 of “Clean Energy Crisis”, page 59:
“Transition Reality”
“1. It is impossible for the United States to achieve Net-Zero carbon by 2050
2. CO2 is not an existential threat to mankind”
If these two conclusions are correct, and there’s considerable evidence that they are, the entire clean energy transition is a dangerous delusion.
Europe is learning the importance of energy security as it struggles to find sources of fossil fuels.”
I agree with the conclusions of Donn Dears.
We Did a Great Job of Energy Education of the U.S. Public 1950-1970. This is The Best Solution of “How to Fix Public & Political Demonization of Carbon” Educate the Public!
This post was started a couple months ago and I thought;
“What is a positive approach to correct the indoctrination?”
The solution to the problem (Self Sabotaging America’s Energy Infrastructure) is Energy Education of the public. Those of us folks who were born before 1950 remember the Public Utilities energy education programs from the 1950’s through the 1970’s “Living Better Electrically”. One example is the Sunday night TV program of the 1960’s, the “General Electric Theatre” which showcased Ronald Reagan as a spokesperson for G-E, to introduce new electrical appliances that were making a Mother’s work easier and living better electrically a reality for all Americans(4). Reddy Kilowatt was the mascot for the programs by the Investor owned Utilities. Living better electrically was shown on TV, electric bill inserts, newspapers and perhaps more importantly, in public schools. Local electric Utilities had regular programs in High Schools to teach not only Home Economics and how to cook using electric stoves, for the girls, but also “How Electricity is Generated” for the boys. I know, today that sounds wrong and politically incorrect, but back when we referred to Boys and Girls. People also had a better understanding of where our electricity came from. In fact, I was one of them that as a 16 year old (in 1959), I became enamored with coal power generation. A true fact. And I was just an average student, but I knew how electricity was generated as a teen.
In my view, this is what America needs again. Improved energy education for all ages to teach the importance of energy and the various sources of primary energy that can meet our needs.
This is a tall order. Better energy education of the public has been an idea I have had for at least two decades. When living in N.C. I did paid weekly “Energy Fact Minutes” on the radio with my old friend Matt Smith and also placed full page paid advertisements in the local Stanly News and Press newspaper.
Since then, I have written to the leaders of several Utility companies, including Lynn Good CEO of Duke Energy and the CEO of our Electric cooperative, A. Berl Davis (Palmetto Electric) to suggest such energy education programs to be reinstated. The letters and message were ignored and in fact, not answered. Those Utilities and Coop’s are Politically Correct and at least partially “Woke”…. they are Promoting the myth of green energy instead of educating the public on the true facts of energy and electricity generation.
A review of the history of how energy replaced muscle power in both the U.S. during the 20th Century and China in the 21st would be instructive for anyone who doubts the importance of conventional energy. I wrote three blog posts on the history of energy and electricity and the growth of economic prosperity, here, here and here. Also, a course presented to USCB-OLLI Program on the history of Energy and Electricity is here.
If Not the Electric Utilities, Then Who Will Educate the Public?
A good question. Mr. Tom Moser of the retired, NASA Right Stuff Climate Team is shown on a presentation by the Heartland Institute in February. At the end of his presentation, (at about the 15 minutes mark) he addresses this issue with regard to educating the public and changing public policy on the current path of Net-Zero Carbon. The number he used was 50 million dollars. A good start, but it will take much more to reverse the demonization of carbon in the public’s minds.
Summary and Conclusions
There are many reasons why the transition to wind, solar and nuclear by 2050 is unreasonable, impractical and essentially, impossible. Some reasons are simply the laws of Physics which have been explained in easy to understand terms by Donn Dears, Vaclav Smil and others. Some of the reasons are Supply-Chain related.
America invented commercial nuclear power generation and once had a strong U.S. based manufacturing infrastructure. I know this for a fact because I was employed by B&W when nuclear power was expected to grow so fast and so efficiently , “It would be too Cheap to Meter”. Now the massive manufacturing facilities of Combustion Engineering in Chattanooga, TN and many more facilities ( like Textiles and Furniture manufacturing in U.S.) are mostly gone. Also, included in the supply chain concerns & limitations is training of the workforce. Those of us old enough to remember President Kennedy’s inspirational “We Choose the Moon” speech of 1960 where he stated we “will land on the moon within ten years” remember the extremely successful upgrading of public education in math and science and the large number of excellent engineers that were trained 1960-1970. In my view, “Electrifying Everything” at least everything possible, will take a larger commitment than the space program of the 1960’s and we cannot electrify everything nor can we replace fossil fuels with wind and solar. The fundamental Physics of energy and electricity need to be taught to all students and adults. Like the Edison Electric Institute and Electric Utilities did in the 1960’s with the “Live Better Electrically” program and Federal and State governments did to inspire excellence in public STEM education, 1960-1970.
So, where do we start? As I see it, we need to educate the public on energy and how it is produced and used. A model of public education on energy was accomplished between 1950 and 1970. Let’s take a look at what we once did in energy awareness for the public. The B&W ad is from a nationally distributed business magazine in 1954.
Just for the record, I practice what I preach and have done my best to spread the word to my friends, neighbors and the communities where I have lived for decades. In the past three years I have presented several courses at USCB-OLLI in Beaufort County, SC, given presentations in Public Schools and civic clubs. Most of my presentations are available in pdf on LinkedIn or on my blog. If I can assist or share any info to others interested in educating the public on the facts of the importance of conventional energy, let me know, I will help as best as I can.
Thank you for reading. This blog is my small contribution to spreading the true facts on the importance of conventional forms of energy.
Yours truly,
Dick Storm, June 23, 2023
References and Further Information
Tom Moser video, (198,298 views Mar 21, 2023) Join former NASA engineer and program director for the space station Tom Moser for a presentation that sheds light on the science behind climate change. Drawing on his impressive credentials, including serving as Acting Associate Administrator for Spaceflight in Washington, D.C., Director of the Space Station Program, Deputy Manager of the Space Shuttle Orbiter, and Chief Engineer at the Johnson Space Center, Moser highlights the correlation between global temperatures and solar irradiance. He also delves into the disparity between real-world data and often reported climate models, which are used as the basis for governmental public policy, and how these models consistently overestimate temperature trends versus the real-world data. Moser exposes the propaganda in the climate science field and breaks down why media claims are often misleading. This informative presentation is not to be missed by anyone interested in gaining a better understanding of climate science. The Fifteenth International Conference on Climate Change (ICCC) featured more than 50 speakers who are top scientists in their fields and policy experts from around the world. Each edition of these conferences attracts scientists, legislators, environmentalists, and more all discussing their views on climate science, the idea that there is a crisis, efforts to educate the public, views on the state of discourse, and more. Visit these sites for more great climate information from The Heartland Institute: PLAYLIST FOR THE WHOLE 2023 HEARTLAND INSTITUTE CLIMATE CONFERENCE: • 2023 Climate Conf…
Here is a summary of the people & organizations That have led to the destructive Climate Policies our country is now enduring. The “Climate Policies” are against the best interests of America and are not about saving the planet or protecting the environment. There is no planned transition to renewables(25, 60) and our country will be weakened by the path to Net Zero. The worrisome bottom line is, that no one person or organization is accountable and it will be hard to fix.
The path to correcting the absurd Climate Policies is to improve the energy and environmental science education of the public and elected officials.
It is a very daunting challenge to reverse about 50 years of public indoctrination on the demonization of coal, oil, gas & nuclear.
Dr. Judith Curry recently wrote on her Blog,“How the Disinformation Industrial Complex is Destroying Trust in Science”.(14) In my view, the only science that climate policies are based on is, Political Science.
We should try our best to correct the miseducation/indoctrination/scaring of the public. Somebody should! Here is my shot at identifying the problem. I am reminded of a quote attributed to Ben Franklin, “Identifying the Problem is the First Step in Correcting It” A future post will outline my thoughts on “How to Correct the Indoctrination and Mis-education (on Energy) of the public. Hint, it is a huge challenge that will need billions of dollars in communications funds.
Conventional energy built America and it continues to provide the fuel for our high quality of life, provides transportation, washes our dishes, cleans our clothes, produces and cooks our food, creates products from Industry, powers our National defense, powers our computers, servers and Smart Phones, energizes our economy and more…. Why would thinking people destroy the energy that we depend on? I wrote on the beginnings of the “War on Carbon” in 2021. This is a followup to that post which is here.
Please read on, I will try to explain how the demonization of carbon came to be and it is not naïveté, it is intentional. In fact, it is not hyperbole to say it is evil.(53) If you read all the way through I will connect the dots of the how and who of the movement against conventional forms of energy. The politicians and activist organizations are NOT Stupid as I and many others have once thought. They are very well organized & lavishly funded with billions of dollars. However, they do not care about the future of America and if they have any motive at all, it is that they are against the best interests of the U.S.A. The activists listed below do not appear to be very well educated in science and engineering to include; Physics, Chemistry, Thermodynamics, Electricity or Energy. Please check the references and then you decide.
The Political Science trained incumbent politicians do have access to the best engineering and science minds in America, (if they wanted it) yet they have very effectively set the U.S. on a path of destruction. Why? Because the advice they seek from “Experts” (if they seek any advice?) are from extremists, many of which are employed as Bureaucrats or within NGO organizations with people embedded in government. They appear to be not very savvy on energy and engineering.
In the interest of brevity of this post, at the end, I have included many references for you to refer, let me suggest you start with # 51 to read and judge for yourself.
The references support my conclusions that the elected officials have used energy and environmental advice from extreme activists that know little about energy. Worse yet, they are not interested in the continued strength of the Free Western World.
Environmental Extremists are In Charge
Today the people in charge of energy policy have risen from their College graduations through paths of training and experience in Political Science, Law or Environmental Activism, progression of elected offices or University Teaching. None that I am aware have had any significant power generation technical, business experience or training as power engineers. My previous Blog in the January post listed numerous Climate and Energy Influencers. These influencers of energy policy have no background in energy production or power generation. So, the energy and electricity generation policies that have been forced onto the American citizens and (now struggling) productive industries are not well thought out. The so called “Transition to Renewables” is not a planned process as a group of experienced electric utility planning engineers would methodically produce. That is, if it was even possible to replace fossil fuels and nuclear with solar and wind.
The so called “Climate Policies” are simply a wrongheaded fast track approach to Decarbonize Bulk Power Generation, Transportation and Industry. In essence, “Electrify Everything” and do so without knowing the consequence of sabotaging America’s Energy & Electricity Generation Infrastructure.
Here are some of the key persons responsible for the current “Green New Deal” or so-called “Inflation Reduction Act”, which codifies the green policies.
John Kerry– Special Envoy for Climate . Background: Politician and trained in Political Science. A “Green” Ideologue that has spent his entire career as a politician. His recent speech to the WEF attacked Farmers and food production. Although he travels in luxury via Jet fuel guzzling private jets, he advocates reducing the quality of life of the rest of us, including the amount and type of food that we eat and the fuel used to cook it.
Gina McCarthy, Past EPA Administrator in Obama Administration and past Chief Executive Officer at the Natural Resources Defense Council (NRDC) This lady presided over the most effective times of the war on coal by the EPA since 1970. Her employment, like many other top EPA officials cycled back and forth between anti coal NGO’s and government(51,52). Two references are here and here:
Michael Regan–EPA Administrator Past employment head of N.C. Dept of Environmental Quality and was a past employee of the Environmental Defense Fund (EDF).
Joe Goffman A high level EPA official, I am not sure of his present title. Here is a newspaper op-ed by West Virginia Senator Shelly Moore Capito, in WVA “Intelligencer” Newspaper, July 2022.
Deb Haaland Secretary of Dept of Interior: Past experiences as Gov. of New Mexico. Has advocated policies to reduce access to American energy reserves.
The people and a short resume of each Biden Administration Cabinet member is listed below in references 53-62 thanks to the Capital Research Center’s Robert Stilson. The Congressional representatives that have come to positions of high influence are listed in an article in E& E News, here.
Barrack Obama ramped up the war on carbon during his two terms in office. His appointment of Gina McCarthy as EPA Chief was devastating to coal plants. Weaponization of government agencies by using a revolving door for employment of environmental extremists is documented in a report to Congress here.
Al Gore. His background is well known. His scare mongering claims of the movie “Inconvenient Truth” and other activities have been debunked by real scientists but the MSM loves him and his scare tactics, aided by “Woke” Entertainment and the Mainstream Media have out-shouted true science.
President Joe Biden has continued and expanded the war on carbon that Clinton & Obama started. He has unashamedly accelerated the decline of America, including the weakening of the U.S. military in the name of “Climate Change”. Even absurdly(107) pushing to electrify the Military.
Senator Ed Markey has served in Congress since 1976. Clearly a career politician and green ideologue.(109)
Congresswoman Alexandria Ocasio-Cortez along with Senator Ed Markey, Cori Bush and others, has become very influential in creating energy policy in Washington. I am not saying they have sinister or evil intentions, it is just the fact that they do not understand energy and electricity generation. They obtain technical advice from activist organizations and people that also either do not understand the science of power generation or they have other agenda(s) that is/are being promoted, such as the U.N. Agenda 21, U.N.-IPCC and World Economic Forum’s “Great Reset”.(120)
Congressional Representatives Cori Bush and Jamaal Bowman. Power players for Green New Deal Policies.
Michael Bloomberg Also well known as a successful businessman and past Mayor of NYC. Perhaps good intentions, but his lavish funding of NGO’s to Demonize coal, oil and gas are in fact, un-American. He has given over 174 million to the Sierra Club for their “Beyond Coal” campaign.
Tom Steyer Another successful businessman and huge funder of propaganda to demonize conventional forms of energy. Steyer has given over 100 million to environmental activists.
Jeff Bezos of Amazon fame. Highly successful businessman and another person that should know better, but like Steyer and Bloomberg has given over 100 million dollars to Environmental Activist NGO’s to fight conventional fuels.
Senator Sheldon Whitehouse A talented politician that is effective in accusing the opposing side of doing what his party has honed to perfection. Here is a review of his new book, “The Scheme”.
Senator Joe ManchinWhenhe was Governor of West Virginia I met him to discuss trade education in the WVA Community Colleges. A very personable guy. Well, one would think a Patriotic folksy and nice guy like Joe Manchin would put America and the state of West Virginia first. Right? No, he voted for the radical “Green New Deal”. If you review the references of funding of environmental activist organizations, it may help explain why.
Antonio Guterres, Socialist Leader, now United Nations Secretary General and he favors “One World Government” The UN-IPCC is a path toward such a body. I have written on the uselessness of the U.N. on an earlier blog post. Here. Also, on the views of the past President of the Czech Republic in his book, “Blue Planet in Green Shackles, Which is Endangered? Climate or Freedom?”, here.
World Economic Forum Leader, Klaus Schwab The WEF has been pretty much aligned with the U.N. and leftist causes to move toward World Totalitarianism. (120) WEF is an advocate for degrowth of population, deindustrialization and reduced food production. As mentioned above, John Kerry gave a speech on reducing agriculture(112) and the WEF published positions on Degrowth and Limiting the Use of Private Vehicles. (111, 112, 113)
WEF Member Bill Gates I suspect he has good intentions and yes, he has a lot of money to influence others. Here is an article published in the Guardian on some of his views on climate.(110)
Greta Thunberg She has not been trained in Atmospheric Science or any technical field, yet she is given speaking slots at the United Nations, WEF, TV and has been on the cover of Internationally distributed magazines.(115) Yes, she is very influential and absolutely hard to understand when real Scientists such as Dr’s. Judith Curry, Richard Linden, Roy Spencer, Pat Michaels, and many more…are ignored and not given the world stage to present the facts to the public, yet teenagers with little engineering or science training are posted on the cover of Internationally distributed magazines and hailed as heroes of the planet.
The previous post from January outlines some more information on people & organizations involved in influencing U.S. and world Climate Policy.
Deep Pockets
The enormous funding of the NGO’s which include “abortion” (which is aligned with environmental activist groups such as the Sierra Club and NRDC) (116, 117, 118) have a large impact on voter influence. The NGO’s are Tax exempt and have Billions of dollars in reserves to use. Some of the funds are reported to be provided by Dark money and some is provided by U.S. Taxpayer dollars, such as Planned Parenthood which is very much aligned with the policies of the Internationally connected environmental activists. (116, 117,118, 119, 120, 1F)
Global Influencers
The United Nations and the World Economic Forum are two key organizations responsible for current paths to one world government, discussed as decarbonization & environmental policies. Several books are listed below and I have written previous posts on the UN-IPCC and WEF policies and activities. Some NGO’s are global and are aligned with the WEF and the U.N. Such as: The Natural Resources Defense Council, the Sierra Club, Greenpeace and others.
I will attempt to be brief in connecting the dots from the early beginnings of the environmental movement.
The Beginnings of the Climate Extremists Movement
The start of the modern environmental action is (usually) credited to the book, “Silent Spring” by Rachel Carson in 1962. This book focused on the harmful affects of DDT insecticide and although there were abuses, the banning of DDT caused many millions of deaths in Developing countries from Malaria that could have been prevented by careful use of DDT for mosquito control. Then, following Silent Spring was Dr. Paul Erhlich’s 1968 book, “Population Bomb” where he outlined the decline of humanity due to over-population. The Sierra Club and Ehrlich had some interaction and the Sierra Club is mentioned in the book, Population Bomb. Following Erhich was the “Club of Rome” publication “Limits to Growth” was published in 1972. As stated in the sub title, “A Report to the Club of Rome on the Predicament of Mankind”.
Much of the story of Radical Environmentalism, Pseudo-Scientists and the Fatal Cult of Anti-Humanism is captured in Robert Zubrin’s book, “Merchants of Despair”.(53) Also connected with the environmental and population growth concerns has been the “Reproductive Rights”movement and “Planned Parenthood” founded by Margaret Sanger. The Sierra Club and Planned Parenthood have been somewhat aligned in their concerns for reducing population growth and protecting the environment, calling it the connection of “Reproductive Rights and Environmental Justice”.
Dirty Open Secrets
Two dirty little secrets of the environmental movements are: 1. they are a movement of socialism and 2. they favor Deindustrialization and Degrowth of the population. (at least, degrowth and depopulation of the western world and poor countries) The roots of these are provided in the books listed above. A more recent video of a Climate Activist explaining her feelings was shown on a video of the European Union meeting in May of this year. This link is to the ESG investing post on LinkedIn. The post by Joseph Castillo is copied below:
“Anuna De Wever Van Der Heyden is a 22-year-old Belgian climate activist. She delivered this speech at the Beyond Growth conference in the European Parliament on May 19th. Here is a link to a post-conference panel discussing the EU adoption of degrowth policies: https://lnkd.in/g68-PJ4d.
Van Der Heyden has not explicitly identified as a Marxist, but her views on economics and social justice are consistent with Marxist principles. She calls for the EU to adopt “degrowth economies,” policies that reduce GDP, consumption, and production to protect the environment. Not explicitly mentioned are policies that would slow or reverse population growth. These views are shared by many Marxists who believe that capitalism is inherently unsustainable and exploitative.
She has also called for “decolonization,” a process by which colonized areas achieve independence from the colonizing countries. For example, the American Revolution decolonized the present-day US from the British, India gained independence from the UK in 1947, and South Africa declared itself a republic and left the British Commonwealth of Nations in 1961. Obviously, the Brits are the problem.”
Ms. Van Der Heyden, in my opinion, represents the true beliefs of the typical Climate Activists. It is not about Climate, it is about control of the population and in fact, limiting the growth of population on the planet. Getting back to the writings and stated beliefs of the Club of Rome, Margaret Sanger and Paul Ehrlich.
The United Nations IPCC and the World Economic Forum have added their influence to the so called “Climate Activism”. The movement has grown worldwide and spread through the G7 countries. Oddly, few news articles mention the fact that China and Russia are not part of the decarbonization and in fact, China is growing in economic power by being the worlds largest manufacturing country. Powering that manufacturing is over 50% of the total coal burned in the world. Let’s get back to the path the U.S. is taking to self sabotage our electric reliability.
Self Sabotaging America’s Energy Infrastructure
America has no energy policy and is currently embarked on policies that will self sabotage electricity reliability, reduce availability of gasoline, Diesel, gas and propane, increase costs, increase food costs and reduce food availability to the people of America and to Developing countries.
The current Climate Policies will Deindustrialize America, lower our standard of living and infringe on our freedom. This is called Net Zero Carbon by 2050 and the decarbonization path currently sought, using wind and solar power to replace fossil fuels is absolutely wrong for our country.
My background is having worked as a nuts and bolts practical power engineer. My work experiences involved design, startup, operations, maintenance, performance tuning and designing steam generator and fuel burning equipment, including NOx reduction systems and efficiency enhancements for large coal fueled Utility steam generators. The picture below is the demolition of the L.V. Sutton, Unit #3, a 420 MW coal unit. This is typical of what we see today. This one is a bit nostalgic to me, because I was the lead startup engineer of this unit when it was commissioned in June 1972. Sure it was old, but it was capable of running at least ten more years until more Dispatchable or base load coal or nuclear units could be constructed.
Demolition, 2016 of Sutton Unit #3, 420 MW Coal Plant started up in June 1972, I was the lead startup engineer for Riley Stoker, the Steam Generator Manufacturer when this plant went commercial
Therefore, my experience base is Bulk Power Generation aka “Bulk Power Supply” (BPS). My observations from this viewpoint of working in the energy and electric power generation industry for over 50 years is that I saw and continue to read about the NGO Extremists, working in concert with the U.S.- EPA to formulate ever more stringent Regulations. U.S. regulations and Public Indoctrination have forced over 102 GW of coal and nuclear plants to shut down since 2011. The problem is exacerbated by RTO’s (Regional Transmission Operators) creating cut throat competition by forcing renewables onto the Grid (and consequent lowered capacity factors of reliable coal generation). This is created by Federal Policies that provide investment and production tax credits to solar and wind generation owners. Here is an excerpt of the July 2022 Reliability report from NERC (North American Electric Reliability Corp.) This is from page 25 of the July 2022, NERC “Bulk Power Supply Assessment” report.(3)
The shut down (2011-2021) of 102 GW (98.7 coal + 3.9 GW nuclear) of Reliable, affordable, Dispatchable and Abundant Bulk Power supply, without replacing these plants with like capacity of Dispatchable Bulk Power Supply generation assets is a serious problem for the U.S. This is what I refer to as self sabotaging our electric reliability right before our eyes. I have done some research to try to find the reason why the U.S. has such an absurd policy of mindless, Decarbonization by shutting down reliable coal plants (nuclear too) without replacing their needed generation capacity. The descriptions of Primary and Secondary Energy have been written on my previous Blog posts. There is no energy policy for an orderly transition to reduced carbon energy such as nuclear.
Federal Energy Commissioner Mark Christie testified to Congress this month on the fragility of our Bulk Power Supply for the future. (60)
The Public’s perceptions of coal, oil and gas have been poisoned with indoctrination by the United Nations, the U.S. government, the World Economic Forum, Environmental Extremist NGO’s, the Entertainment Industry, Main Stream media and “Woke” corporations. As someone posted comments attributed to Professor Michael Kelly on LinkedIn, “Where are the engineers?”
Summary
Not only the U.S. but the entire western world’s energy situation is in dire straights. In my view the future energy problems will exceed the difficulties of the 1973 and 1978 oil embargoes. These problems are being brought on by misguided politicians, NGO’s, “Woke” corporations, Entertainment and the MSM. Fixing it will be difficult. The purpose of this post is to try to connect the dots of how we have come to this energy mess.
Unless the Net Zero Carbon path is changed, America, the western world and poor countries of the world will have to reduce our quality of life. Our economic output will decline and so will America’s influence in the world. America’s influence in the world will decline and China’s will rise. I don’t have anything against the people of China, but the past history of the CCP does not read like a happy fairy tale. I personally prefer living by the freedoms provided in our Constitutional Republic .
There is no planned or organized energy transition to renewables. Period. It is Impossible without totally disrupting our economy, life-styles and quality of life.
Conclusions
Below are five groups of references for further reading to support my conclusions. These are in five categories:
Climate Science references from respected and credentialed Physicists and Atmospheric Scientists that challenge Anthropogenic Global Warming or Climate Change.
Energy, Minerals and Electricity Supply concerns for the future
Energy correlation with Economic output & Quality of Life
Climate Policies are about one world government and control of the citizens of the world, not protection of the environment. Books, News articles and reports documenting the fact that Climate Policies are Polic corruption of science and not about protection of the environment, clean air and clean water.
Energy Policymakers, Environmental Extremist and Activist NGO’s
As an example, here is a comment by Dr. Patrick Moore on the U.N.-IPCC report. Dr. Moore is one of many credentialed scientists that dispute Anthropogenic Climate Change. So do the scientists at the IPCC, but that is not what is reported by the Main Stream Media.
You do not have to believe me, kindly read the references which follow. They are all open sourced.
Yours very truly,
Dick Storm, Flag Day, June 14, 2023
References for further reading and research (Five categories):
Climate Science Books, websites, reports and information by Credentialed Physicists and Atmospheric Scientists:
53. Book: “Merchants of Despair” by Robert Zubrin, on Radical Environmentalists, CriminalPseudo-Scientists and the Fatal Cult of Antihumanism: Published 2012 by Encounter Books and again in 2016 by the Heartland Institute
103. Sheldon Whitehouse’s new book where he will claim the opposition party does what he and his party have done very effectively, for decades: “The Scheme, where He accuses Republicans of using Dark Money”, when in fact, the Democrats do it much more: https://thenewpress.com/books/scheme
The purpose of this post is to show a few of the warnings that Congress has been unresponsive and the Executive Branch and EPA either clueless or Intentionally Causing the coming energy crisis. Paul Harvey’s classic radio commentary of 1964 comes to mind, “If I Were the Devil”.
Typical Coal Plant Demolition. This one in NSW Australia, but we in the U.S. have performed similar demolition of important power generation stations capable of generating reliable, affordable & Dispatchable power 24/7 during all weather conditions. It is heartbreaking for those of us who understand energy and electricity generation. But, it is cheered by about 50% of the world’s population because those who do not understand the importance of conventional forms of energy have been indoctrinated on the demonization of fossil fuels.
Introduction
Many of us who have been closely associated with energy production and electricity generation have known the day of reckoning is coming. In this post I will lift up some past posts, presentations and published articles to show the foolishness of the “Green New Deal” which has been codified in the so called, “Inflation Reduction Act” or IRA.
Below are two of the slides I presented to the ASME Annual Meeting in 2011. Yes, I have been an advocate for Common Sense Energy Policies for a long time.
The year 2011 was during the Obama Administration and the “War on Coal” was being escalated by the EPA and Activist NGO’s such as the Sierra Club, Natural Resources Defense Council, Environmental Defense Fund, Wild Earth Guardians and many more environmental extremist organizations. Shale gas was coming onto the market at ever increasing volume and low prices. Thus, as much coal generation was replaced with natural gas fuel, the consumers and industry had no concerns for the future. But, those of us associated with the power industry knew the crisis was coming.
Let me point out the graph on the second slide above, this correlates Coal use and GDP 1970-2010. Yes, Life was very good for us and our country’s electricity was generated by about 50% coal power generation. Blackouts were very rare. Brownouts were very rare. Let’s fast forward to the claimed great success of the carbon hating Bureaucrats and their allies in the NGO’s. I will show a screen print from the Sierra Club website below. They continue to be very proud of their accomplishments in the war on coal, which really is a war on the consumer.
This is from the Sierra Club web site. Note above they are literally bragging about shutting down 372 coal plants with 158 plants to go. Not only shut down, but completely demolished. Both the environmental activists and the U.S. Government top officials have a goal of shutting down all coal plants by 2030.
Let me direct your attention to the slide below. This is also a screenshot of the Sierra Club web site. Notice that not only do they want to shut down coal plants, they also want to kill natural gas production and pipelines. Not clearly shown today, but in their’s and other activist goals has been the opposition to nuclear power.
At the end of this post I will provide many references for further reading on the war on coal-natural gas and nuclear. This is serious folks. These people and their organizations do not understand energy and appear to have no concern for the harm they are causing to the citizens of the U.S.A.
Part 2 of this post will be a summary of how these Un-American Climate Policies have come to be and to list some of the policies, organizations and people that have contributed to the Clean Energy Crisis that our country and the Free Western World is facing.
Closing
The coalescence of environmental activists, government officials (both elected and Bureaucrats), the United Nations, the World Economic Forum, the Main Stream Media, Entertainment, Woke Businesses & Industries and leftist activist organizations have put our country on a path of weakness and decline. It must be stopped. But before it will be reversed there will be many industries, businesses and citizens who will be harmed. It did not have to happen this way. (2) Kindly read the references listed below for support of my conclusions.
History has shown that countries rise, fall and rise again. The economic decline of the U.S. should not be hastened by self destructive and unnecessary environmental restrictions.
The true facts on the importance of conventional forms of energy are well described in many books. Especially the books by Donn Dears(19) and Vaclav Smil(95) these provide excellent insight into the importance of conventional forms of energy. Mr. Dears provides a very enlightened summary in about 100 pages.
Yours very truly and on this Memorial Day, We should pause and remember those who fought and died to secure our freedom. May God Bless America,
Dick Storm presentation to the American Coal Council, 2008 on “Perceptions of Coal” This is not posted online that I know of. I can send a copy upon request.
Long story shortened, the only way I know to stop the destructive policies is through an intensive energy education program of the general public. The ad below was typical of many in business and industrial trade magazines of the 1950’s and 60’s. It represents the culture of those times.
Introduction
Parts 1 through 4 of this series are my attempt to explain where we are on energy policy and how we got here. Here below are my additional thoughts on “How to Fix” Americans perceptions of the importance of energy in our lives.
Energy Education: The Best Solution of How to Fix Public & Political Demonization of Carbon
This post was started a couple months ago and after I was thinking about “What is a positive approach to correct the indoctrination?” The solution to the problem (Self Sabotaging Madness) is Energy Education of the public. Those of us folks who were born before 1950 remember the Public Utilities energy education programs from the 1950’s through the 1970’s “Living Better Electrically”. One example is the Sunday night TV program, “General Electric Theatre” showcased by none other than future President, Ronald Reagan as a spokesperson for G-E, to showcase new electrical appliances that were making a Mother’s work easier and living better electrically a reality for all Americans(4). Reddy Kilowatt was the mascot for the programs by the Investor owned Utilities. Living better electrically was shown on TV, electric bill inserts, newspapers and perhaps more importantly, in public schools. Local electric Utilities had regular programs in High Schools to teach not only Home Economics and how to cook using electric stoves, for the girls, but also “How Electricity is Generated” for the boys. I know, today that sounds wrong and politically incorrect, but back when we referred to Boys and Girls. People also had a better understanding of where our electricity came from. In fact, I was one of them that as a 16 year old (in 1959), I became enamored with coal power generation. A true fact. And I was not exactly a standout scholar, but I knew how electricity was generated as a teen. Here is a reminder of the correlation of GDP and coal consumption 1970-2010. (148)
In my view, this is what America needs again. Improved energy education for all ages to teach the importance of energy and the various sources of Primary energy that can meet our needs.
This is a tall order. Better energy education of the public has been an idea I have had for at least two decades. When living in N.C. I did weekly “Energy Fact Minutes” on the radio with my old friend Matt Smith and also placed full page advertisements in the local Stanly News and Press newspaper. I have written to the CEO’s of several Utility companies, including Lynn Good of Duke Energy and the CEO of our Electric cooperative (Palmetto Electric) to suggest such energy education programs to be reinstated. The letters and message were ignored and in fact, not answered. Those Utilities and Coop’s are what I consider “Woke”…. and they are Promoting the myth of green energy instead of educating the public on the true facts of energy and electricity generation. Speaking of misinformation and “Wokeness” below is a screen shot from the NextEra Energy web site. A plan for Net Zero, really? Electrify everything? This and other once fine Utility companies have gone “Woke” and are promoting solar and wind power when they fully know it is not possible to replace the 100 Quadrillion BTUs that America needs every year. Why? Two reasons: 1. Follow the money through government subsidies and 2. Avoid the wrath of punishment of well funded (Billions of $) environmental extremist groups. Below is a screen print of the NextEra Energy website as an example.
I do a lot of complaining regarding the government, NGO’s, Woke Industries and public education, so it seems reasonable that I should at least offer a positive suggestion of a solution. A suggestion “How to Correct” the 50 year indoctrination and demonization of the fuels we depend on, Improve energy education.
An informed and energy savvy public will be capable of making the best choices of candidates when voting in the 2024 election. The best hope for America, is that informed and energy savvy candidates will change the destructive Net Zero Policies forced on industry and the citizens.
Did you ever wonder how the misconceptions of energy started? Well, stick with me and read on.
What Went Wrong With the Living Better Electrically Programs of the 1950’s-1970’s? Why was Energy Education Stopped?
The public energy education programs went pretty well up to about the mid 1970’s. The Arab Oil Embargoes(5,6) of 1973 and 1978 created financial stress on electric utilities (and everybody else too!). I was working on the startup of the Roxboro Unit #3 a 720 MW coal plant for CP&L back then (I joined CP&L in Jan. 1973) and I remember it clearly. In 1973 the Roxboro plant expansion was for two 720 MW coal units to be completed in 1973 and the second one 1974. I was the senior startup engineer for the two units. Shortly after unit #3 began commercial operation in June 1973, the first oil embargo took place. Raising investment capital by selling stock to investors became a challenge and CP&L like many other utilities during that time had to cut back spending. Those of us that were adults in 1973 remember some electric utilities actually selling power plants to the state or other drastic measures. The period 1973-1978 was very tough on investor owned utilities.(149,150) These spending cut backs included CP&L shutting down construction on Unit #4 and then reducing operational & maintenance expenses. The first budget items to be cut (not only CP&L but most Utilities) were tree trimming near power lines, then painting and any maintenance that could be deferred. A crucial budget cut which has had long term consequences was halting the Public Energy Education programs. Yes, the “Living Better Electrically” public education programs were slashed from the budget. Not only at CP&L but pretty much industry wide. CP&L has since been absorbed by Duke Energy. This was a mistake that is easy to see from my vantage point, because I lived through it and it impacted me personally.
What is to come with the consequences of Net Zero Carbon, if we continue this dangerous path, will be in my view, worse than 1973-1978
So, what replaced the “Living Better Electrically” PR programs? Sadly, the void of public energy education was filled with biased anti-fossil fuels and anti nuclear propaganda by Environmental activists. Piling on was population growth organizations such as Margaret Sanger’s Planned Parenthood which became affiliated with the Sierra Club(151). Many of the environmental and anti population growth organizations coalesced after the first “Earth Day” in 1970. The (then) recently published books by Rachel Carson, “Silent Spring”, Paul Ehrlich’s “Population Bomb” and the Club of Rome’s, “Limits to Growth” all became popular with the Leftists and NGO’s. These, in my life experiences are the roots of the current war on carbon. More will be provided later. I gave a presentation to the American Coal Council in 2008 on the “Perceptions of Coal”(15). In this presentation I used one graphic to attempt to show the decline of energy education and the enormous rise of funding resources for environmental extremism. This is shown below:
The point of the graphic was to show how the progression of the perceptions of coal power by the public from the time line of 1950 to 2008. In the 1950’s, 1960’s and 1970’s “Living Better Electrically” was the theme promoted by the MSM and in public schools. Also, the funding for TV, magazines and newspaper advertising was generous by such Fortune 500 companies as General Electric, Westinghouse, Allis-Chalmers, Babcock and Wilcox, Combustion Engineering and many more. One of my favorites by B&W is shown below.
Then, as the Environmental Activism started in the late 1960’s, the funding for advertising (Indoctrination) changed from those who were creating the products to live better electrically….to those who objected to the use of fossil fuels and nuclear. The Sierra Club, NRDC, EDF and many other NGO’s became more and more well funded. Today collectively they have billions of tax sheltered funds to use for public indoctrination and election campaigns of candidates that favor the path of “Woke” Climate Policy. They have used the funding to demonize conventional forms of energy and they have been very successful. However, they may not understand the harm they are causing to our country? Even successful but energy ignorant Billionaires fund the NGO’s to indoctrinate the public and influence elections(16,17). It is a war on consumers energy costs but the left uses carbon as a scare tactic. This war on consumers is described by Hayden Ludwig in the article by Capital Research Center.
Here is a recent post by the Sierra Club, in essence, bragging about how their war on coal has gone so well. Their goal is to kill all coal plants in America by 2030.
Coal plants are being retired and demolished without replacement of new reliable capacity which makes the promoters of renewable power very happy. Not only extremists that hate coal, but also some Utilities and Private sector companies that are investing in “Green Energy” as the expression goes….”Follow the Money”. Below is from a screen print of a portion of NextEra Energy’s website. I consider this un-American and an example of a “Woke” corporation.
Meanwhile, as we fast forward to 2023 the new government and main stream media Mantra is “Electrify Everything” Missing in today’s woke advertising and PR programs by the proponents of electrify everything is a basic understanding of how electricity is generated and the details of how reliable, affordable and Dispatchable generation is accomplished. This gets back to the general public’s (and government Bureaucrats) mis-understanding the differences between Primary and Secondary energy.Also, “Nameplate Capacity” and actual “Capacity Factor” of Bulk Power Generation Resources. Just for the record, I have done my best to educate the public with energy and electricity courses at USCB-OLLI and presentations to public schools, Colleges and Civic Clubs. We need more of us experienced and energy savvy engineers to do this!
Getting Back to Basics: Electricity is Secondary Energy and must be Generated from Primary Energy
When I meet intelligent and successful people who have a great general understanding of business and industry but have not worked in the energy or power generation business, they are often stunned when I explain the facts of where our electric power is generated and the fuels used to power our economy and high quality of life. They usually say in essence: “I can’t believe that there is not a planned transition from fossil fuels to renewables?” A student of one of the courses I taught at USCB-OLLI stated, “You mean electricity has to be generated from coal, gas and nuclear power to charge my Tesla?” The misconception of Primary Energy and Secondary Energy is one of the largest causes of misunderstanding by the general public. Partly because of the general public’s lack of interest in educating themselves and partly because of indoctrination by the well funded Environmental Extremist NGO’s, government, the entertainment industry (ex. Disney), Public Schools and by public Education/Indoctrination,
America Has Some of the Cleanest Air in the World
Environmental Progress in Cleaning the Air
We all want clean air and clean water. And, in 1970 some attention to cleaning discharges to the air and water of the United States was badly needed. Sulfur Oxide and Oxides of Nitrogen were causing Acid Rain, particulate emissions were unacceptable and heavy metals were a valid concern for public health. Thus, the EPA began in 1970 and did a very good job of cleaning the air and water after 1970. The great job is shown on the chart below.
The air in the U.S. is truly amongst the cleanest of all industrialized countries. The great progress in cleaning the air is a fact as shown on the EPA chart above. So, why is the EPA continuing to force more and more coal plants to shut down? In my view, it is not about clean air, it is about following the environmental extremist NGO’s policies of Degrowth, Deindustrialization, One World Government and Socialism policies of the U.N. , the WEF (World Economic Forum) and the world’s “Greens”.
Sadly, these influential people and organizations have done a very thorough job of scaring and indoctrinating over 50% of the people in America and also other Free Western World countries.
The Growth of Worldwide Environmental Extremism
In the foregoing paragraphs I have tried to show the path of public education on energy matters (Public Energy Education was Good up till 1973) and the growth of environmental extremism and indoctrination from the late 1960’s through present day. There are some green organizations that are Global and these have infiltrated the leadership of the United Nations. Some of the environmental activists have coalesced with Socialists and organizations concerned with population growth. All together, the International Green movement has become comprised of followers of stopping population growth, abortion, environmental extremists, anti-nuclear power activists and socialists. Together these organizations have gained wealth and influence over much of the free western world. Alarmingly, many of the 192 nations that are members of the U.N. are aligned with the so called “Climate Policies” of the U.N. except for China & Russia. In fact, most of the BRICS nations which comprise about 40% of the world population are aligned with UN Climate Policies which are, in my opinion, slanted toward weakening America and strengthening China. Read the PA Pundits essay on the CFACT Blog here.
The Climate Policies are Not About Environmental Concerns. They are about Control of Our Lives, So, Why is America Self Sabotaging Our Reliable Electric Power Supply?
This post is to attempt to show the coalescence of various activist groups that have been growing in influence since the 1970’s. Basically, since the 1973 Oil Embargo. Those of us that were adults then remember the disruptions to our life styles and the economic pain which was inflicted on us by having our energy supply disrupted. Friends, the 1973 and 1978 oil embargoes were a problem but the electricity shortages that America is faced with in the future will be worse unless we turn away from the destructive path of Net Zero Carbon which is focused on use of renewable wind and solar to replace fossil fuels. It is impossible to do so by 2050. Not without severe disruptions of our economy and our lives.
America Does Not Have an Energy Policy to Transition to Carbon Free Energy
The Climate Policies and the Paris Agreement have little to do with protection of the environment. However, if clean energy sources are desired, then nuclear power is the one source of carbon free energy that can significantly reduce emissions with reliable, affordable and base load capacity.
I invite you to refer to my other Blog posts and the references listed below for further reading and information that will support my conclusions.
Yours very truly,
Dick Storm, August 8, 2023
Here are References for further reading and research, More will be posted in the Appendices for the “Green Energy Crisis” series in the next week.
Video of 22 year old Belgian Climate Activist to European Union: Anuna De Wever Van Der Heyden is a 22-year-old Belgian climate activist. She delivered this speech at the Beyond Growth conference in the European Parliament on May 19th. Here is a link to a post-conference panel discussing the EU adoption of degrowth policies: https://lnkd.in/g68-PJ4d
Dick Storm presentation to the “American Coal Council” 2008, “Perceptions of Coal”
Each citizen needs about 315 million Btus of energy to sustain our freedom of travel and way of life
Introduction
Yesterday I was a guest speaker at the “Money Talks Club” gathering in Sun City. I presented my views of Net Zero Carbon and was impressed with the interest and understanding of energy and electricity generation by the group. A fine gathering of American Patriots and I was honored to be their guest. At the same time of my talk, Santee-Cooper published their final 2023 IRP which shows the planned shut down of the 1,150 MW Winyah coal plant and plans to replace the generation largely with solar panels. Based on my experience yesterday, I thought it would be timely to attempt to explain in as short a post as possible, the importance of energy to our lives and where this primary energy can be sourced. Hint, it is not from wind and solar.
I have lived the American Dream and wish the same for my grandchildren to do so. I also pray that the U.S. politicians will wakeup and understand the energy sources to keep America strong, productive and free.
As shown above, the majority of the energy we depend on each day is sourced from traditional forms of primary energy. To me, sustainable living means that we Americans can continue to live our good lives as we have been. Doing so requires that reasonable cost, abundant forms of energy are an absolute pre-requisite. Replacing the traditional forms of energy with wind and solar is simply not possible. Attempting to do so by, shutting down, “Killing the supply chain”, demolishing and abolishing reliable forms of primary energy as shown above, is self sabotaging our quality of life. It is engineering fiction to believe that wind, solar and batteries can replace the Primary Energy sources that have served us so well for my entire life-time and I have been Blessed with many good years.
The most descriptive and simplified chart to show the forms of energy we depend on and how that energy is used, is the LLNL energy flow chart. The 2021 version is shown below.
Americans have used right at 100 Quadrillion Btus of Primary energy for over 20 years. The chart from 2021 shows a total of 97.3 Quads because 2021 was after the Covid lockdowns and reduced freedom of travel and reduced industrial production as well as other factors. The fact remains that Americans still used within +/- 3% of the decades long energy consumption, about the same amount of total Primary Energy, 100 Quads.
Electricity is Secondary Energy
The understanding of Primary and Secondary Energy should be clarified. When the government or MSM promotes “Electrify Everything” they are suggesting that electricity always will be available from some unlimited and magical source to power their EV’s, trucks, cooking, HVAC, industrial production, etc. The inference is that pollution free electricity can be provided by wind and solar to replace fossil fuels by simply spending billions of taxpayer dollars in incentives and installing millions of acres of wind farms and solar panels. My point here is to remind readers that Electricity is Secondary Energy. It must be generated using Primary energy! Batteries and hydrogen are also forms of Secondary Energy.
Let’s go back to the LLNL energy flow chart above. Note that wind and solar provided less than 5% of the total Primary energy in 2021. This is after over 30 years of incentives to force renewable wind and solar onto the Grid. Most of the other 95% Primary Energy was provided by conventional forms of energy.
How Can We Electrify Everything Without Increasing Generation From Traditional Forms of Energy?
The short answer is, we can’t. I have written other posts to explain. Donn Dears and Vaclav Smil together have written over 50 books to try to explain the importance of energy and the most likely sources for the future. I highly recommend their books to help understand the Importance of Energy and the differences between Primary and Secondary Energy..
Here is a list of the most common sources of carbon-free energy. Please refer to the LLNL Energy Flow chart above and then you decide how to replace or reduce fossil fuels by substituting those that are socially acceptable today:
Summary
I wanted to keep this post short and concise. For more details on the importance of energy in our lives, I suggest referring to other posts on my Blog and Donn Dears and Vaclav Smil’s books listed below.
The most important point of this post is to attempt to explain how keeping your quality of life depends on abundant, reasonable cost and reliable Primary Energy. Electrifying transportation and nearly everything else you use and doing so with wind and solar alone will be impossible in the near term.
This is an update on my comments to the IRP development for my local Regional Utility, Santee-Cooper. The last draft IRP has been published for comment and the figure below shows the expected load growth up to 2042. This Figure is from page 28 of the IRP presentation updated in April 2023. Shockingly, there is serious planning to shut down all coal plants by 2034 without having a Balanced Portfolio of replacement Bulk Power Supply that is Dispatchable, affordable and of reliable supply. Some energy news/issues authors, when discussing energy policy, speak metaphorically of “Falling off the Cliff” The illustration of projected load growth for Santee-Cooper is an example of planning to “Fall off the Cliff” by (NOT) Balancing Bulk Power Supply & load Demand. (The graph reminds me of the old saying, “Failing to Plan is a Plan for Failure”. How? By not providing adequate new generation capacity as older, reliable, dependable and Dispatchable coal units are retired. This is typical all across the U.S. and the western free world(6,10,14,15,15,17,18,19,20,21,22,23,24,25,27)
I had hoped that the more conservative, level headed General Assembly of S.C. would have better sense than to follow the “Woke policy” of the U.S. government and other states. There is still time to wake up to reality. (5,8)
The slide below is from my ENERUM presentation, August 2022. Data and chart are from the July 2022 NERC Report.(10) This shows 102 GW of Dispatchable & Reliable coal and nuclear plants shut down since 2011. This is shown to illustrate the fact that Santee-Cooper seems to be following the same destructive path as other utilities in the U.S.
Can a Great 80+ Year Record of Reliability and Affordability be Sustained While Retiring Coal Plants? Is S.C. Self Sabotaging our Great Record of Reasonable Cost, Reliable Bulk Power Supply? Why? Can the Legislature Stop the Madness?
It is my understanding, that the management of Santee-Cooper has been directed to formulate a plan to achieve Net Zero Carbon by 2050. Anyone that knows me, knows that I do not agree with this plan and my posts on this blog and my public presentations have clearly shown my analysis of the madness of Net Zero Carbon & the War on Coal. I have written letters to Santee-Cooper, the Governor, Congressional representatives and my S.C. Senator. Most of these have been made public. Myself and others that have knowledge of energy and electricity generation know that the path to Net Zero carbon is not possible by 2050.(4,5,6,7,8)Not without severe disruption of our way of life, our economy, industrial output, controlling inflation and national security. It is important for our state to generate electricity reliably, with high quality frequency and voltage control, from Dispatchable generators to meet customer Demand and do this 24/7 affordably under all weather conditions…..This has been done by Santee-Cooper for almost 90 years. Thanks to the reliability of coal, nuclear, natural gas generation and hydro-electric. Why would the Legislature force this fine Utility to sabotage its great record? The chart below is from the 2020 IRP. This lists the Dispatchable, Reliable, Affordable generating assets that have created and continue to provide a great record. In essence, the apparent path of the IRP update is to replace 61% of the reliable coal generation with “Intermittent” solar and wind generation.
Path to Jeopardizing S.C. Bulk Power Affordability, Reliability and Dispatchability
The S.C. Legislature has directed Santee-Cooper through “Act 90” to meet a net zero carbon goal by 2050.
The slide above is copied from the Santee-Cooper IRP presentation. My understanding is, that this is the direction ordered by the legislature. A plan to achieve Net Zero Carbon by 2050.
There is active planning to not only shut down the 1,150 MW Winyah coal plant in 2028 but also to shut down the 2,350 MW Cross Coal plant about five years later so that in 2034 all coal plants will be shut down. This is shown on the slides below. Shutting down all coal plants by 2034, in my opinion, will jeopardize the very favorable record of reasonable cost, reliable and Dispatchable electricity Bulk Power Supply that has become associated with Santee-Cooper’s great reputation. Even more importantly, South Carolina’s excellent record of attracting and keeping a thriving industrial base within this region. Electricity intensive industries such as aluminum and steel manufacturers/Recyclers have thrived here as manufacturers in other states have ended operations and ceded U.S. manufactured steel and aluminum capacity to China.
Let me digress and quote Vaclav Smil’s statement on decarbonization. From Professor Smil’s book, “How the World Really Works” This applies to S.C. Too!
“The real wrench in the works: we are a fossil-fueled civilization whose technical and scientific advances, quality of life, and prosperity rest on the combustion of huge quantities of fossil carbon, and we cannot simply walk away from this critical determinant of our fortunes in a few decades, never mind years. Complete decarbonization of the global economy by 2050 is now conceivable only at the cost of unthinkable global economic retreat, or as a result of extraordinarily rapid transformations relying on near-miraculous technical advances.” Smil continues….
But who is going, willingly, to engineer decarbonization while we are still lacking any convincing, practical, affordable global strategy and technical means to pursue the latter? What will actually happen? The gap between wishful thinking and reality is vast, but in a democratic society no contest of ideas and proposals can proceed in rational ways without all sides sharing at least a modicum of relevant information about the real world, rather than trotting out their biases and advancing claims disconnected from physical possibilities.”
I have written other posts on this Blog to express my thoughts on competition with China and the importance for America to reshore U.S. manufacturing. This my friends, is in our backyard, our neighborhood, our state. This is a fact as stated above10). Premature retirements of reliable coal plants has been occurring at an alarming rate all across the U.S. Do we have to follow the same foolish self sabotaging policies of NY, Hawaii, Germany, the UK and Texas? I hope not. (12,13,14,15,)
Future Bulk Power Generation Capacity, The Apparent Plan to Self Sabotage Reliable Bulk Power Supply
Expected Outcome of Adding Over 4,250 MW of Non Dispatchable, Intermittent Bulk Power Supply
If all of the coal plants are retired and the portfolio shown above is used. Her are my predictions, based on the experiences of Hawaii, California, Texas, Germany, Denmark and the UK.
California is thought by some in government to be a model for the U.S. with regard to renewable energy policy. I do not agree. Here is a recent post by the CEO of the Electric Power Research Institute on how the California electric load (as reported by CAISO) has morphed from a “Duck Curve to a Canyon Curve”. Here is a screenshot of Dr. Mansoor’s post:
The “Canyon” curve represents high renewable generation during the peak sunshine of the day where California has bragging rights to sourcing almost all of their electricity from solar collectors. This is great until folks come home from work, mom starts dinner in her totally electric home and Dad plugs in his EV for charging. By early evening, electricity demand skyrockets out of the Canyon and must, for the sake of reliability, be generated to meet demand from Dispatchable sources.
Battery storage is not Bulk Power Supply. Batteries store electricity they do not generate electricity. Batteries are capable, depending on the size of the installation, of providing minutes or hours of backup. The largest battery storage in the U.S. is the Vistra Energy, Moss Landing facility in CA. The CAISO load for April 27 is expected to be about 30,000 MW. Note the largest battery storage facility in the world, Moss Landing, is 1600 MW which is about 5% of the Demand and only capable of providing minutes or hours of stored electricity.
Here is another post from another energy expert on LinkedIn. This graphic shows the electric generation through the day which includes battery storage.
The Moss Landing Storage facility is rated at 400/1600 MW and is capable of storing excess renewable generation for hours so that it can be used as the sun sets and kick in as the “Canyon Curve” and CA power supply and Demand Curves above become reality of demand. Emphasis should be on “Hours” it is not capable of backup during a days long cold severe winter storm, such as NC and SC experienced over Christmas week, 2022. Another example is the 150 MW Battery storage designed for Queensland, Australia and an artists depiction below. This is from an essay reviewing the NY electricity future written on the Blog, Watts Up With That.
Battery storage such as shown above is very costly. For example, the 150 MW facility above is projected to cost $250/kWh. Therefore for 12 hours of storage for 450 MW, the cost would be about $1.35 Billion dollars. Keep in mind, this is for 12 hours storage of only 450 MW of power. Winter storms such as the Christmas 2022 storm lasted longer than 12 hours and even very conservative, steeped in energy expertise Duke Energy, also with a great reputation for reliable electric service, had rolling Blackouts. Ditto for TVA(18,19,20,21,22,23).
When the sun is not shining and the wind not blowing, then the generation must be purchased from neighboring Utilities or generated with Dispatchable natural gas generation. The plan shown above includes 4,316 MW of natural gas generation. This combined with the 322 MW of Summer Unit #1 nuclear power totals 4,638 MW. The wind generators, though intermittent, could generate another 400 MW to total 5,038 MW. The projections of up to 9,000 MW Demand in 2050 (according to Santee-Cooper projections) then will require additional Dispatchable generation which is likely to be natural gas CT’s or Combined Cycle facilities. Think for example of the uncertain growth of Electric Vehicles. If much of transportation is “Electrified”, then the high range projections of about 9,000 MW peaks can be expected in 2050 or before. So, why would we kill the coal plants that have served South Carolinians so well?
This reminds me of my experiences working for CP&L in the 1970’s when the manager of Fossil Plant Engineering pointed to an oil fueled CT and proclaimed to me, then a young engineer, “That young man is a monument to poor planning”. Yes, as CP&L (That was before CP&L merged with Florida Progress and was later absorbed by Duke Energy). I see history repeating here as so much faith in renewables today is somewhat like the high expectations of nuclear being “Too Cheap to Meter” beliefs of the 1970’s. However, nuclear power eventually delivered. Wind and solar are not capable of replacing coal, nuclear and gas fueled Bulk Power Generation. In the 1970’s the Bulk Power Supply gaps were made up with quickly installed, oil fueled CT’s. Today, thanks to reliable, affordable natural gas, the backup generation, when solar and wind cannot deliver, is gas fueled CT’s or Combined Cycle plants. This is doable and satisfactory… providing that pipelines are of adequate capacity and natural gas remains affordable and Federal Regulations on drilling, Hydraulic Fracturing, pipelines and fuel supply infra-structure is expanded as needed, when it is needed. The Federal Government is wrong on their war on carbon and the natural gas resources just may not be as abundant in 2040 or 2050 as they are now. Because, the Federal Government currently highly regulates exploration, drilling, production and transport of any fossil fuels. The uncertainty of future primary energy supply is why a Balanced Generation Portfolio is important. A Balanced Energy Portfolio will include nuclear, coal, gas and renewables.
Have the Importance of Reserves Been Forgotten?
Santee-Cooper is a Regional Utility. In other states, such as PA, OH, WVA, NJ & DE many utilities the size of Santee-Cooper have joined RTO’s (Regional Transmission Operators) such as the PJM Interconnection. In the Midwest it is MISO (Midwestern Independent System Operator) With RTO’s, the electricity generation is shared across state lines and with different utilities with separation of the ownership of the generating plants and the transmission and distribution of the Bulk Power. This has eliminated accountability for individual utilities such as Philadelphia Electric, Potomac Electric Power Company, Public Service of NJ, PP&L and others to plan for Reserve Generation capacity. Therefore, there is no accountability for lack of reserves. I presented examples in my ENERUM talk slides(6) . There is some talk of Santee-Cooper joining a similar RTO with the Southeast Electric Exchange. In my strong opinion and based on the references listed below and my experiences, Santee-Cooper should plan for their own (Our own) reserves. Reserve generation from others states was depended on Christmas week 2022 by TVA and Duke Energy. Two fine utilities, also with great records from the past. But, the reserves from neighboring states were not available due to Demand exceeding supply. Reserves of 15-20% have always been important for reliability and to keep generation costs reasonable by not requiring the startup of backup power generation using high cost fuels such as Diesel or spot market gas. Donn Dears has written several books on this. Here is a graph from the book, “Clean Energy Crisis”, on the Reserve generation that was planned in 2018. However, Texas Blackouts in 2021 killed over 200 people. The ERCOT planners in 2018 had performed due diligence as Santee-Cooper is doing now with well respected consulting services to perform computer analyses of planned reserve margins. Do we need to learn the hard way as Texans did in 2021?
Facts to be Consider regarding Electricity and South Carolina’s High Quality of Life
The experiences of other states and other countries should be considered. I cited the examples of California, Texas and Hawaii above. Much analysis has been put into the planning by some very smart engineers and planners. However, computer modeling of the “Future” weather, fuel prices, EV use, population growth, industrial growth and other uncertainties, will likely create a need for other sources than wind and solar renewables. Just as Texas learned in 2021 after performing similar planning.
Primary Energy and Secondary Energy
Each S.C. resident on average uses about 300 million Btus per year in Primary Energy. If the trend to “Electrify Everything” continues, then more of the energy use currently provided at reasonble prices for transportation and our high quality of life, will be substituted for by (Secondary Energy) electricity or hydrogen. Such as more EV’s as the government is forcing us to use. Therefore, the growth of electricity demand may be much greater than expected. Thus, my title which relates to potential 9,000 MW Demand in 2050.
Over 50% of South Carolina’s electricity has been provided by nuclear power for decades. SC is rated as #3 in the nation in nuclear power generation. Nuclear power has served SC citizens and industry well. Safe, affordable, Base load capable at 90+% capacity factor and proven. However, the great record and importance of nuclear is not discussed by politicians or even utilities. For example, Palmetto Electric promotes the use of “Green Power” when in fact, it is a small contributor to the total portfolio of power generation. Here is an example of “Green indoctrination” by a bill insert that misleadingly leads citizens to believe that most of their power is from renewables:
The reality of our future electricity generation is that nuclear is the most important and least carbon intensive fuel for electricity generation. The plan to expand the Summer nuclear plant with two additional units was a very good idea. However, it was not to be because of poor management, limited trained talent and failure by Bankruptcy of Westinghouse, the primary contractor. The planned new Pee Dee coal plant near Florence was also a good idea and provided for natural growth of generating capacity to meet Demand. Pee Dee, (600 MW coal plant) in my understanding, was killed because of outside influence of Environmental Extremists. Had the Summer Units 2 & 3 and the 600 MW Pee Dee Clean Coal Plant been built as planned, then together these three units would have provided 2,800 MW of Base Load plus reliable, affordable and clean, Dispatchable Bulk Power. Including some reserve generation capacity.
Is the Great State of South Carolina going to sabotage our future just because other countries and states are doing so? I hope not.
Conclusions
The“War on Carbon” is based on politics and corrupted science. It is about Socialism and not about protecting the environment. The South Carolina Legislature seems to be just as gullible of the green myth as the current Federal government leaders.
The UN-IPCC is also Politically Driven and Not based on protection of the environment or to provide for the best interests of the people of the world. The Paris Climate Agreement is not in the best interests of America, the free western world or even for protection of the environment. It is politically motivated.
The path to Net Zero Carbon is steadily weakening our country. It will eventually destroy America’s productive capacity, lower our standard of living and place national security at risk. It will hasten the decline of America and the Rise of China.
America requires 100 Quadrillion BTUs of energy each year to sustain our quality of life. This is about 300 million BTUs per person, per year. Currently, after decades of subsidies, wind and solar provide about 5% of the total PRIMARY energy we use. Wind and solar cannot replace the other 95% of energy we need.
A Balanced Portfolio of Generating Capacity as is currently installed at Santee-Cooper generating plants, is the best path forward to sustain our high quality of life and economic prosperity. Reserve generation from dynamic generators is needed. Battery backup does not provide the same system voltage and frequency control as spinning reserve generator rotors do.
Electric generation planning in the 1970’s and 1980’s was better than today. There is no Energy Policy in America, there is only a decarbonization plan(4,5,6,7), there is no well thought out plan to replace the reliable and dispatchable generating capacity that is being shut down across the country. As during the 1970’s when nuclear units were late coming into service, the quickest available generating capacity was to install gas turbines. This is likely here in SC if the coal plants are retired before Dispatchable or Base Load replacement generation is installed.
Recommendations
Initiate a comprehensive Energy and Electricity Education program to provide 1. public education on energy, 2. Public School education on energy and electricity generation and 3. Public Technical/Trade School education to prepare youth for the construction workforce. Energy Education is recommendation #1 of the path forward. Public education is needed to reverse the myth that wind and solar can replace coal, gas and nuclear power generation. This is priority #1 because so many people are “Green Energy” indoctrinated.
Plan and continue to provide adequate Operations and maintenance funds for repairs and component replacements of the boilers, pumps, turbines and all of the equipment installed at the Cross Coal Plant. Keep the full 2,350 MW capacity so that it can be used until replacement generation is built and proven.
Construct the 600 MW Pee Dee Coal plant that the components were purchased for in 2009.
Plan and begin construction on at least 2,000 MW of nuclear capacity. (as was planned for the Summer Units 2 & 3). Please re-read recommendation #1 above.
Plan and construct at least 1,750 MW of combined cycle gas plants
The coal, nuclear and gas plants 2,3 & 4 could replace the existing Cross coal plant capacity, thus continuing a “Balanced Generation Portfolio”
Summary
South Carolina can be an example of applied Common Sense Energy policies that can be a model for the U.S.A. and for the world. The current reasonable cost electricity in SC is amongst the lowest cost in the nation. Over 50% is generated from 4 nuclear plants with seven units. Four of these 7 nuclear units started up in the 1970’s. These four units operating licenses will expire in the 2030’s. They may be extended for another 20 or 30 years by the NRC but, plans should be made to construct new nuclear units for replacement of carbon free, Dispatchable, reasonable cost electricity.
Every time I present a course on energy and electricity generation the comments come back, “You did not discuss Climate Change and Decarbonization”. My response is, I am not an atmospheric scientist. I am an experienced power engineer. My beef with the current path toward Net Zero Carbon is, there is not an organized plan to replace the vitally important electric generation that has kept our country strong. If the politicians were really serious about reducing carbon dioxide emissions and “Sustaining” our high quality of living, then nuclear plants would be on a fast track to construction. After the Summer 2 & 3 failure, SC politicians are rightfully concerned about the financial risks. Plant Vogtle in GA is an example of a major budget overrun. Last cost estimate that I saw shows that Vogtle will cost $34 Billion and the original planned cost was less than half the ultimate cost. Also, it took ten years to just get one of the units running.
In my opinion and research, I feel the war on carbon is a plan initiated by the U.N. (including competitors/enemies of the U.S.A.) and Socialists that have an agenda other than clean power generation. If we wish to “Sustain our high quality of life“, then we need a reasonable cost, abundant and reliable electricity supply. Nuclear is the most accepted approach to achieving that goal. Three examples of applying a Balanced Energy Portfolio with a high percentage of nuclear are S.C. (1970-2030), Sweden and Finland. For research into why I believe the “War on Carbon” is political, not environmentally driven, I have included dozens of references below. My concern for Santee-Cooper and for America is to keep our Bulk Power Supply safe, secure, reliable and affordable. Also, sourced from a U.S. Supply-Chain.
The Supply-Chain of all of the future generation equipment, in an ideal scenario, would be from U.S. sources. Including manufacturing and construction talent. The workforce education is a weakness that I believe had part in the $9 Billion dollar Summer 2 & 3 construction debacle. We should learn from the past 50 years of electric generating history. The successes and the failures.
Arshad Mansoor, CEO of EPRI (Electric Power Research Institute) LinkedIn post, April 25, 2023 on the CAISO System. EPRI Post on the CAISO “Duck Curve changed to Canyon Curve” of Electric Load: https://www.linkedin.com/posts/activity-7056612841755181056-SCPK?utm_source=share&utm_medium=member_desktop
In My opinion and research, the Path to Net Zero Carbon is Based on Corrupted Science and Political Ploys to Promote Socialism and One World Government, Not to Save the Planet or to Improve the Environment. Therefore, to substantiate this claim the following references are provided:
I live in Hilton Head, SC and our local electricity provider is Palmetto Electric Cooperative. Palmetto Electric obtains most, if not all of their Bulk Power from the SC Public Service Authority, known as Santee-Cooper. Santee-Cooper has a long history of providing reliable, reasonable cost power to the low country of SC. However, due to political pressure, they like most other utilities are working toward Net Zero Carbon by 2050. I disagree with this path and have written a couple letters to share my opinion and experiences. Here below is my latest letter concerning the creation of the next Integrated Resource Plan. The figure below shows Santee-Cooper load growth projections and the loss of the coal capacity from the Winyah Generating Station in 2028. It is this loss of Dispatchable capacity in 2028 that prompted my letter:
Dear Friends at Santee-Cooper,
Thank you for the opportunity to follow your development of the IRP. I would like to submit my additional comments below:
Santee-Cooper has a long history of providing reliable power to your service territory. During most of the preceding 89 years, the affordability, Dispatchability and reliability of coal fuel has been largely responsible for the reasonable cost rates and the attraction of industry. Especially energy intensive industries such as Nucor Steel and Century Aluminum. The 322 MW of nuclear power provided by Santee-Cooper’s ownership portion of the Summer #1 nuclear plant has also helped maintain favorable rates and reliability.
I have many years of experience in power generation using most common fuels. Most as a senior engineer. Based on my experience and including travels world-wide, I strongly favor a Balanced Generation Portfolio of coal, nuclear, gas, hydro and up to about 15% renewables.
Santee-Cooper once had a good plan, about 15 years ago when you purchased the components for the 600 MW Pee Dee Clean Coal plant and the 45% ownership portion of units 2 & 3 Summer nuclear plant. The Summer nuclear plant units 2 & 3 seem to be history now. Pee Dee as I understand it is also history. However, the major equipment for the 600 MW Pee Dee coal plant, as I understand it, are still owned by Santee-Cooper.
I strongly believe that the 600MW Pee Dee Coal plant should be built along with plans for additional units.
America is headed for an Energy Crisis and we already have had Blackouts in TN, CA, TX and NC during severe weather during peak Demand periods. As recently in NC and TN as Christmas week, 2022.
With the shutdown of the Winyah coal plant, continued electricity Demand increases and emphasis on intermittent renewable power to replace the coal generating capacity, South Carolina is at risk of Blackouts in our future at worse and escalating electricity generation costs at best if we do not keep and maintain the coal generation capacity.
I understand that the goal of Net Zero Carbon is the goal, due to pressure from the S.C. Legislature. In my strong opinion, Net Zero Carbon is wrong and in fact, it will be impossible to achieve by 2040 or even 2050 by depending on wind and solar. I have written to Senator Tom Davis to ask that he initiate legislative action to keep fossil fuels viable beyond 2050. At least until electricity storage technologies catch up.
It is my hope that the Santee-Cooper staff will evaluate all options and including in the evaluation, consider the experiences of Hawaii, California, Texas, the UK, Germany and the entire European Union. I cite the example of Hawaii. Hawaii of course, is a true “Energy Island” and has no Grid connection as SC does. Hawaii has implemented Net Zero Carbon policies and included the premature shut down of the Barber’s Point coal plant, 180 MW unit. As a result of the renewable policies Hawaii now has the highest cost electricity ($0.45/kWh) of any U.S. state. Why? Because the intermittent wind and solar needs to be backed up with conventional fuels. With no coal or gas option, that leaves Diesel fuel as the Dispatchable alternate fuel. The highest cost primary energy available.
Three more examples are the UK.( $0.48/kWh), Denmark ($0.54/kWh) And Germany ($0.53/kWh) . Here are links to the electricity costs in Germany, Denmark and the UK. https://www.globalpetrolprices.com/electricity_prices/ A print out of the Global Electricity prices is attached at the end of this letter.
The more renewables that are installed, the higher the cost of electricity. The low cost that is often quoted is for installation cost by “Nameplate” rating. $/kWh capacity. However, when the backup power fuel is considered, as has been experienced in Hawaii, the cost to the consumer is much higher.
I have written on my Blog many reasons why a Balanced Generation Portfolio is needed. My Blog is here:
Global electricity prices are attached below as an appendix:
Note the highest Global cost electricity cost (please see last page) is in the UK, Germany and Denmark. All of which have made huge commitments to Renewable wind and solar power to replace coal and nuclear. So far, SC is lower than the average cost of the 50 U.S. states. Let’s keep the costs affordable and service reliable. Thank you.
Public Misinformation Example
The bill insert below suggests that Hilton Head Island electricity is provided by “Green Power” when in fact most of the power supply results from coal, gas and nuclear generation. In fact, the great state of SC has over 55% of our electricity provided by nuclear power but it is rarely discussed by the MSM or even the electricity providers.
Here are some additional References and Reading materials for Backup to the reasoning behind my letter above:
Sierra Club Beyond Coal Website. This organization has created a lot of harm to the U.S.A.and they are funded with Billions$$$: https://coal.sierraclub.org


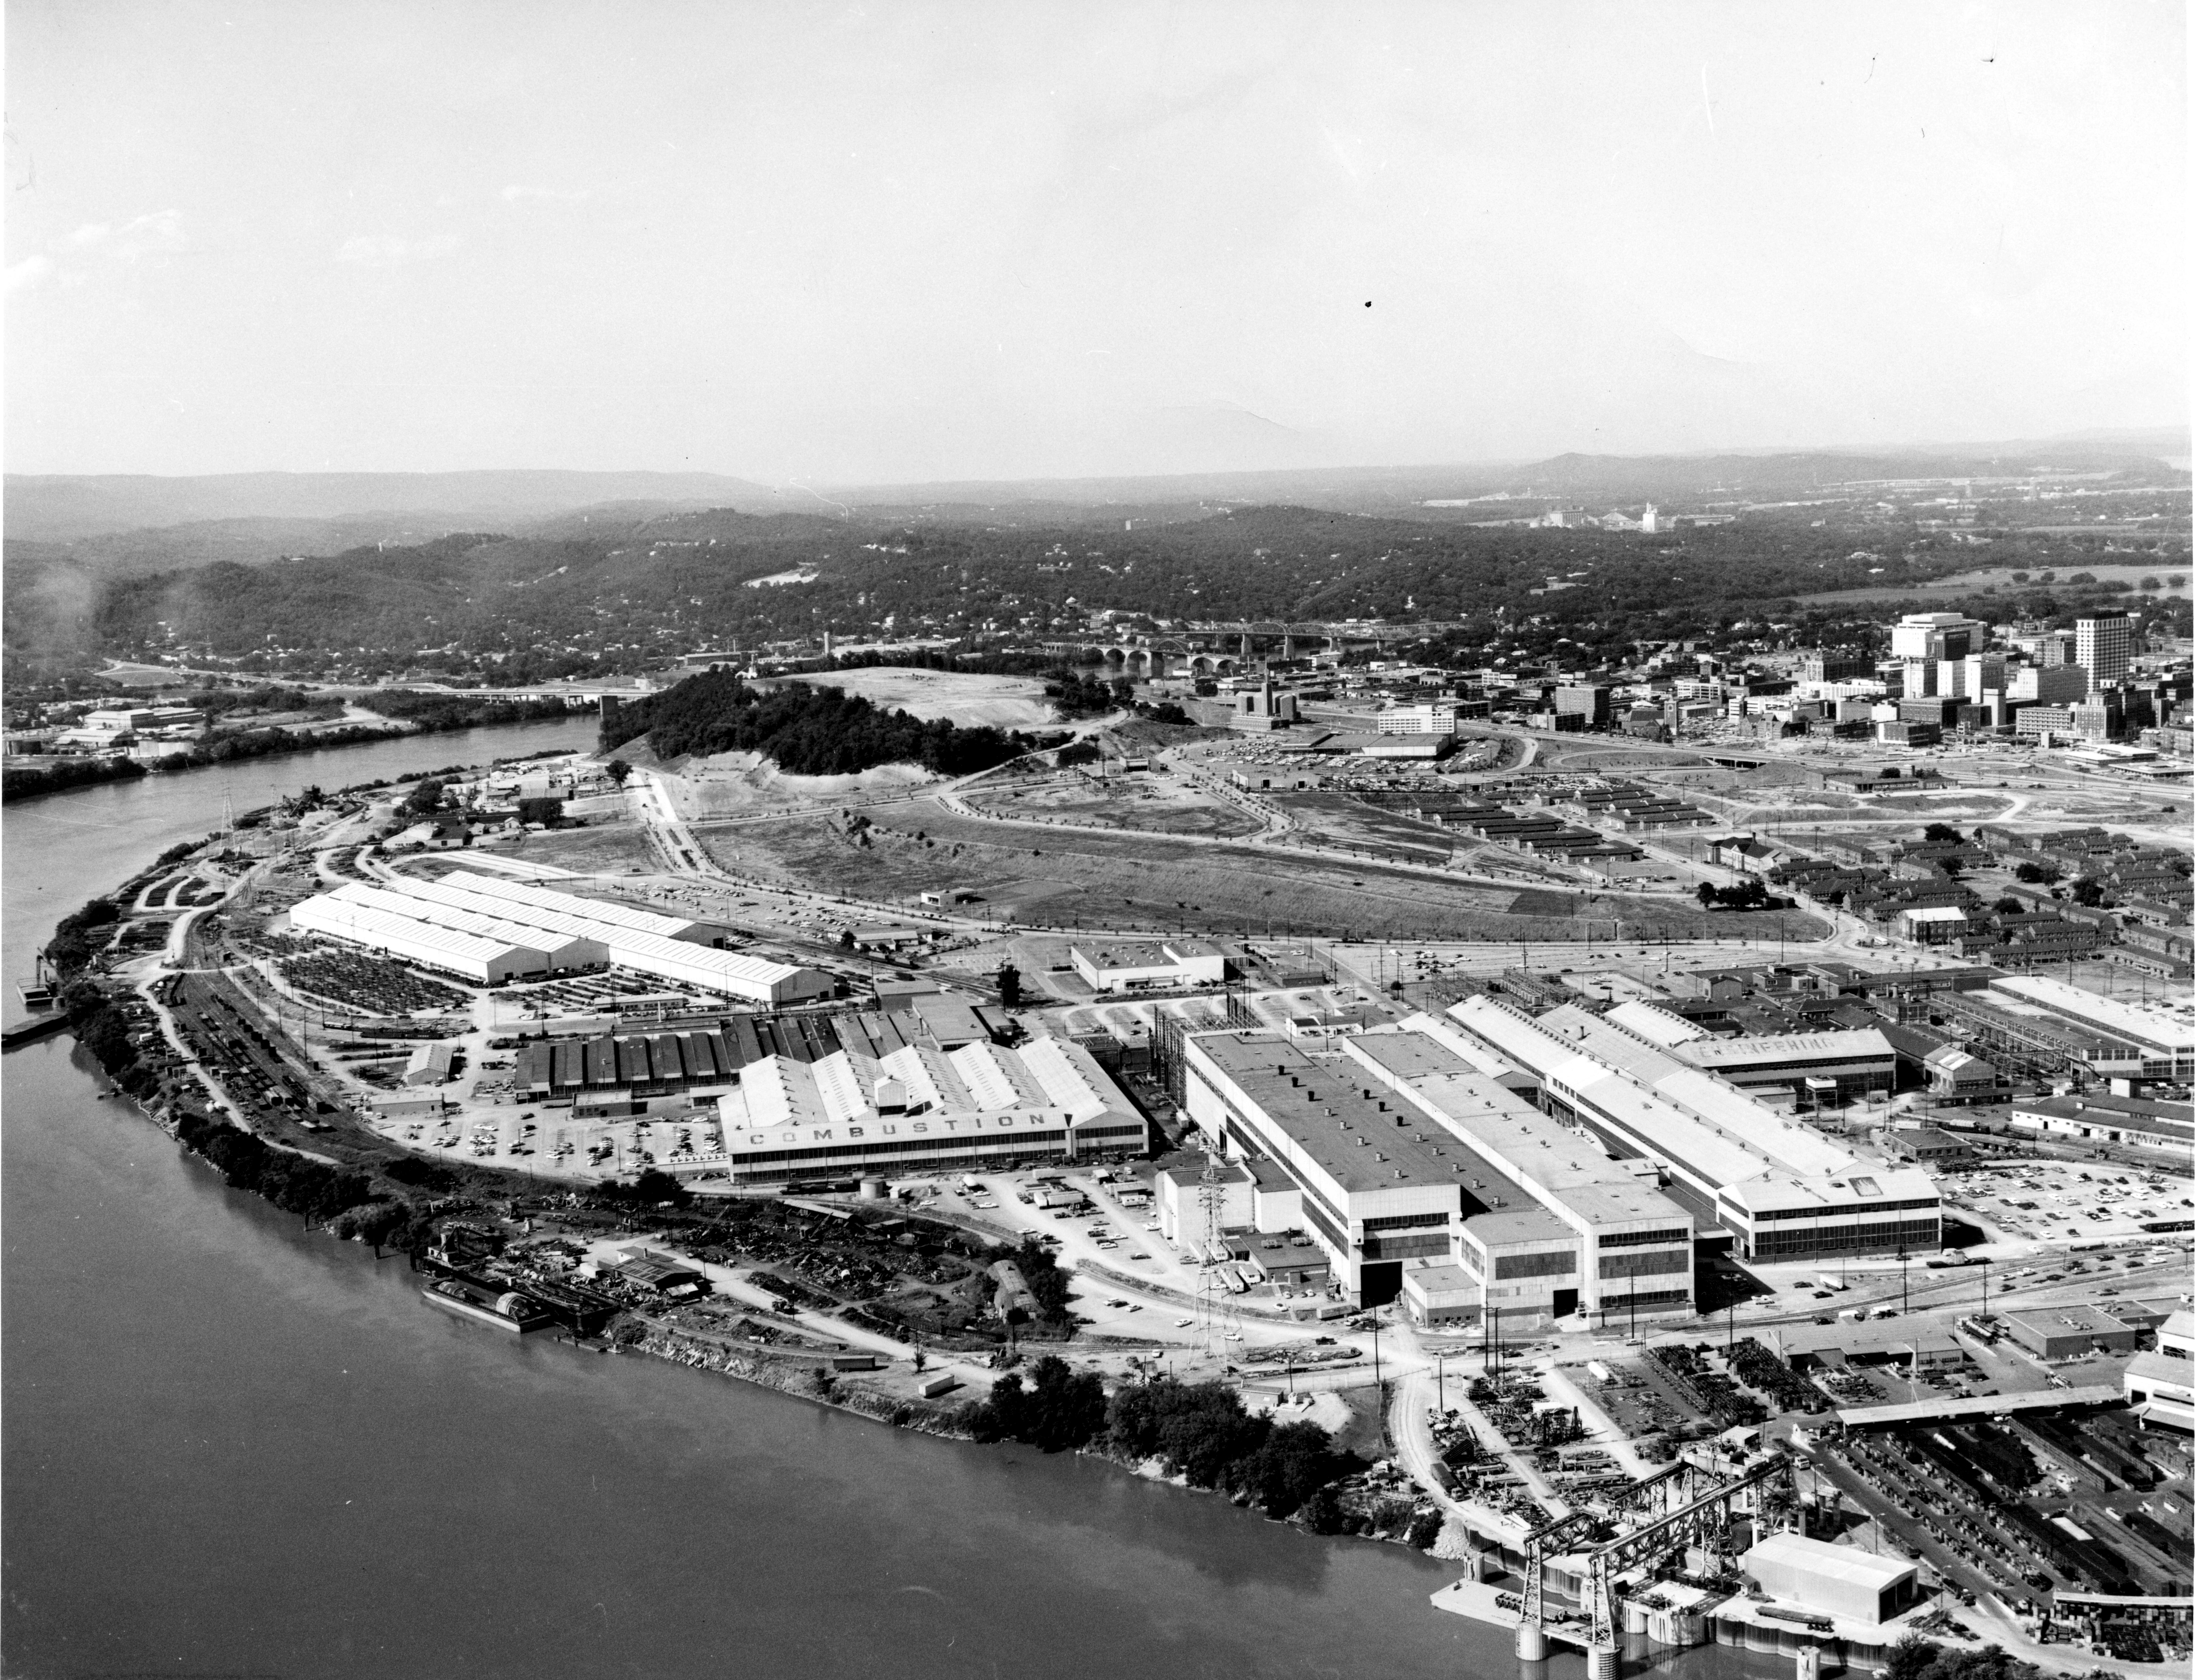


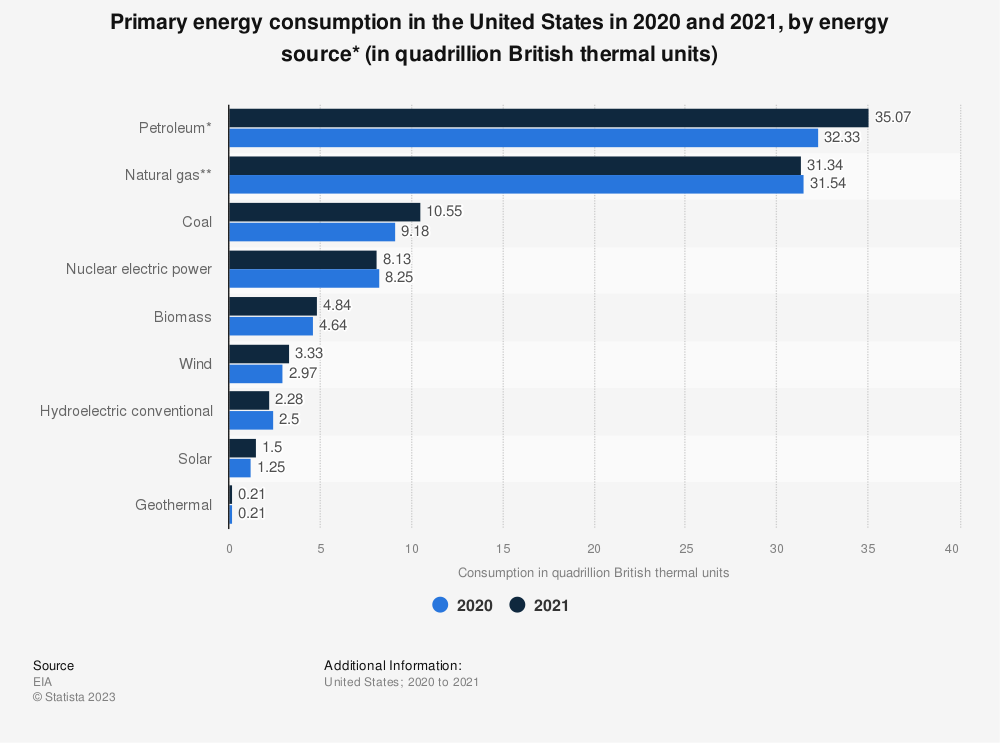


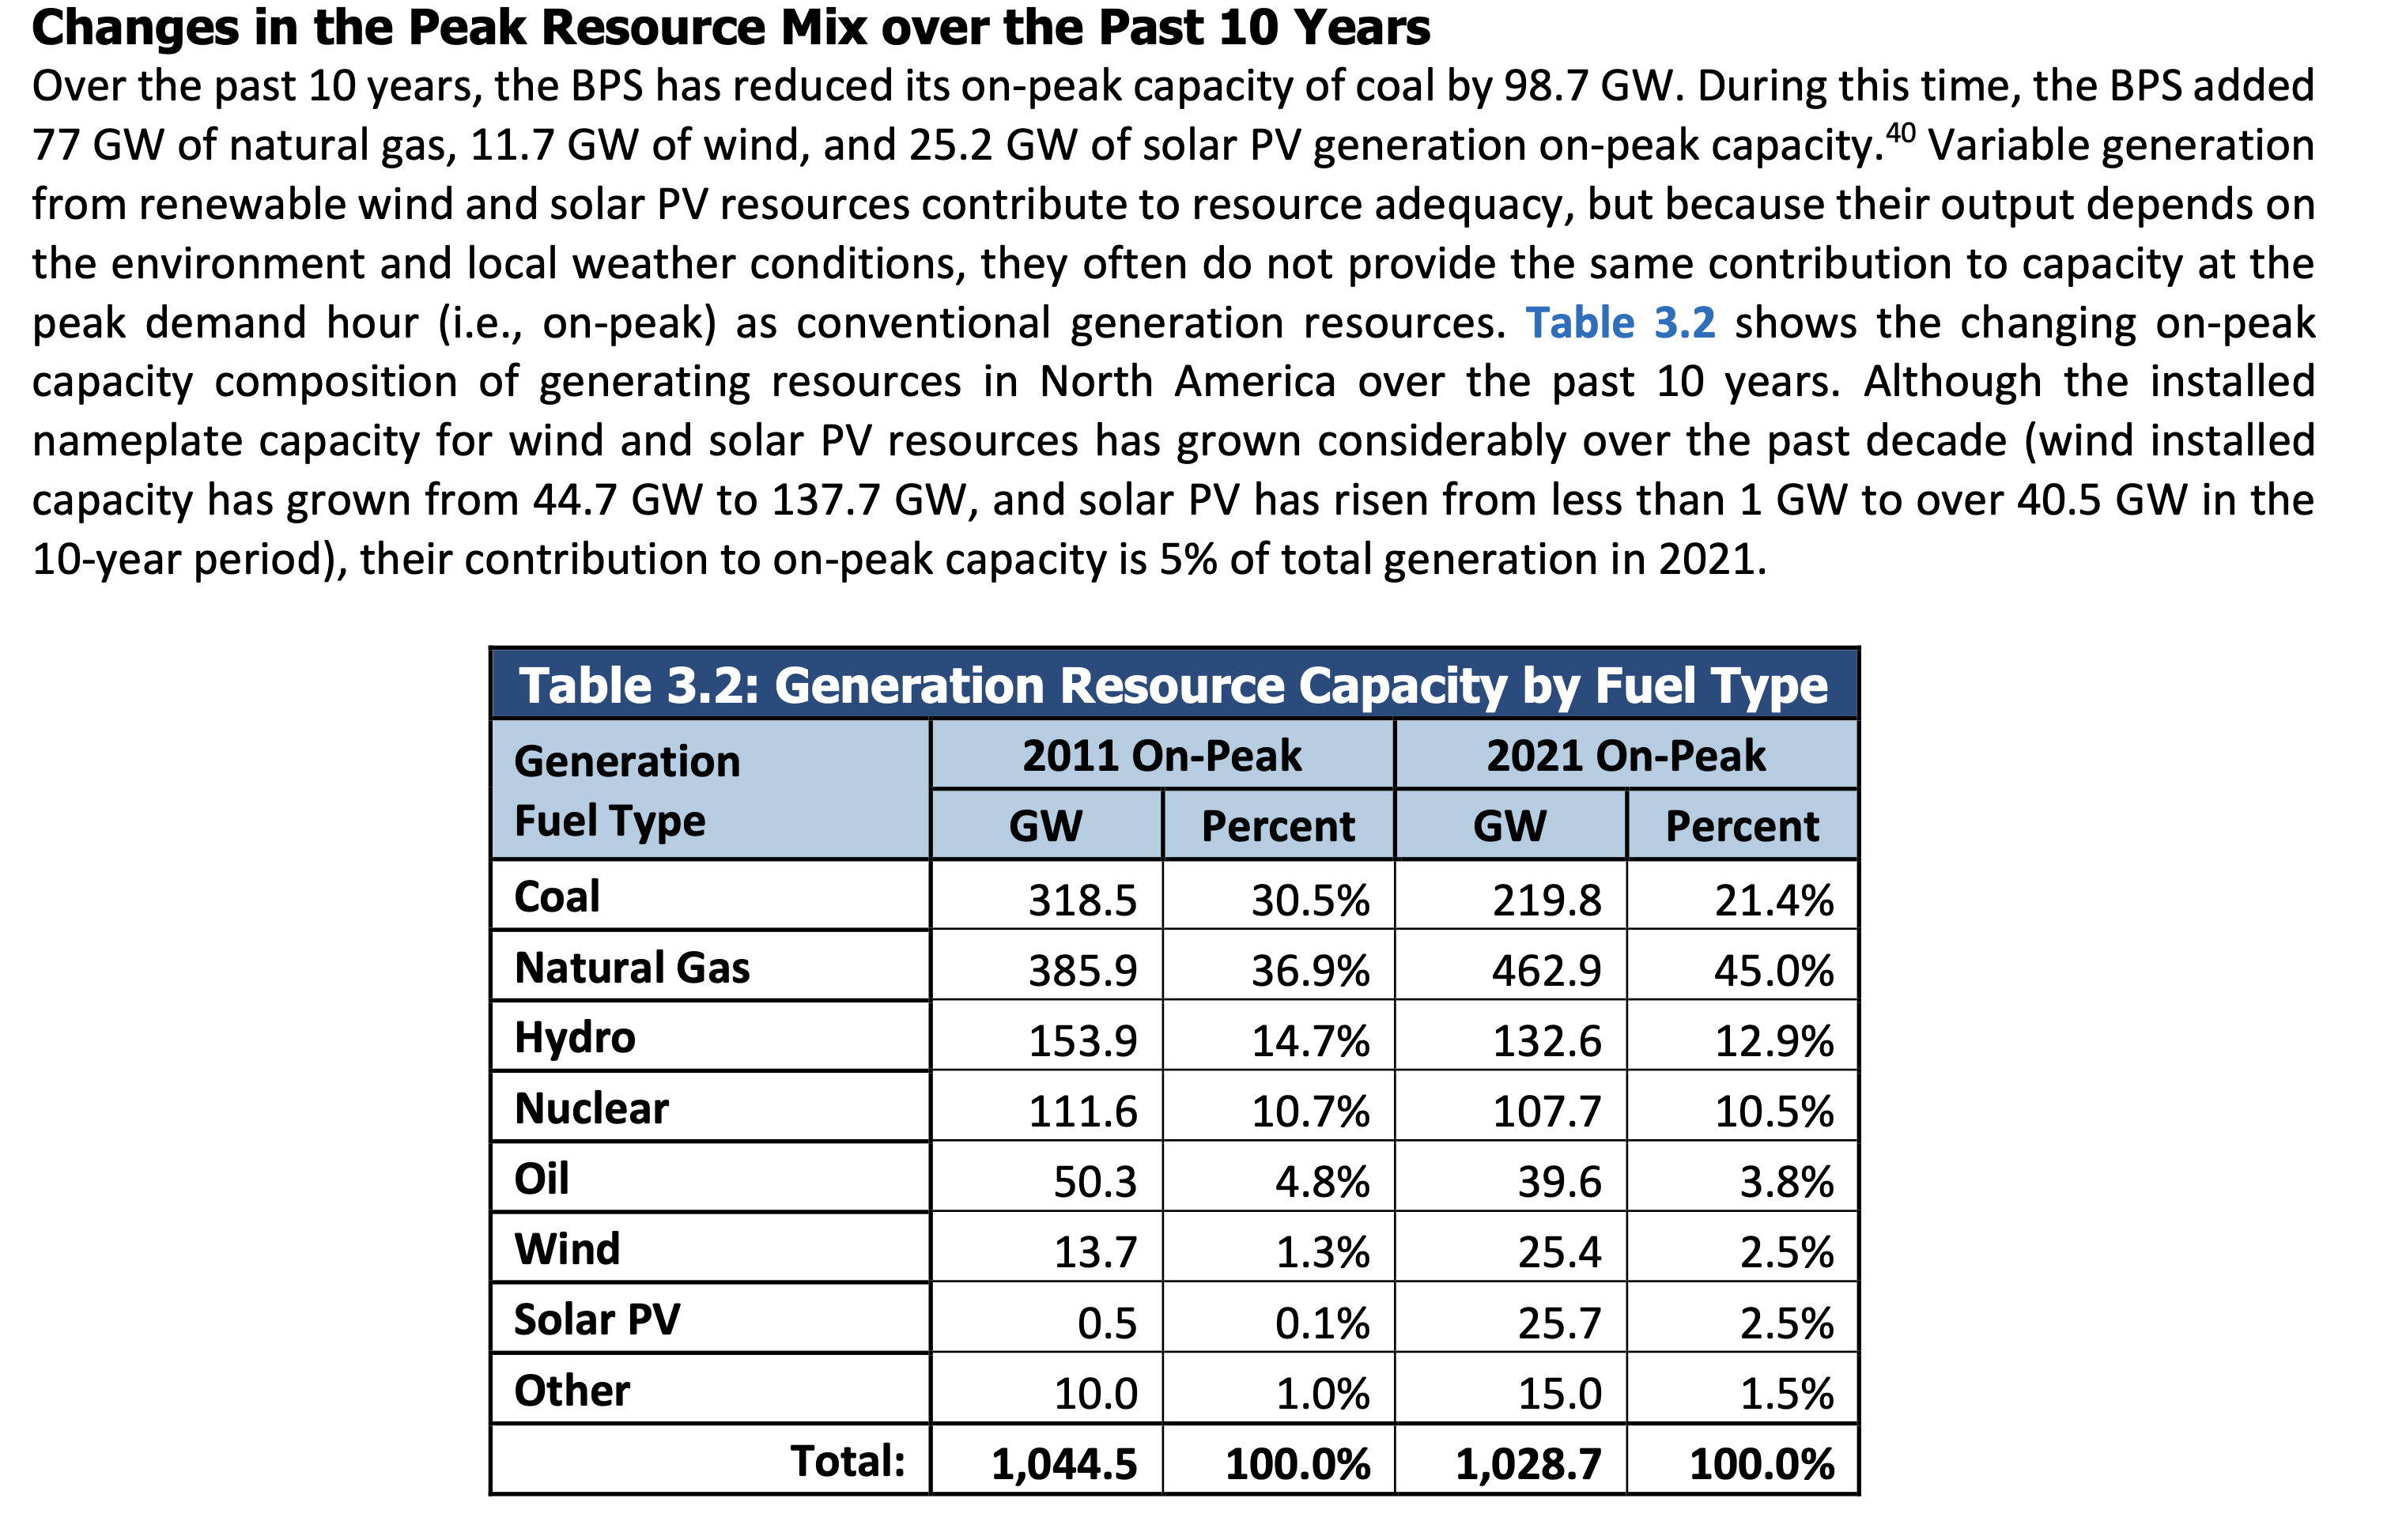

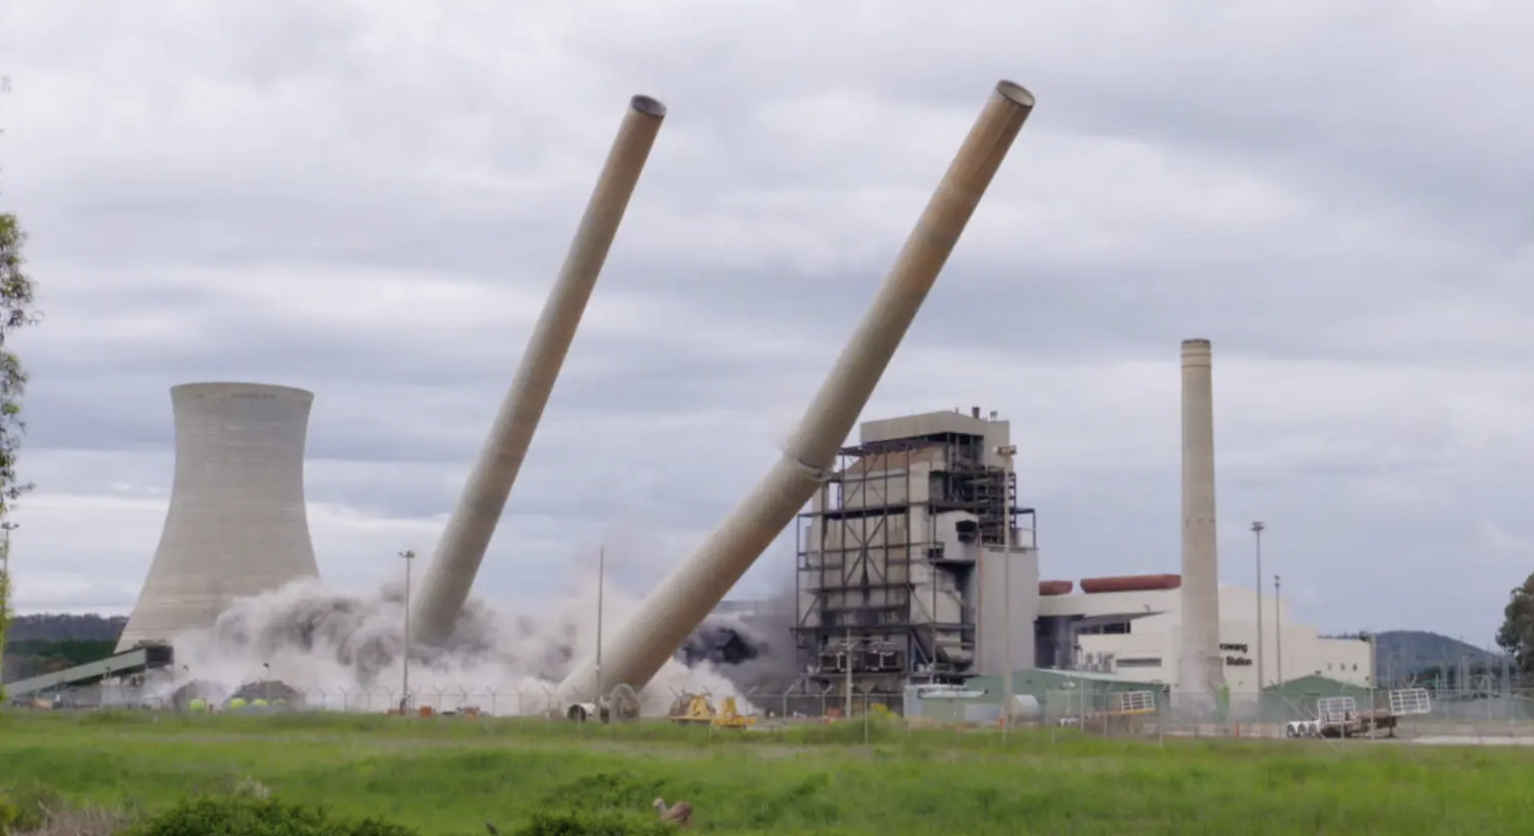

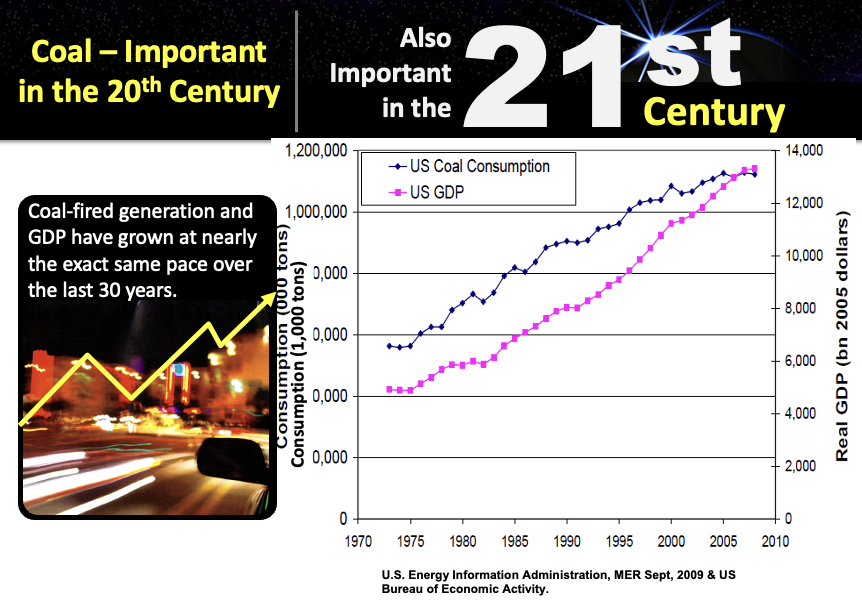


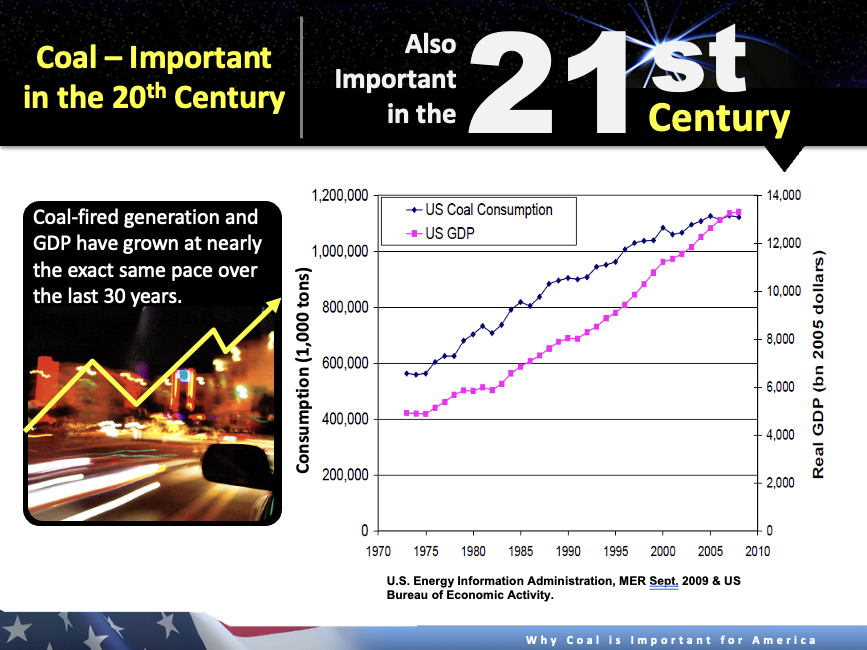

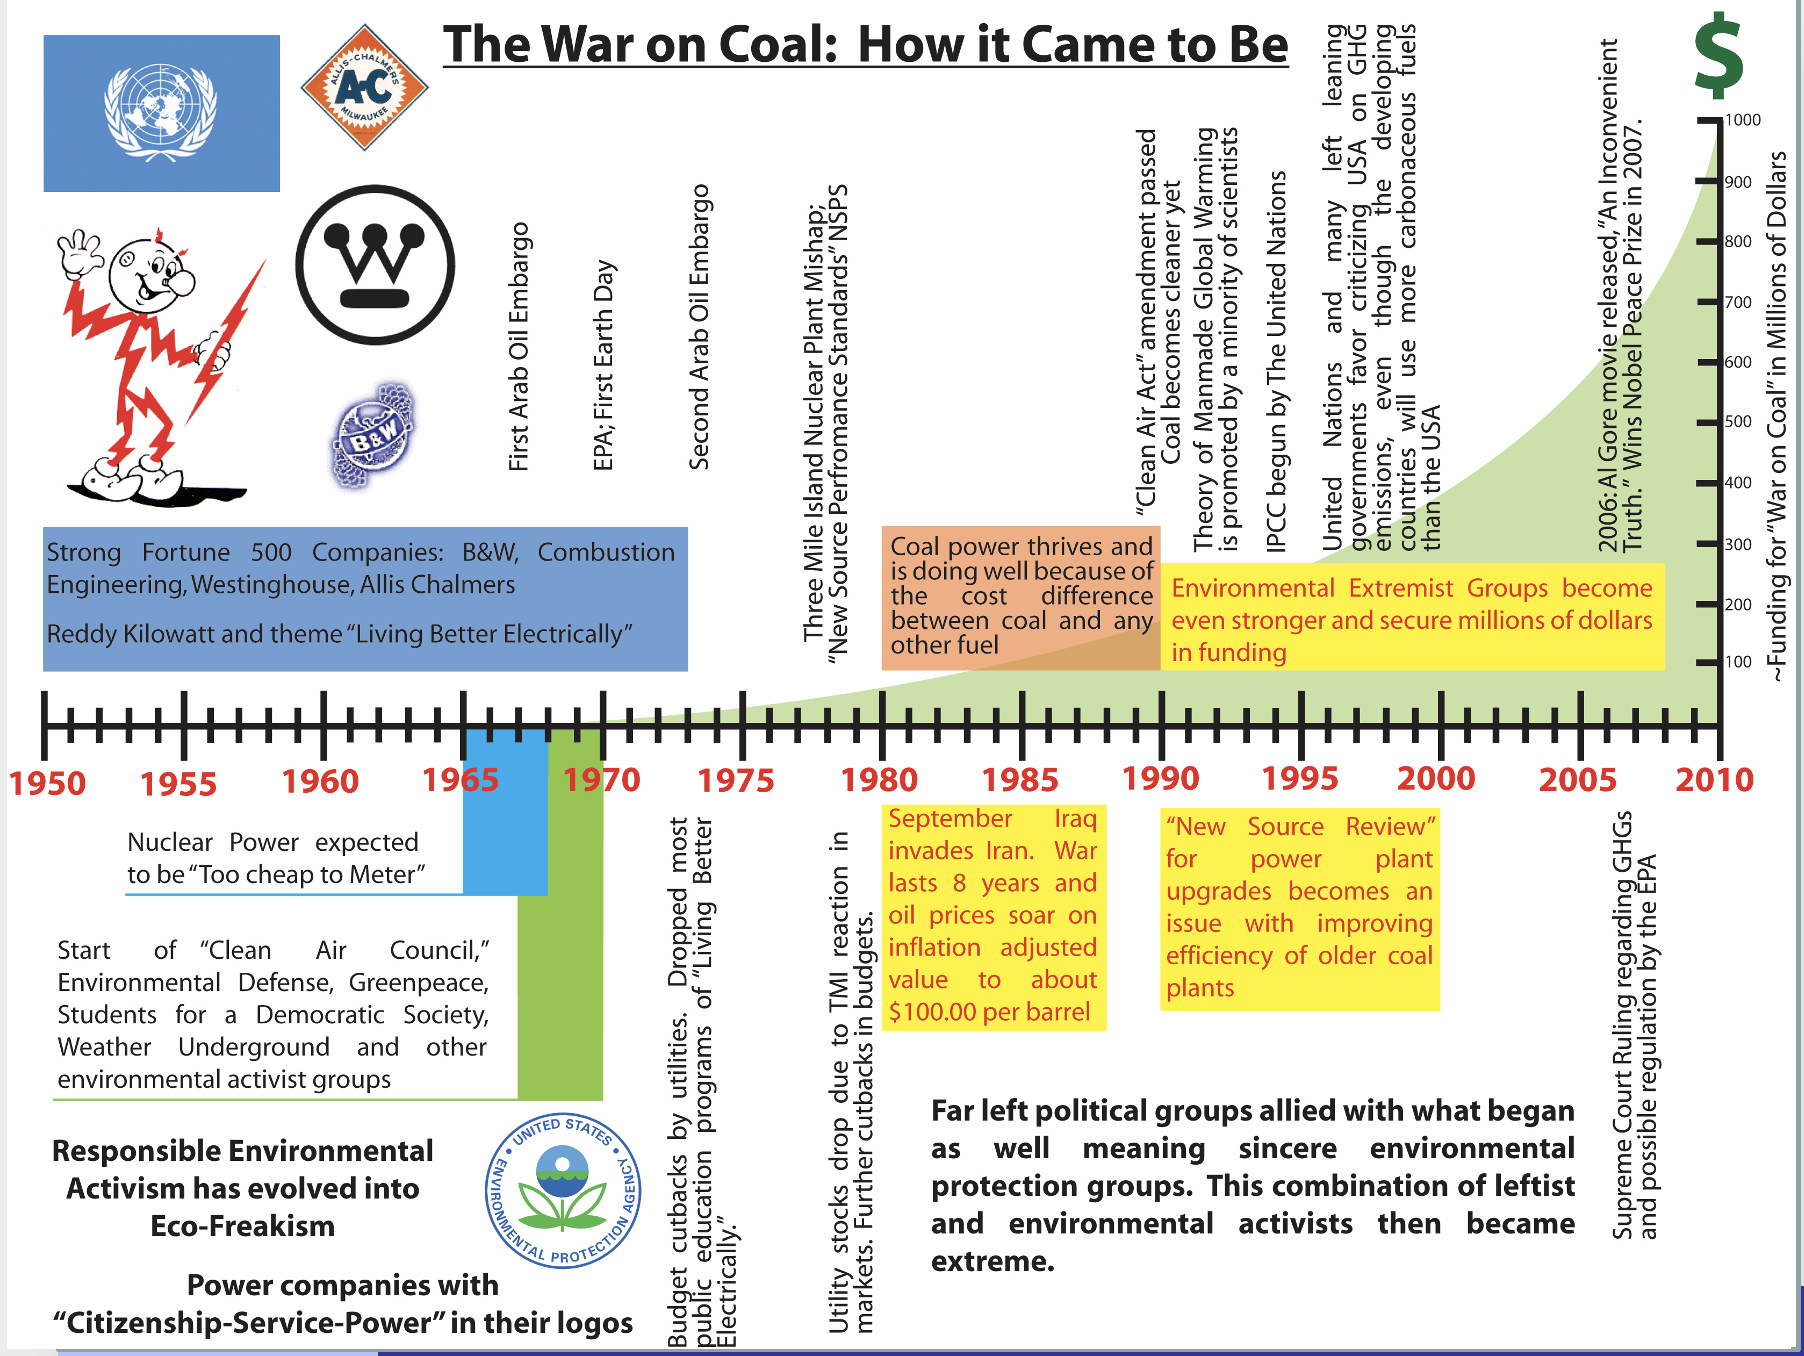


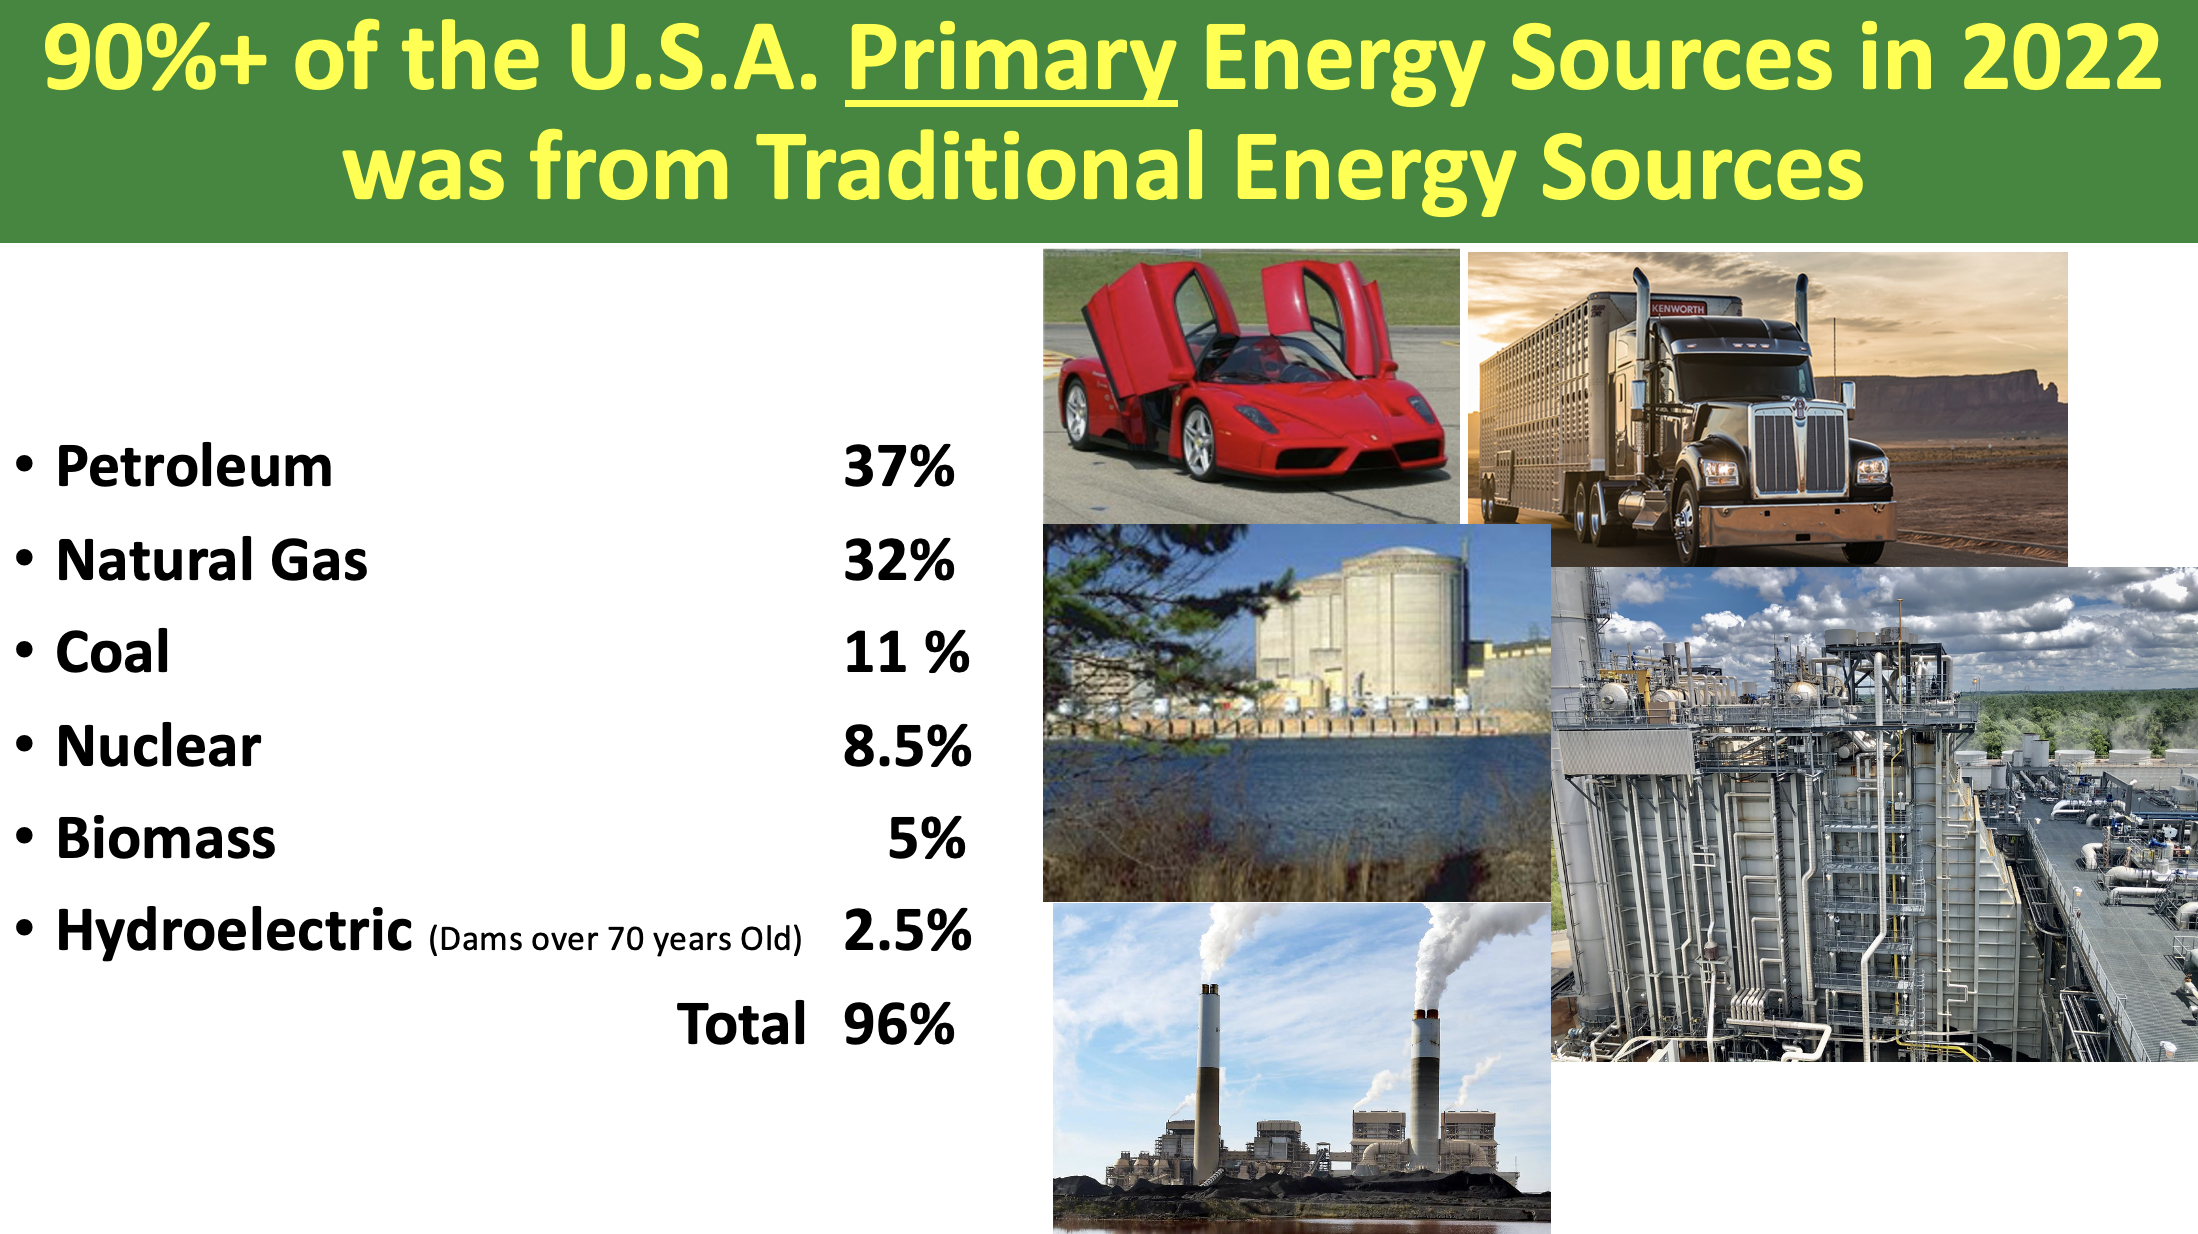


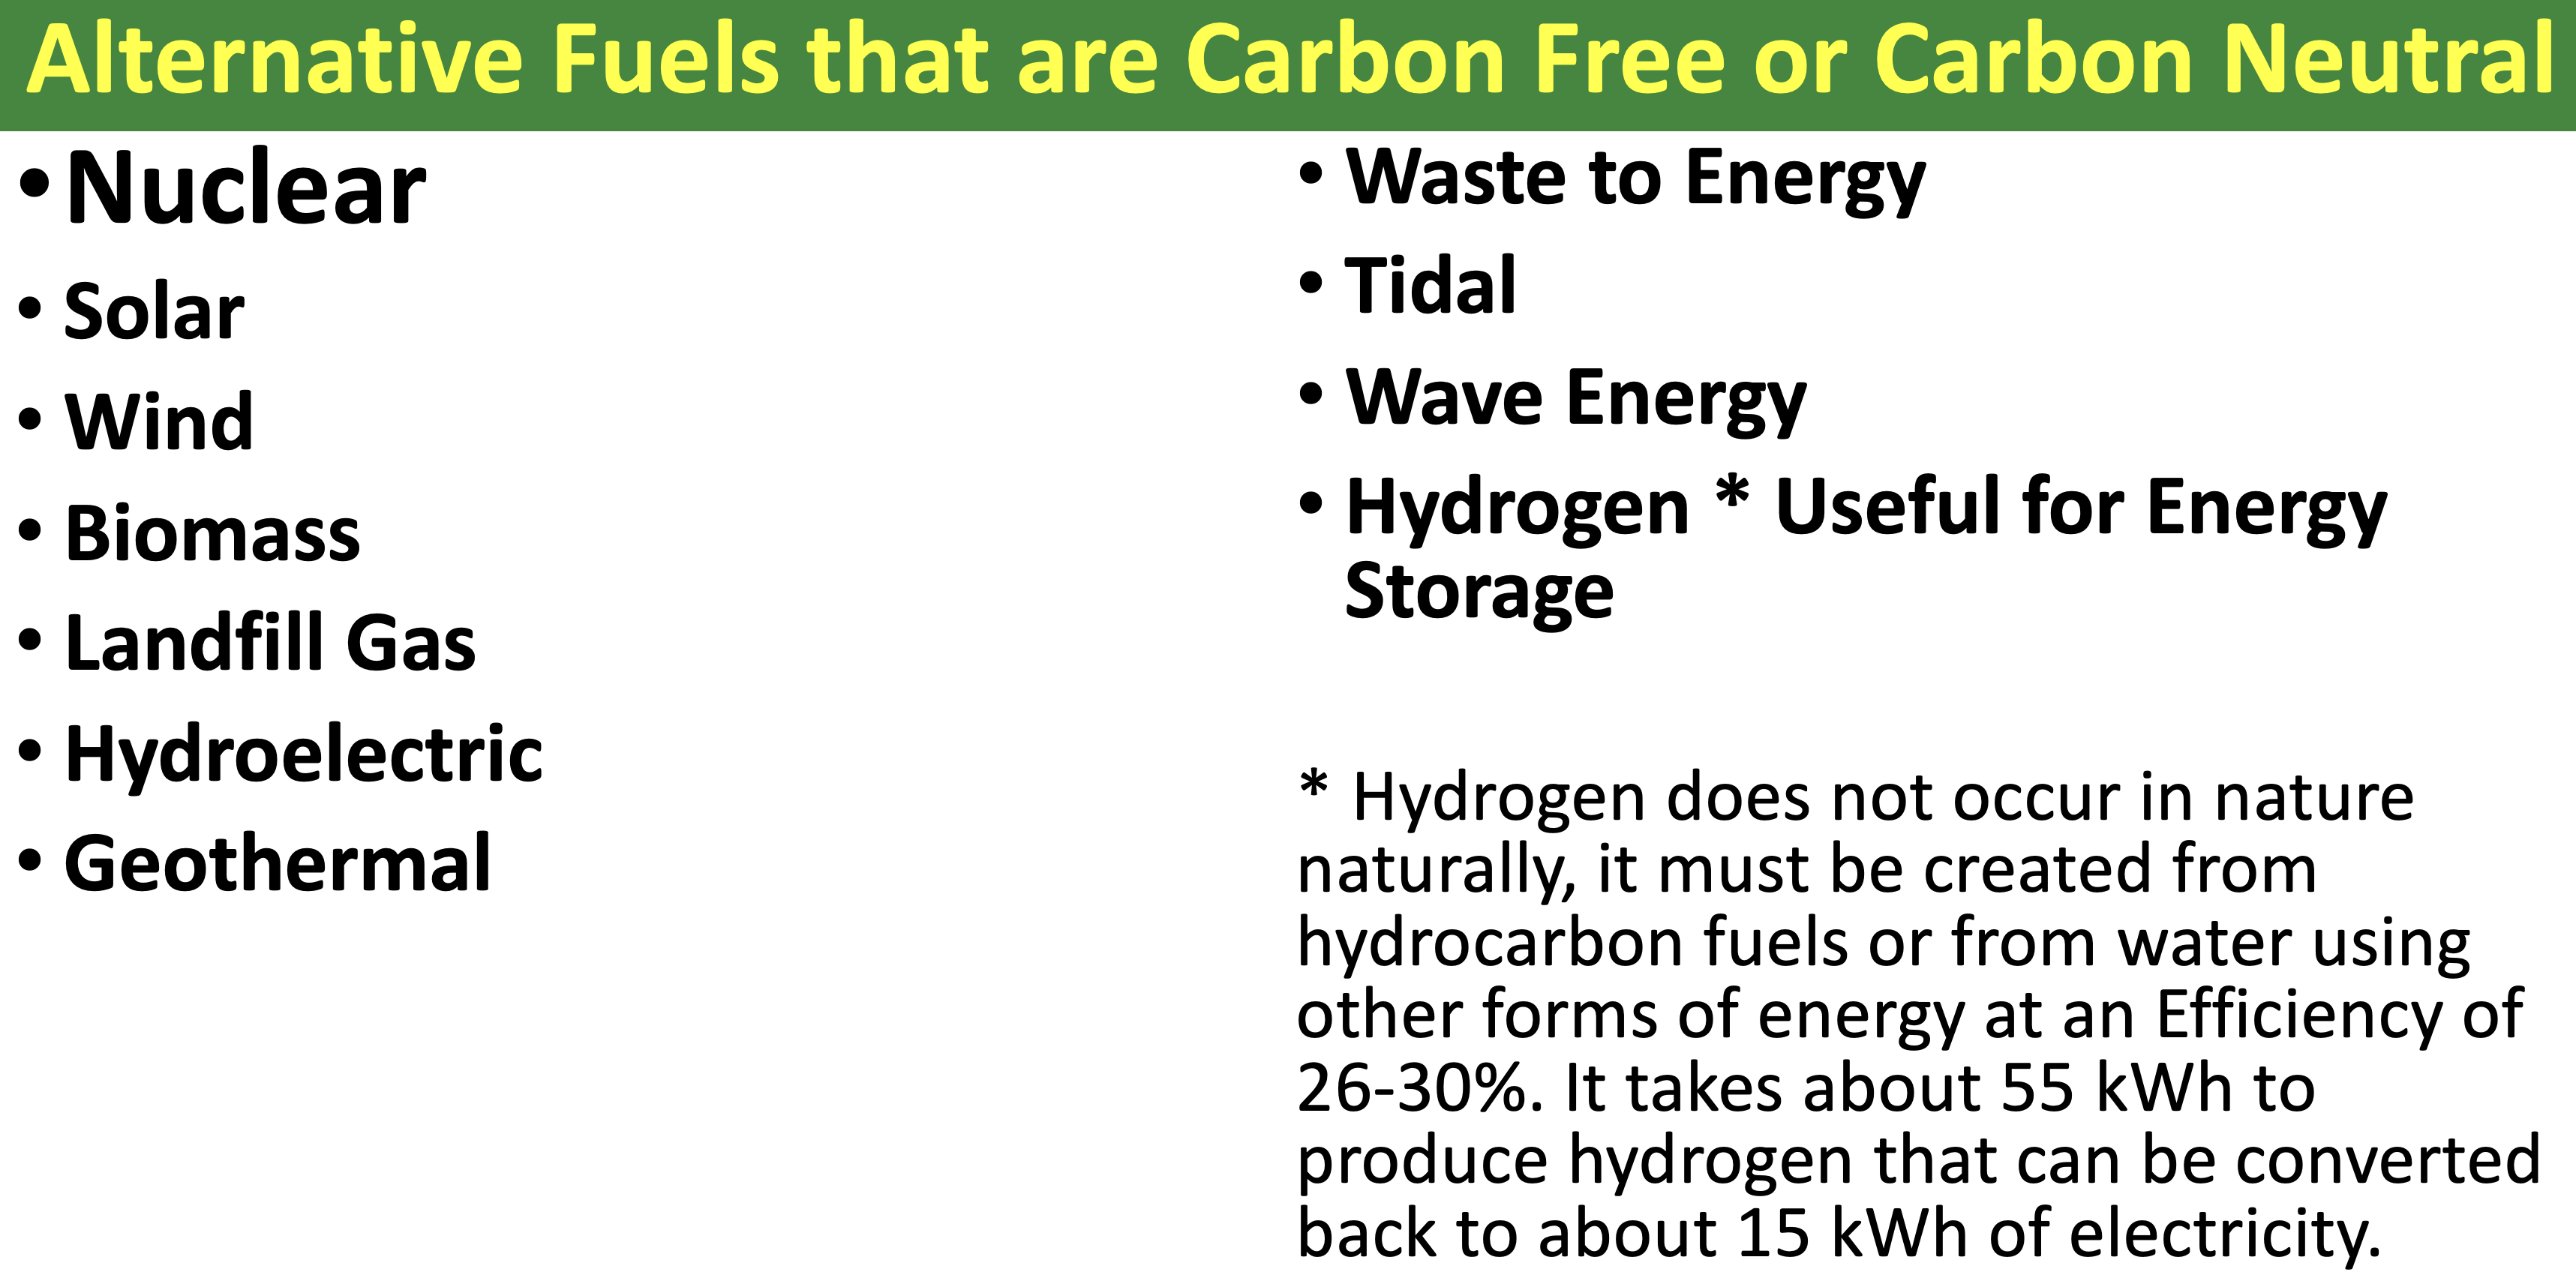


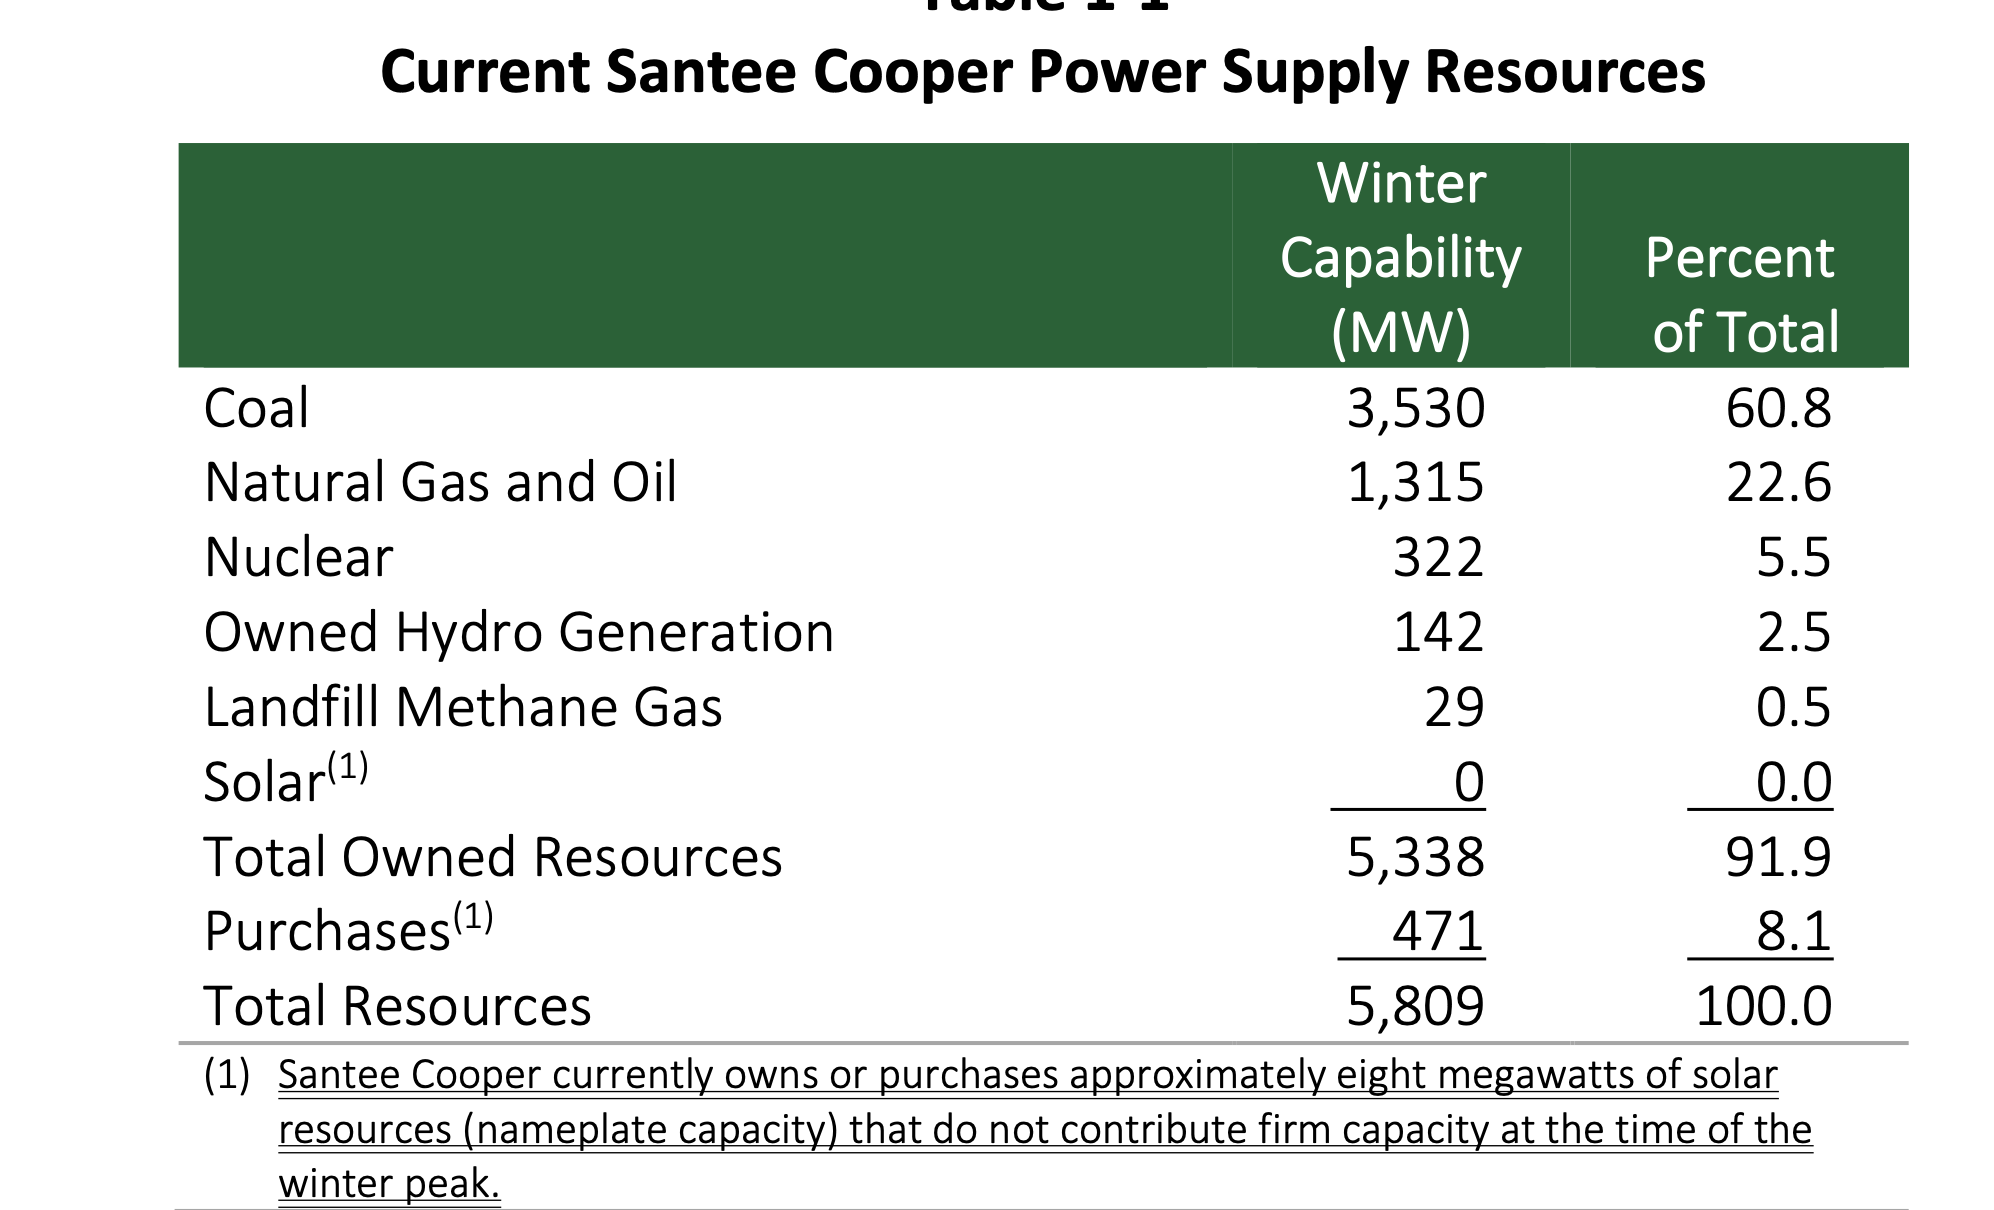
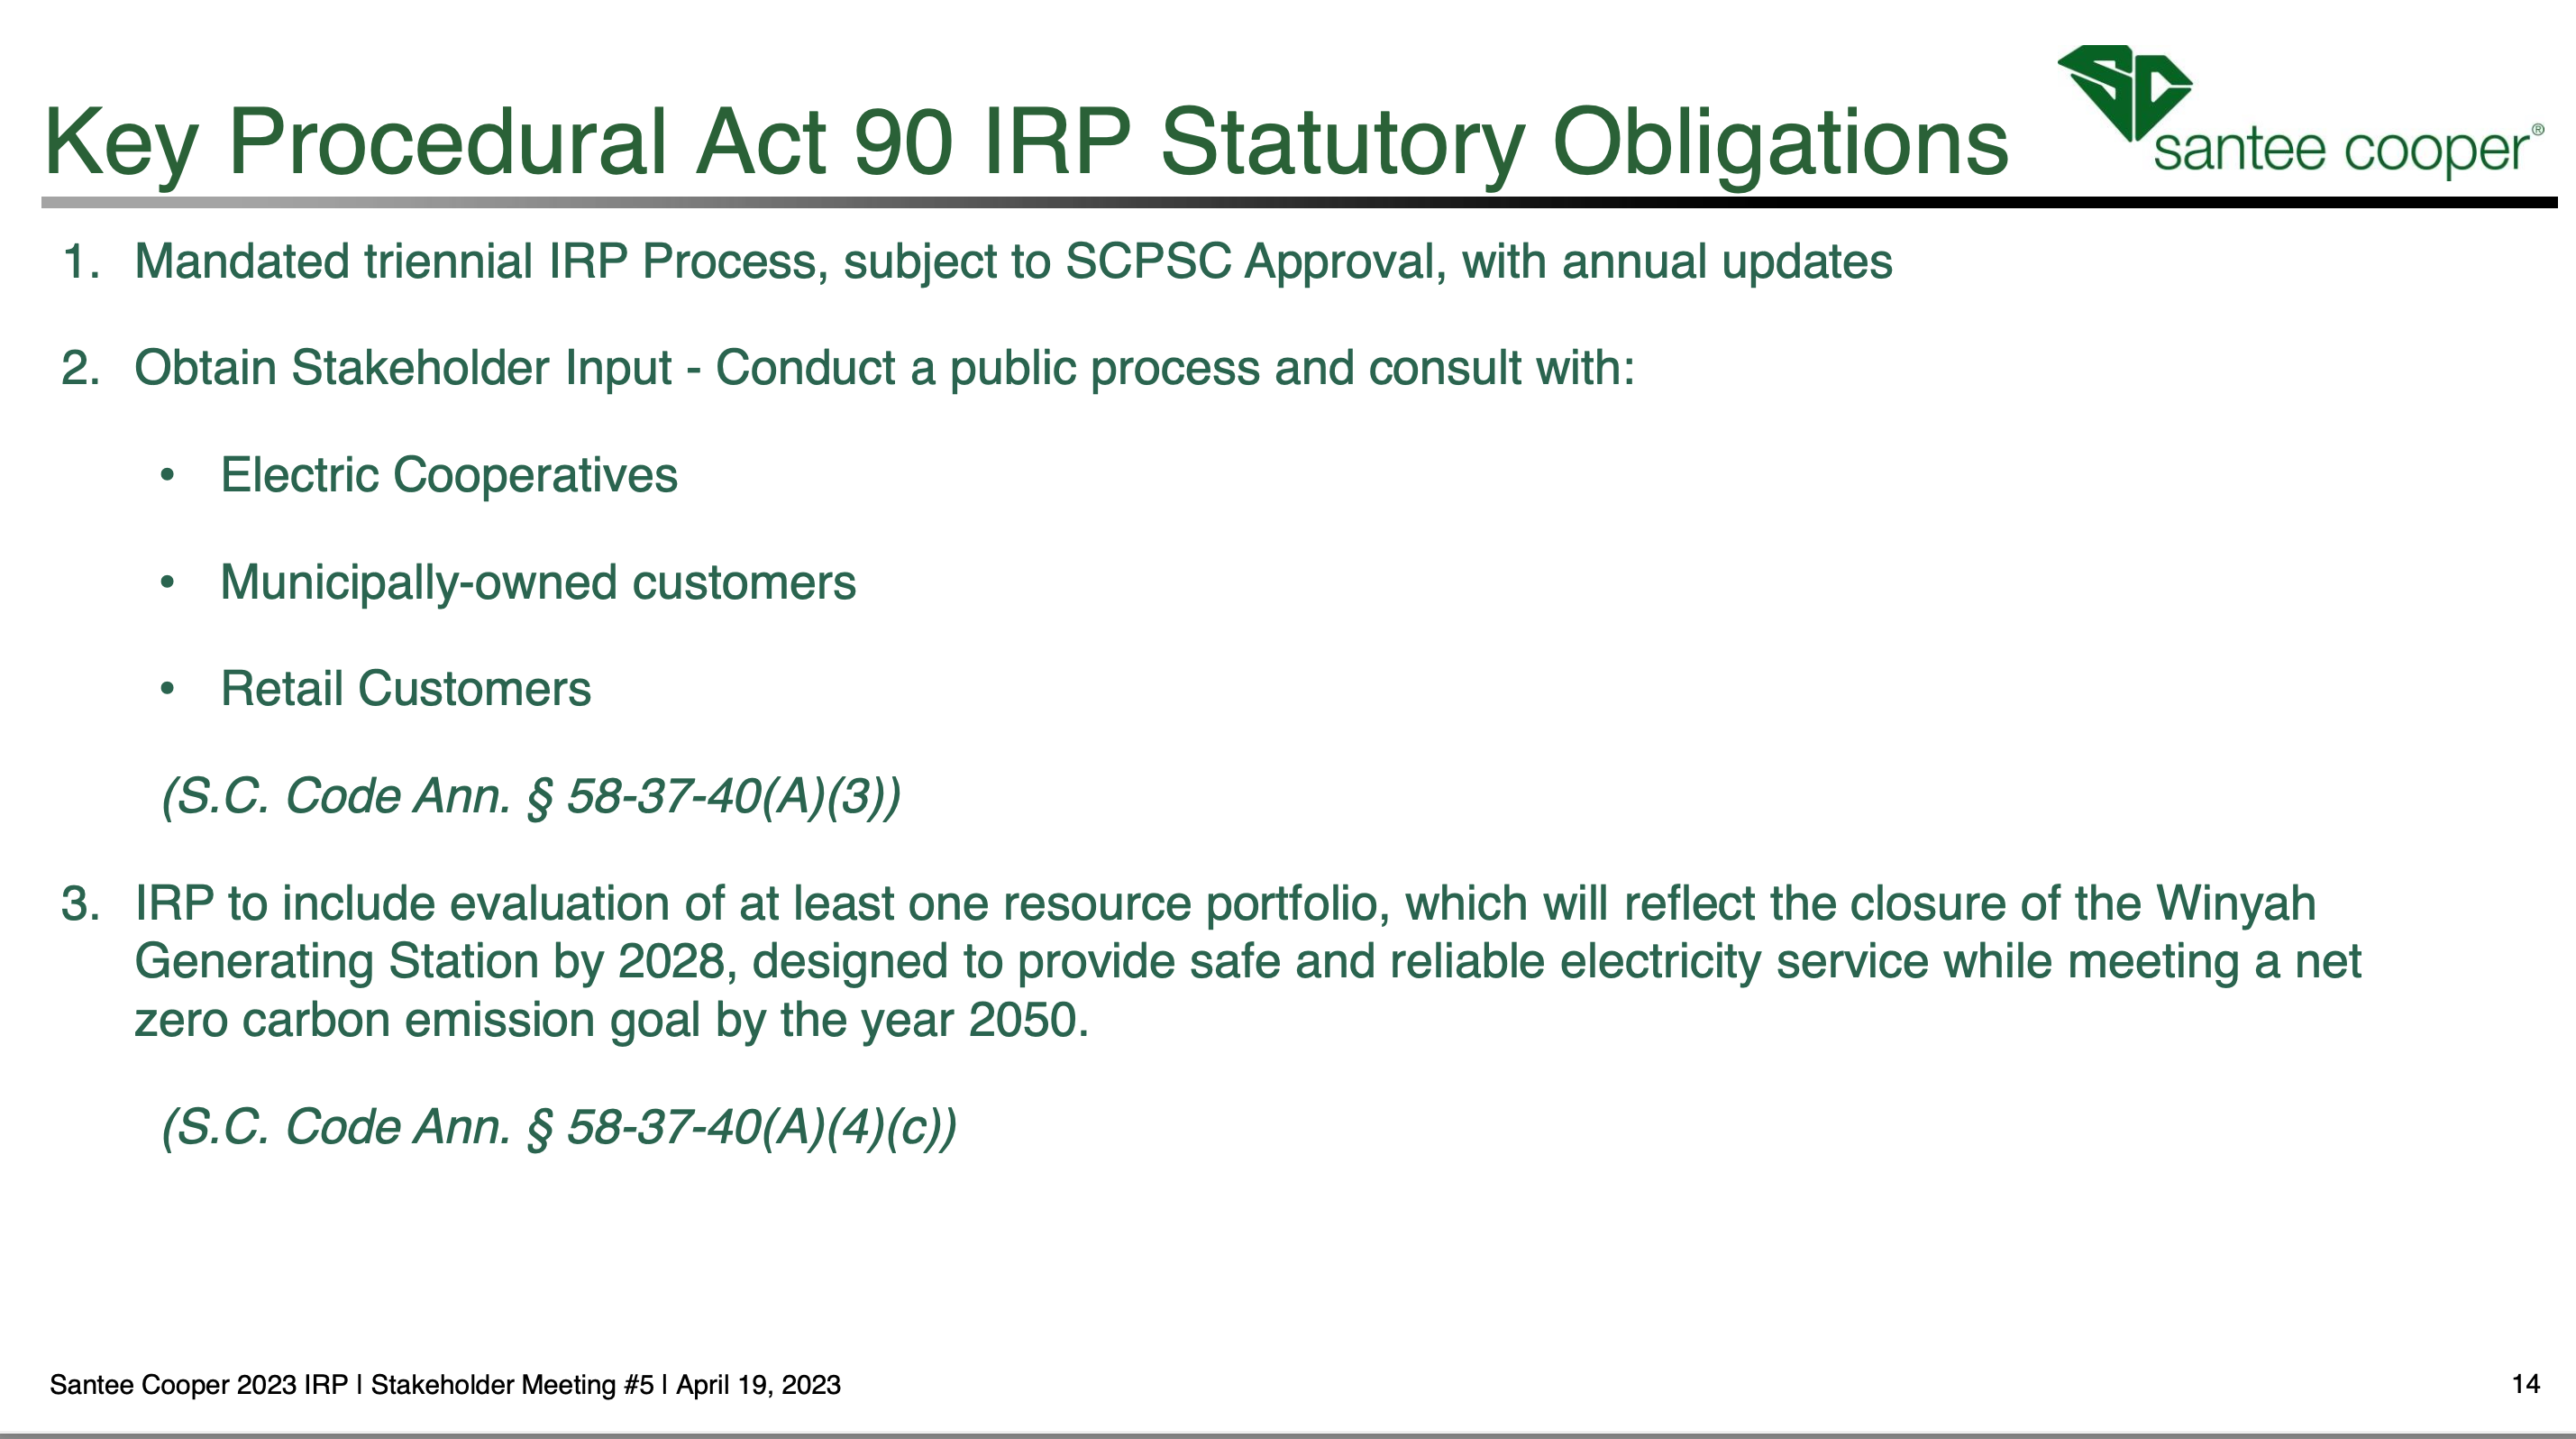


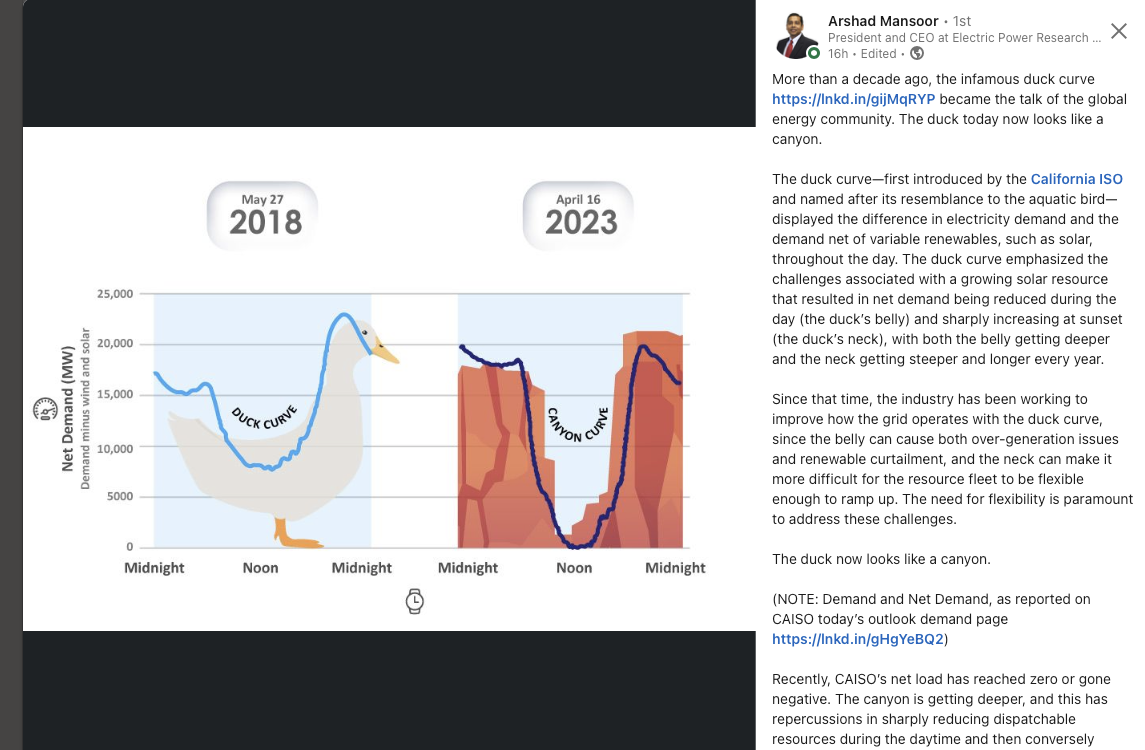


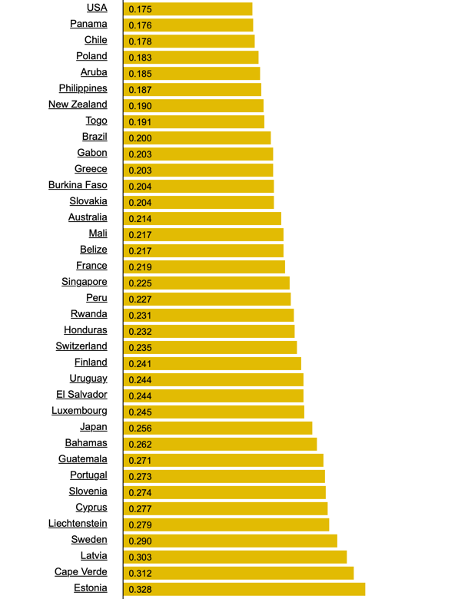


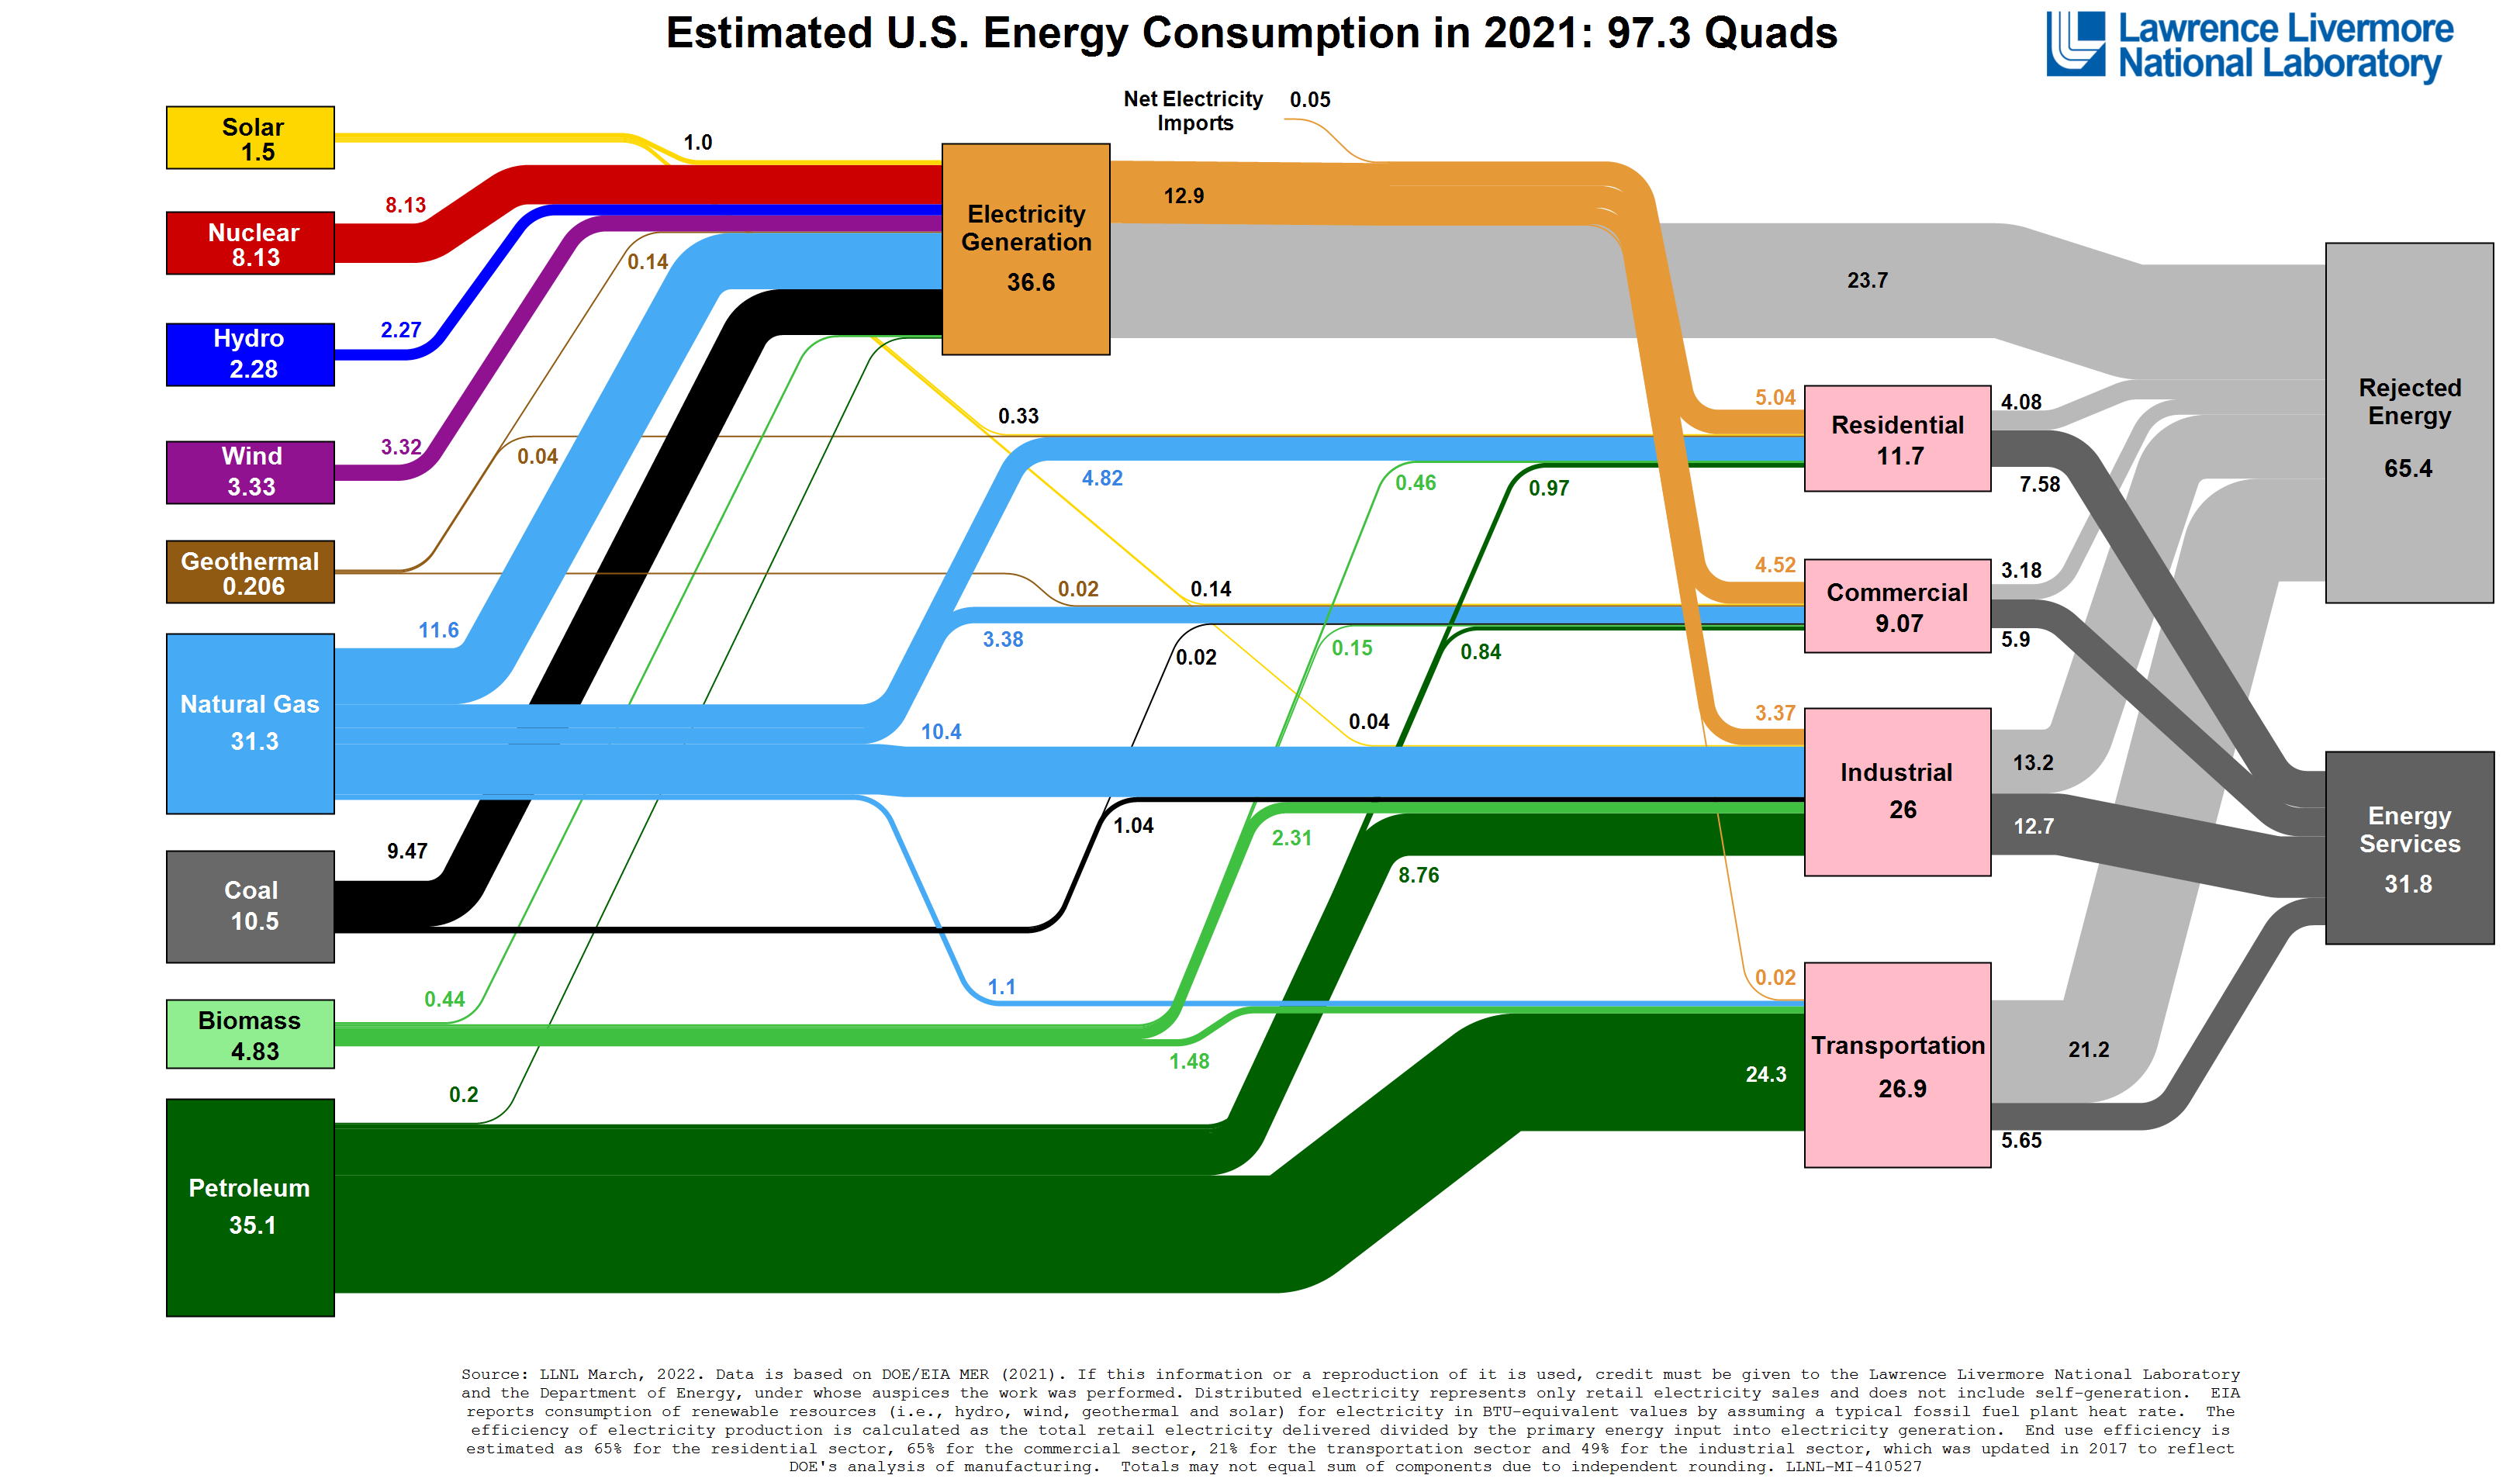