Tag Archives: #EnergyEconomicProsperity

The Importance of Fuel Diversity to Power Our Economy and Our Lives, Part 1

Much has been written on the importance of energy to power a nation’s economy and to continue to provide a high quality Human Development Index. The purpose of this post is to focus on the importance of Fuel Diversity for electricity generation. There is a proven concept for energy storage for electricity generation. It is coal fueled power plants with a 30-60 day supply of coal in a pile, on site. This is proven to be reliable, low cost and safe.

Energy powers everything we do!

Think about this. You are probably reading this on a computer screen. Have a warm cup of coffee nearby and are sitting in an air conditioned office or home. Your car is sitting outside and at your urging is ready to provide transportation. You get the point. Remember the last hurricane or severe winter storm that killed power for a day or so? Loss of energy sources or electricity is debilitating. Think about the 1970’s Oil Embargoes. If you are too young to remember 1973-1979 check these references, here and here.

Primary Energy Sources-Back to Basics

Lets discuss energy and electricity and the sources and quantity of everyday energy that we depend on.

America has used right at 100 Quadrillion Btus of PRIMARY energy per annum since about the year 2000.

The energy we use is compiled by various government agencies in BTUs equivalent (British Thermal Units). A BTU is enough heat to raise one pound of water one degree Fahrenheit, just as a reminder of High School Physics. Each BTU converted to work is equivalent (at 100% efficiency) to 778 Foot Pounds. Therefore, the energy production and consumption is converted to BTUs so that all forms of energy can be reported on a like basis. I wrote an article on the basics of energy for Middle School students here if you are interested, also on “Demystifying Energy and Electricity” here.

This article is about fuel diversity. Just as I explained above regarding the reporting of energy in BTUs to have a common measurement of energy quantities, in some cases one fuel can be substituted for another, especially in electric power generation. Thermal Power Generation Plants that generate Bulk Power can be provided with natural gas, coal, oil, Biomass or nuclear energy to produce steam to drive a steam turbine generator. The fuel selected is done for reasons of economic or fuel availability. Hawaii is truly an Energy Island and thus cannot interconnect with the lower 48 states. Fuels for Thermal Power Generation needs to be imported. In fact, I wrote on Hawaii’s electricity generation in 2020, here.

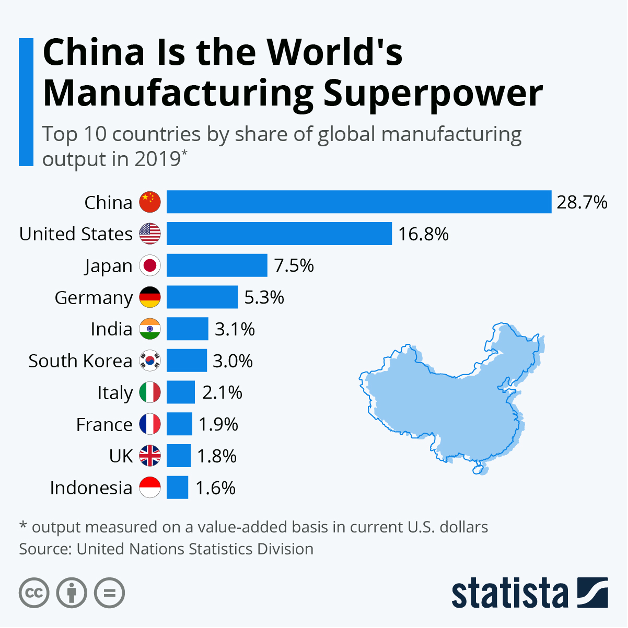
The proportions of each form of energy used and depended on to power our lives has changed as technologies for extraction and production have improved. For example for electric power generation coal fuel was consumed for about 50% of power generation in year 2000. Then due to the Shale Revolution of Hydraulic Fracturing and Directional Drilling, natural gas became less expensive than coal on a $/million BTU basis. See my review of Harold Hamm’s book, Game Changer which covers the Shale Gas Revolution, here. Thus, gas was substituted for coal generation by many utilities that could get it. Alaska and Hawaii of course do not have pipelines to connect, but of many utilities in the lower 48 states, gas was an economical and clean fuel of choice.

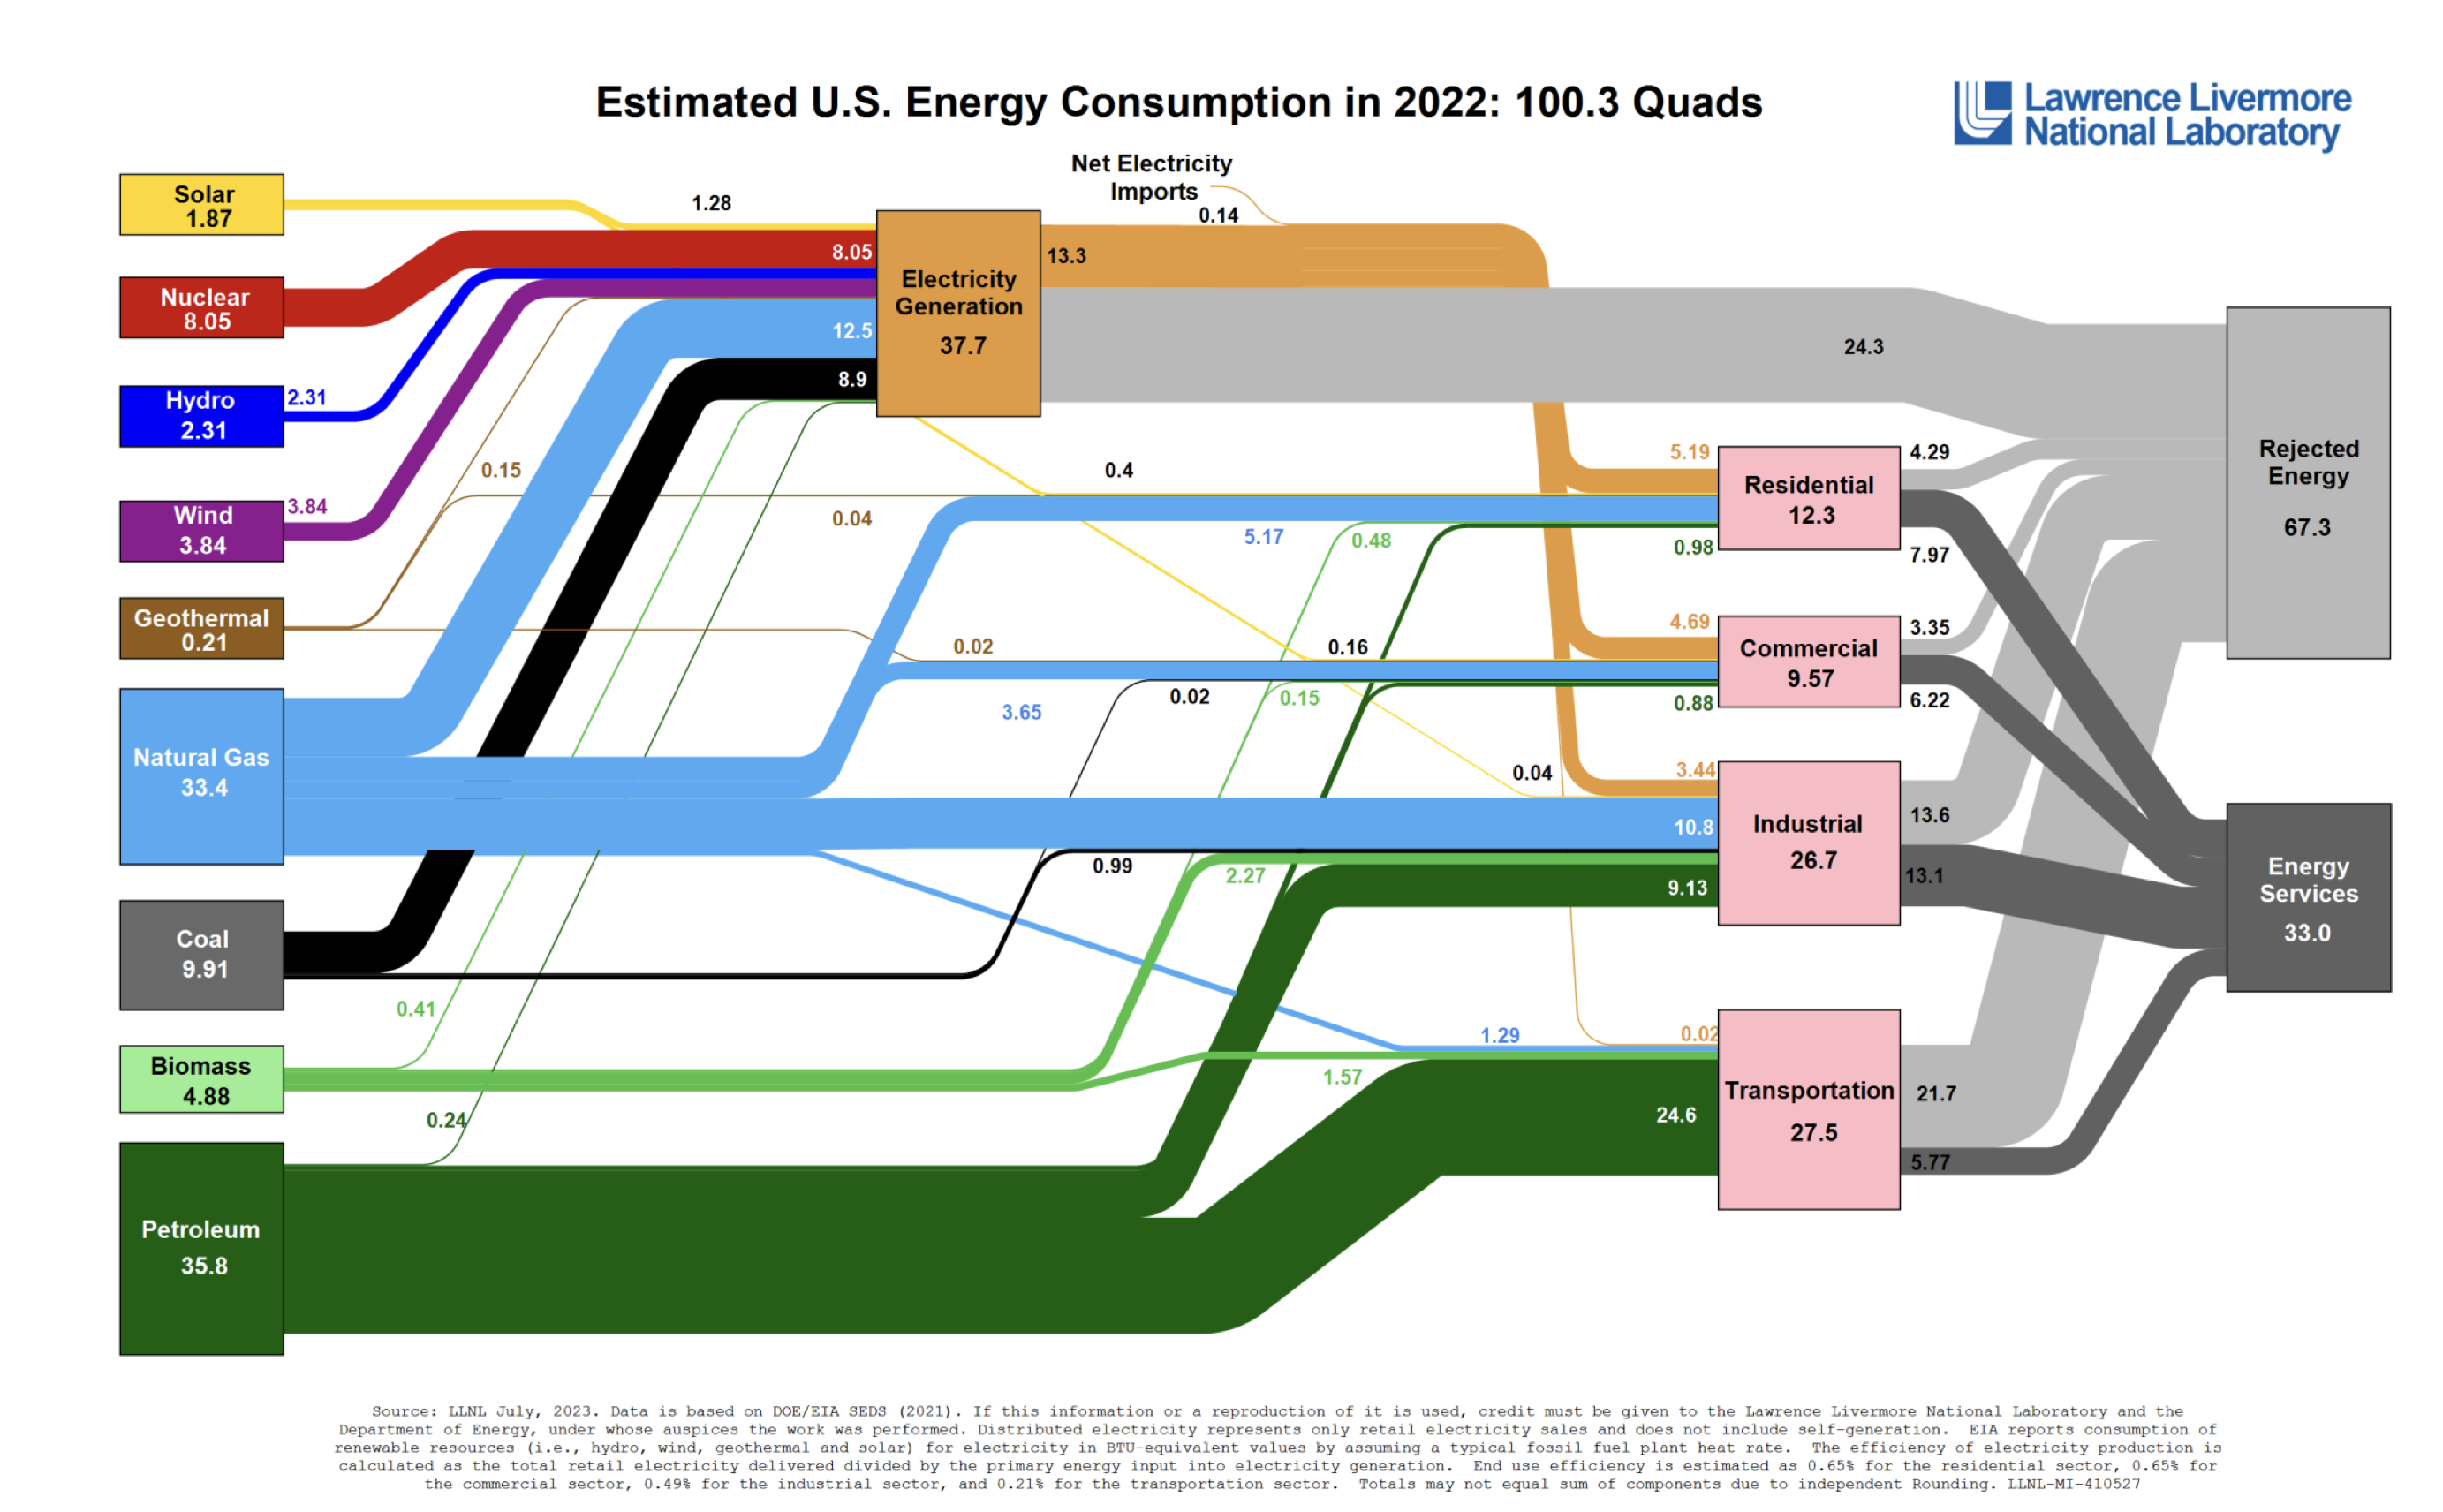
Coal fuel in the U.S. today provides about 23 % of the primary energy to produce Bulk Electric Power over the year. The substitution of coal fuel as primary energy is natural gas which has become more economical as a result of the Shale gas revolution which took off about 2012. Electricity is SECONDARY Energy and must be produced from Primary energy. Electricity is important and in 2022 electricity consumed about a third (37.7% to be exact) of the total PRIMARY energy used in the U.S. The best factual illustration that I am aware, of the sources and consumption of primary energy is the LLNL Energy Flow Diagram, shown below. This is one of my favorite graphics and it is prepared each year by the Department of Energy. The chart above shows the total primary energy used since 1950 and thus supports my conclusion that America needs right at 100 Quads per year to sustain our quality of life, economy and industrial production.

Lawrence Livermore Laboratory Sankey Diagram of U.S. Energy Flows, 2022

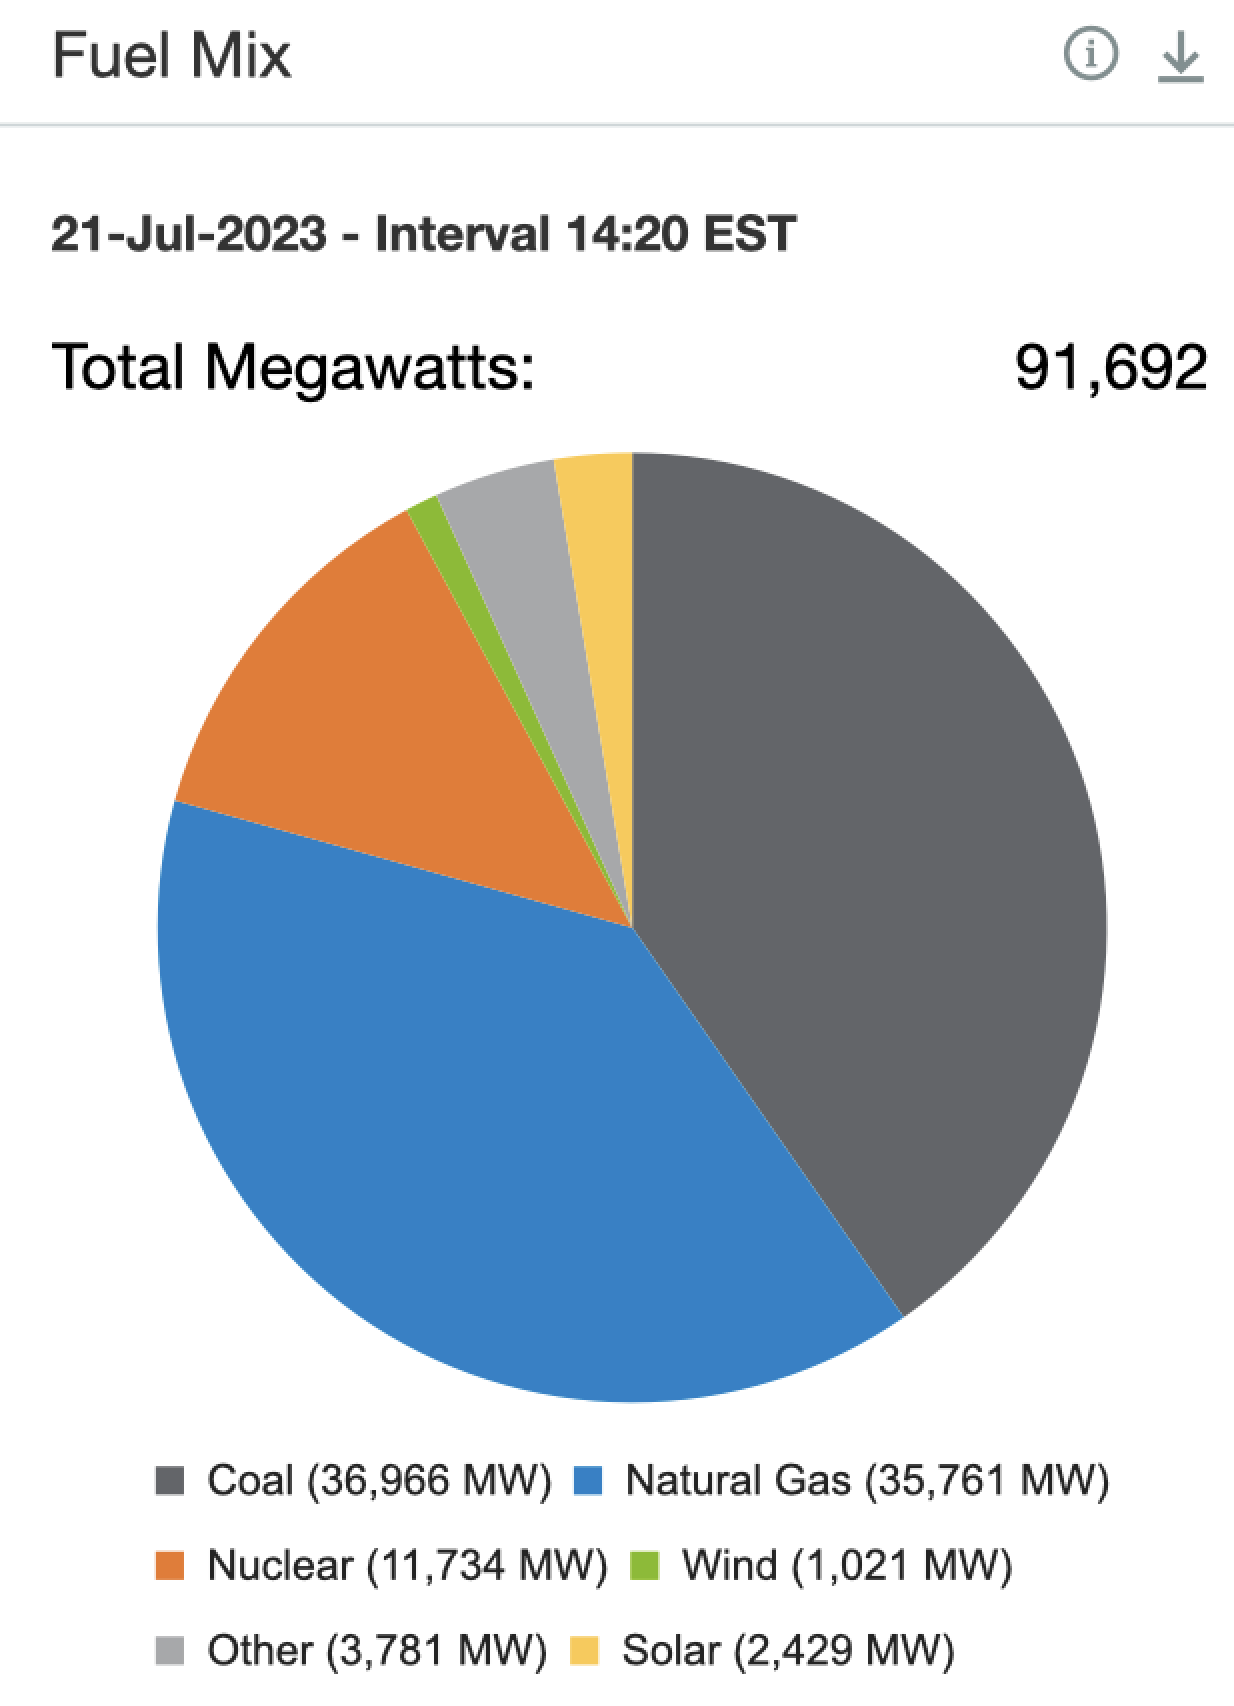
The total Primary Energy used by the U.S. from coal fuel in 2022 was about 10% of the total. (9.91% from data above). That doesn’t seem like much does it? Remember, this is primary energy I am talking about. So, although coal only provided about 10% of our total primary energy it was in fact, Dispatchable, affordable and it provided electricity generation when solar and wind were not available. The chart below is of MISO generation by fuel this past summer. This example shows 40% of total power generation in MISO from coal at this moment in time.

The topic of this article is “The Importance of Fuel Diversity”. The example above of summer Bulk Power Generation depending on coal fueled power generation units is just one of many reasons America should keep our Fuel Diversity. Another example of the importance of coal plants and the consequences of shutting them down is discussed in my blog post discussing the February 2021 Texas Blackout that killed over 200 people. Here.

My previous post on De-Mystifying Energy attempted to explain this, here. The difference between Primary and Secondary Energy is important. If everything is Electrified as many suggest we should do, has anyone really thought through where the primary energy to do so is to be sourced? In my opinion, it has not. Wind and solar cannot replace the primary energy currently required. The four charts shown up to here should make that clear.

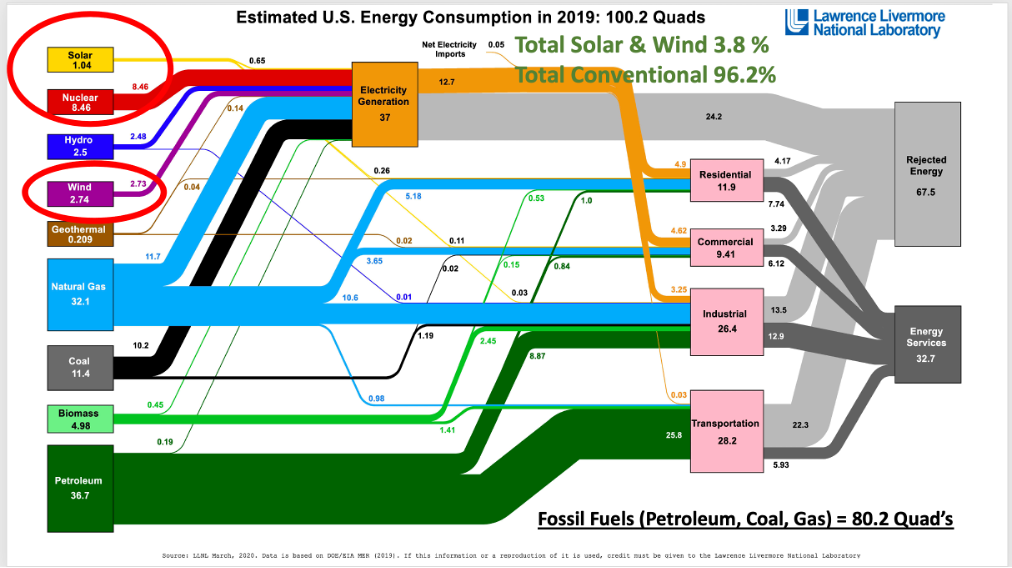
Government policy and many people in the general public believe that renewables can replace fossil fuels and nuclear. The harsh reality is that after decades of government subsidies & tax credits wind and solar provide less than 6% of our total PRIMARY energy. Here below is the LLNL Energy Flow Diagram from 2021 with the 4.96% wind and solar contribution circled.

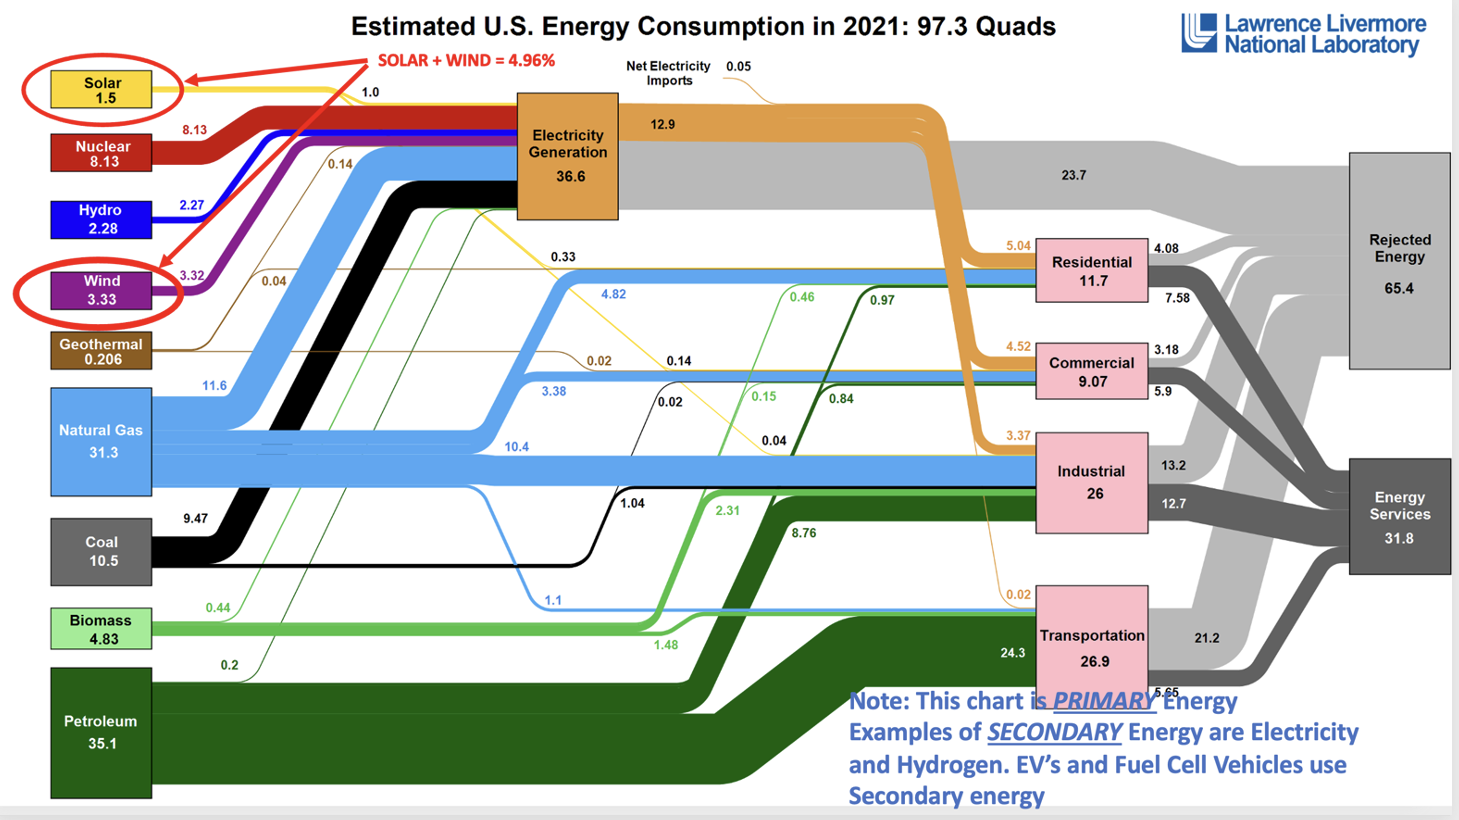
Public demonization of all conventional fuels including nuclear, coal, gas, gasoline, Diesel are unAmerican and foolish. Wind and solar only provide single digits of the total Primary energy needed to power our lives and it will be impossible to ramp wind & solar renewables up to 100% of our energy needs. The charts above are from the government statistics as published on the Lawrence Livermore National Laboratory Sankey Diagram website, an excellent resource.

Back to Fuel Diversity

Each American citizen, on average is accustomed to using about 315 million Btus of energy per year. I have written separate articles on American energy use here and here. My first point is that we all need on average of about 863,000 to 1 million Btus each day in Total Primary Energy. This number is provided by dividing 330 million citizens into 100 Quadrillion Btus and then dividing that by 365 days/year = 863,000 BTUs per day/citizen of PRIMARY Energy. This is for all uses which (see LLNL chart above) including: Electricity generation, Transportation, Industrial Production, Commercial and Residential uses. The second important point is that providing this energy each day may be from various forms of energy. Depending on which is more efficient or more economical. Let’s take an example of electric generation on July 21, 2023 in the Midwest at about 2:00 PM in the afternoon (example above). It was more economical to use coal fuel for 40% of the electricity generation at that hour. It may have been, I do not know for sure, that only coal generation could deliver the electricity Demand at that moment. The fact is, coal delivered 40% of the electricity at that moment.

Let’s take another example from last winter. This example below is from Christmas week, 2022.

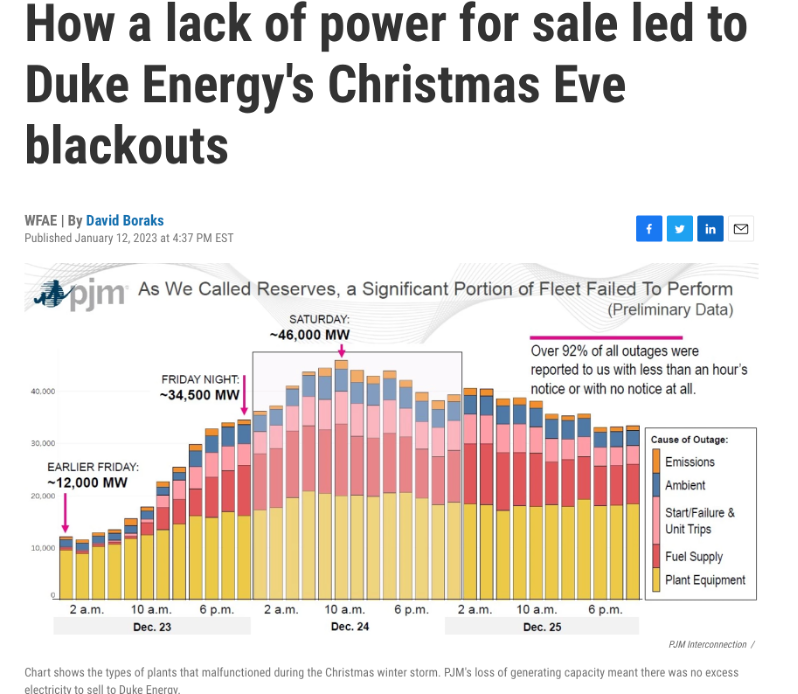
Fuel Diversity with more coal plants ready to operate and properly maintained could have avoided the Blackouts of Christmas week, 2022. Duke Energy has shut down many coal plants as part of their Net-Zero Carbon plan. So have many other Utilities, both Public and Investor Owned. I presented my views on this at the ENERUM (Columbus Ohio Energy Forum) in August 2022. My presentation is Here. Also, my recent article on the self sabotaging of our energy and electricity generation Grid is here.

Even well respected utilities that were once known for their outstanding leadership and engineering excellence are planning to shut more of their coal plants down in the near future. This works against Fuel Diversity! Here below is a screen print excerpt of the Duke Energy IRP for 2023:

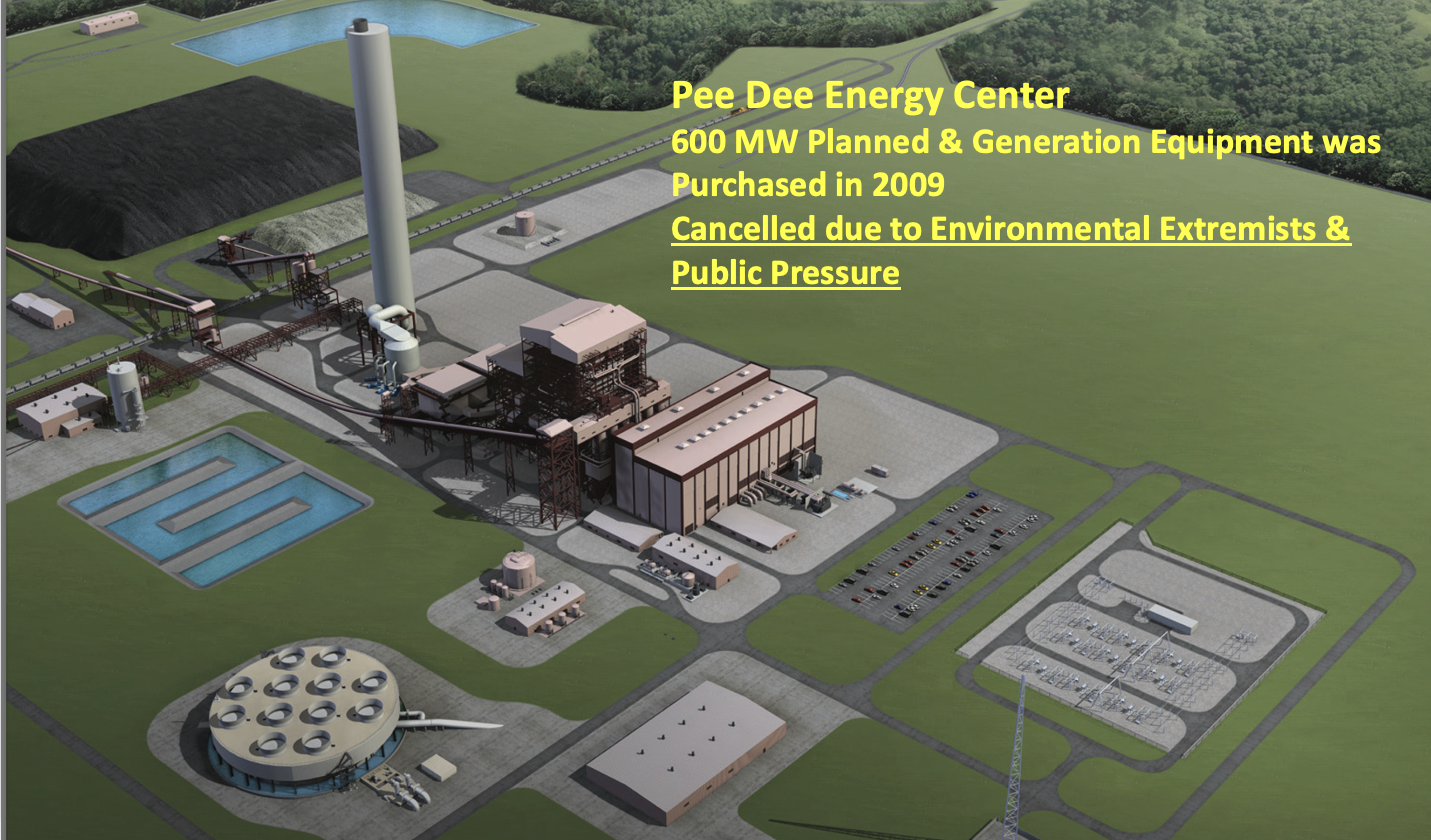
These planned shut downs are in spite of the winter 2022 rolling Blackouts described above. Why? Because the N.C. politicians and top Duke management have agreed to follow a disastrous Net-Zero Carbon path. So has the S.C. Legislature and Santee-Cooper. I wrote about Santee-Cooper in an earlier article, here.

Energy Storage

My first instructor on electricity generation was in class in 1959. The instructor, Harry Park stated, “Electricity needs to be generated the instant that it is needed”. That stuck with me my entire career. Today intermittent renewables are the rage and of course, as Mr. Park stated in 1959, electricity needs to be generated or provided from storage the instant it is needed. That is what built America’s Grid and America’s strong economy. Reliable, affordable electricity available the instant it is needed or in today’s word, Demanded. The published articles I see regarding the justification of higher and higher percentages of wind and solar generation are dependent on electricity storage. The best and largest Bulk Power Storage systems today are “Pumped Storage Hydro”. Such as Duke Energy’s Bad Creek or TVA’s Raccoon Mountain. These work well where the local topography allows it. Bad Creek has about 1,200 ft of elevation change between the upper and lower reservoirs(21). Bad Creek is currently, according to N.C. Business Journal, being uprated to about 2,800 MW. TVA’s Raccoon Mountain provides 1,650 MW of storage. Two other alternatives for storage are batteries and hydrogen. The largest battery electric storage system (BESS) that I am aware is in California. This is at Moss Landing Plant in California. It is being uprated to 3,000 MWH. The “H” after MW means Hour. That means the electricity stored is good at the rated capacity for one hour. Enough time to start gas turbines or buy power from a neighboring utility on the grid. Hydrogen can be a source of storage too. However, it must be remembered that it takes about four times the input of electricity to produce one unit of Bulk Power from hydrogen. An excellent reference on this was published in Gas Turbine World Magazine in August 2022, Here. (22)

The most reliable, proven, safe and affordable form of Energy Storage: A large pile of coal onsite at a clean, efficient coal power plant. When I started in the power generation business in the 1960’s one of my experiences was in conducting a boiler efficiency test at a large power plant in Illinois. As I recall the explanation for the huge coal pile was, “Because of the possibility of Union walkouts at either the coal mines or the railroad, a 90 day supply of coal was required to be stored on site”. Proven, safe and affordable. The photo below is real long term energy storage. A coal pile can store enough energy for a 2,000 MW power plant to run full power for months, not hours as is currently planned for batteries.

Electricity, Transportation, Industrial Production, Commercial, Residential

These five categories of energy use are shown on the LLNL charts above. Americans with our current population of about 330 million, will need at least 100 Quads per year for the foreseeable future. If we are to sustain our quality of life and freedom to travel, we will continue to need about 100 Quads per year. This article is focussed on electricity generation and the 37% of America’s PRIMARY Energy used to generate Bulk Power. The second part of this article will cover the other 63% of our PRIMARY ENERGY.

Conclusion

It will be impossible to replace fossil fuels with wind and solar any time soon. Attempting to do so will create hardships, economic decline and a general weakness of our country including weakness of our National Security.

The best and most proven energy storage system that I have known through my entire career in power generation is a large coal pile. It was common for coal power plants to have 30 or 60 day supplies of coal storage on the plant site.

On a positive note, I wrote about the preceding 80 years the “Era of Affordable, Reliable Energy and Electricity Generation, Part 1” Here. America really did great things in making energy and electricity reliable and affordable for over 80 years. Coal plants became more efficient and clean, nuclear power came of age and America became energy independent and the largest producer of natural gas in the world. I chose 80 years because that covers my lifetime and I know the history of accomplishments during these times, because I worked in the power generation business for over 50 of those years. Experiences in design, maintenance, operations, tuning, upgrading, capacity improvements, Betterments, Heat-Rate Improvements, fuel flexibility, fouling and slagging reductions and emissions reductions of fossil power systems. I admit, I am not a policy wonk, I am a nuts and bolts power engineer. But, I have been gifted with many years of experiences and have traveled much of the world to witness the relationship of energy and economic prosperity.

The loss of legacy coal plants is threatening Bulk Power Supply Reliability by the loss of over 100,000 MW’s of reliable coal power generation capacity without replacing it in kind is wrong. I wrote on the “End of the Era of Reliable, Affordable Energy and Electricity” a couple weeks ago. It is here. The references included are from NERC, FERC and other reliable people and sources of information. I encourage the reader to check these references to decide for yourself.

Nuclear power generation is the only known technology to produce carbon dioxide free electric power. However, building a new nuclear power generation supply chain will take decades. David Archibald wrote an excellent article on “The Energy Future We Need to Have a Future Worth Having”, here. I also support nuclear for the long term, but the next 30 years are important to work through and hopefully, sustain our high quality of life until future technologies and the needed supply-chains are sufficiently developed for safe and reliable implementation. My previous blog post covered an overview of the needed new thinking (and policies) on nuclear power for carbon dioxide emissions reduction to succeed. here. (27)

Unless the current path to Net-Zero Carbon is stopped, America faces shortages of electricity, including rolling Blackouts during extreme weather. Such as the coming winter in December 2023 and January 2024. Please Wake up Americans, Your Energy and Electricity Supply is Being Self Sabotaged from Within!

Yours truly,

Dick Storm, October 25, 2023

References for further reading:

  1. Dick Storm Blog, Back to Basics, America Needs About 100 Quadrillion Btus each year: https://dickstormprobizblog.org/2023/05/16/back-to-basics-the-u-s-needs-100-quadrillion-btus-year-of-primary-energy/
  2. Lawrence Livermore National Laboratory Energy Flow Diagram for year 2022: https://flowcharts.llnl.gov
  3. Dick Storm Blog, “The American Dream=100 Quadrillion Btus of Energy: https://dickstormprobizblog.org/2022/07/04/american-dream-100-quadrillion-btus/
  4. WFAE News Article on, “How Duke’s Power Failures Came to Be From Lack of Reserves over Christmas Eve, 2022: https://www.wfae.org/energy-environment/2023-01-12/how-a-lack-of-power-for-sale-led-to-duke-energys-christmas-eve-blackouts
  5. Dick Storm ENERUM, August 2022 presentation: https://www.linkedin.com/posts/richard-storm-00557810_presentation-and-speakers-notes-from-august-activity-7068650158862827520-B-_W?utm_source=share&utm_medium=member_desktophttps://www.linkedin.com/feed/update/urn:li:activity:7056884647858765824?updateEntityUrn=urn%3Ali%3Afs_feedUpdate%3A%28V2%2Curn%3Ali%3Aactivity%3A7056884647858765824%29
  6. Dick Storm Blog post, “Mentoring of Middle School Students on the basics of energy and electricity”: https://dickstormprobizblog.org/2022/03/09/mentoring-the-middle-school-students/
  7. Dick Storm Blog post on Rotary presentation, “Demystifying Energy and Electric Power Generation”: https://dickstormprobizblog.org/2022/11/17/demystifying-the-importance-of-energy-and-electric-power/
  8. Dick Storm Blog, “Hawaii-A Glimpse Into the Future of the Green New Deal” : https://dickstormprobizblog.org/2020/06/03/hawaii-a-gimpse-into-the-future-of-the-green-new-deal/
  9. Harold Hamm’s book, “Game Changer” which chronicles the history of Hydraulic Fracturing, Directional Drilling and the Shale Gas Revolution: Dick Storm review: https://dickstormprobizblog.org/2023/09/17/harold-hamms-book-game-changer-a-must-read-for-elected-officials-and-candidates-for-elective-office/
  10. Dick Storm Blog post, “The End of the Era of Abundant, Affordable Energy and Electricity” Thanks to misguided government Regulations: https://dickstormprobizblog.org/2023/10/12/the-end-of-the-era-of-reliable-abundant-and-affordable-energy-and-electricity-part-ii/
  11. Dick Storm Blog, “How Can a 6,000 MW Utility Which Likely will be a 9,000 MW Utility in 2050, Achieve Net-Zero Carbon?” ; https://dickstormprobizblog.org/2023/04/27/how-can-a-6000-mw-regional-utility-in-2030-which-likely-will-be-a-9000-mw-utility-in-2050-achieve-net-zero-carbon/
  12. The Green Transition is “Social Vandalism” WUWT, Oct. 3, 2023:  https://wattsupwiththat.com/2023/10/03/the-energy-transition-is-social-vandalism/
  13. America’s Power Coal Facts: https://americaspower.org/COAL-FACTS/
  14. NERC 200-2023 Winter Assessment: https://www.nerc.com/pa/RAPA/ra/Reliability%20Assessments%20DL/NERC_WRA_2022.pdf  
  15. CO2 Coalition, “Fear the Cold”, Cold is Bad for Humanity, October 24, 2023: https://myemail.constantcontact.com/Fear-the-Cold.html?soid=1101509381788&aid=TJ7nY5OPc1A
  16. Dick Storm Blog, “Green Energy Crisis, Part3”: https://dickstormprobizblog.org/2023/06/26/green-energy-crisis-part-3-public-energy-education-is-needed-each-person-in-the-u-s-uses-about-315-million-btus-of-primary-energy-year-this-is-not-practical-or-even-possible-to-replace-with-win/
  17. 1973 Oil Embargo, History by the Boston Federal Reserve: https://www.federalreservehistory.org/essays/oil-shock-of-1973-74
  18. The Arab Oil Embargo, 40 Years Later, by Center for Strategic International Studies, 2013: https://www.csis.org/analysis/arab-oil-embargo-40-years-later
  19. WUWT, David Archibald, “The Energy We Need For A Future Worth Having” , Oct. 25, 2023: https://wattsupwiththat.com/2023/10/25/the-energy-future-we-need-to-have-a-future-worth-having/
  20. NC Business Journal article on Duke’s Bad Creek Power Plant Size Doubling to 2,800 MW: https://www.bizjournals.com/charlotte/news/2022/03/01/duke-energy-eyes-doubling-pumped-hydro-project.html
  21. Duke Energy Illumination article on Bad Creek Hydro Plant: https://illumination.duke-energy.com/articles/the-marvel-inside-the-mountain-4608936#:~:text=Because%20about%201%2C200%20feet%20separate,gravity%20to%20produce%20more%20electricity.
  22. Gas Turbine World Magazine, “The Green Hydrogen Numbers Just Do Not Add Up”, August 2022: https://gasturbineworld.com/gas-turbines-burning-green-hydrogen/
  23. Dick Storm Blog, “The End of Reliable, Affordable Energy and Electricity” Oct. 12, 2023: https://dickstormprobizblog.org/2023/10/12/the-end-of-the-era-of-reliable-abundant-and-affordable-energy-and-electricity-part-ii/
  24. Dick Storm Blog, “The Era of Reliable, Affordable Energy and Electricity Generation, Part 1” : https://dickstormprobizblog.org/2023/10/04/the-era-of-reliable-affordable-energy-and-electricity-generation-part-1/
  25. Dick Storm Blog on “Texas Missing 6,000 MW of Coal Generation during the February 2021 Blackout”: https://dickstormprobizblog.org/2021/02/19/texas-and-coal-power-6000-mws-of-coal-plant-capacity-is-missed/
  26. Dick Storm Blog, “Wake Up Americans, Your Energy and Electricity Supply is Being Self-Sabotaged”: https://dickstormprobizblog.org/2023/09/20/please-wake-up-america-your-energy-and-electricity-generation-reliability-are-at-risk/
  27. Dick Storm Blog, “Without New Thinking on Nuclear Power, Net-Zero Carbon Cannot Succeed”: https://dickstormprobizblog.org/2021/11/13/without-new-thinking-on-nuclear-power-anti-carbon-climate-policy-cant-succeed/
  28. FERC-NERC Report on Winter Reliability Lessons from winter storm Elliott: https://www.ferc.gov/news-events/news/ferc-nerc-release-final-report-lessons-winter-storm-elliott

The Era of Reliable, Affordable, Energy and Electricity Generation: Part 1

This is my Perspective of Proven, Reliable, Affordable & Abundant Energy & Electricity Generation during my lifetime. Here are some of the significant technical advances, changes, regulations, incidents, events and policies that have shaped energy and power generation over the last eight decades. Some personal experiences are interjected during this era just to show where I am coming from in my perspective. Part 2 will cover my thoughts on the impossible transition to renewables.

A Brief History of the Improved Quality of Life Since WWII

Dr. Euan Mearns wrote in WUWT this short summary of the history of energy and the “Energy Transition as Social Vandalism”(19). An excerpt from the concise and well written essay:

“The mid 19th century also saw the development of early internal combustion engines, although at that time there was insufficient fuel for a motor industry. The Spindletop gusher and subsequent discoveries changed all that. The world was now awash with oil without any real market. Then in 1908, Henry Ford rolled out his Model T to begin the age of the car and mass transit. The Wright brothers’ first powered flight in 1908 led quickly to commercial air travel and eventually to the jet age.

Unparalleled development came with the 20th century and the introduction of nuclear power plants whose uranium fuel contains more than 16,000 times the energy content of coal, oil and natural gas. At the same time, hydroelectric power rapidly expanded and natural gas (the most energy dense of the fossil fuels by mass) became more available for electricity generation and home heating and cooking.

The introduction of gas-fired central heating enhanced the well-being of populations. Whole homes would be heated by hot-water radiators, and no longer would families have to huddle round a dirty coal fire. By 2000, life expectancy in world population had risen to 66 years, 78 years in the now developed countries.”

Looking back, I am awed by the progress that was made for the Betterment of the quality of life for Humankind. I am proud of my small contributions along the way.

Some of the Significant Energy & Electricity Mileposts: 1940-2023

  • Pulverized coal firing for steam generation becomes the predominant method of power generation
  • Mechanical dust collectors are used for collection of particulates
  • 1941 B&W invents and develops Cyclone Burners to fire low fusion midwestern coal with more than 70% of the ash collected as a molten smelt
  • 1943 Combustion-Engineering invents and develops Tilting Tangential Firing
  • Electrostatic precipitators are applied to large coal plants
  • 1949 First G-E Gas Turbine for electric power generation in the U.S. installed at Oklahoma Gas & Electric Belle Isle Plant
  • 1951 U.S. Navy Admiral Rickover obtains funding from Congress to build the first nuclear powered submarine, Nautilus
  • 1953 President Eisenhower’s “Atoms for Peace” initiative
  • Supercritical pressure steam generators become common place
  • 1955 USS Nautilus puts to sea
  • 1955 First “Atoms for Peace Conference” in Geneva
  • Steam temperatures and power generation from Rankine cycle steam plant efficiency approaches 40% design efficiency
  • 1957 Shippingport Nuclear Steam System, the first U.S. Commercial Reactor is proven
  • 1957-59 Philo and Eddystone Ultrasupercritical Units are placed in service
  • 1970 – President Nixon signs law to form EPA
  • Coal pulverizer state of the art advances to single pulverizers with over 100,000 pounds per hour capacity
  • 1973 First Oil Embargo
  • 1977 U.S. Department of Energy is formed with the intention to lead America to energy independence
  • The Strategic Petroleum Reserve is begun
  • 1978 EPA Clean Air Act
  • 1978 President Jimmy Carter signs Energy Policy Act
  • 1979 Three Mile Island Incident
  • 1980 Energy Security Act
  • 1988 G-E Single Cycle Aeroderivative Gas Turbine achieves 41.9% efficiency
  • 1990 EPA-Clean Air Act Amendment
  • 1991-First Horizontal Drilling by Enid Company in OK
  • Low NOx Burners or other NOx reduction systems are installed on most coal plants across the U.S.
  • Flue gas desulfurization becomes standard for coal plants
  • Selective Catalytic Reactors are used to reduce NOx
  • 2010 Hydraulic Fracturing combined with Directional Drilling by Harold Hamm’s company greatly increases shale gas production in ND
  • 2012 The Shale Gas Revolution produces natural gas at lower cost/million Btu than coal
  • 2014 CCGT (Combined Cycle Gas Turbine) units achieve over 60% efficiency
  • 2018 G-E CCGT (Combined CycleGas Turbine) Reaches 64% Efficiency
  • 2020 Natural gas electricity generation provides over 38% of U.S. electricity production
  • 2022 U.S. Congress passes IRA Law and Biden signs, it codifies green energy

Reasonable Cost Energy & Electricity Improves Quality of Life

This is a personal story of electricity generation. Here is my take on how “Living Better Electrically” came to be, during my lifetime. Here is a typical TV ad from circa 1962, the year I entered the workforce.

Electricity Generation 1962-2012 Living Better Electrically

This 50 year period was my personal career, most of which I spent working in the electric power generation business. Including equipment design, manufacturing, startup, testing, operations, maintenance, emissions reduction and upgrading of coal power production equipment. My specialty was large electric utility fuel burning and steam generating equipment. Upon graduation from Williamson in 1962 I was employed as an electrician then as a utility engineer at Mobil Oil Corporation. In 1966 I joined Babcock & Wilcox working in Barberton, Ohio as a Technical Assistant to the Project Engineer in the Nuclear and Special Projects Department. Projects that I worked on as part of the B&W team were the Duke Oconee Nuclear Steam Systems, numerous reactors, steam generators and pressurizers for Navy Nuclear Propulsion Systems and large heavy walled, high pressure, pressure vessels for the Petrochemical industry.

Duke, Oconee #1 Reactor Vessel at B&W Shop in Mt. Vernon, Indiana, from Duke Annual Report 1967

In the 1960’s electricity was very reasonable in cost and nuclear power was proclaimed by the AEC Head (Atomic Energy Commission) Lewis Strauss as soon to be “Too Cheap to Meter”. Commercial nuclear power generation had been proven at Shippingport and was growing exponentially in applications all across the country. The two most memorable engineering leaders that I remember visiting B&W’s Barberton facilities (while I worked there) were Admiral Rickover, the Father of the nuclear Navy and commercial nuclear power generation and Bill Lee, who at the time, was Duke Power Company’s VP of engineering. Mr. Lee was said to have favored the B&W Nuclear Steam System because it was slightly more efficient with the Once through Steam Generator providing a small amount of superheat that competing NSS (Nuclear Steam Systems) did not provide, to the steam supply to the turbine. Duke Power at the time, had commissioned some of the most efficient coal plants in the world and planned to extract the highest possible efficiency from their first nuclear powered steam supply system. This was logical to Mr. Lee and one reason he was attracted to the new B&W OTSG (Once Through Steam Generator) which was designed for a few degrees of superheated steam temperature. My previous blog post discussed the B&W, C-E and Westinghouse nuclear power manufacturing facilities here.

The Most Efficient and Largest Supercritical Coal Power Plants Built 1957-1975

The 1960’s were exciting times for coal fueled power plants too. Two Milestone supercritical power plants were built and started up during this time. The 5,000 psi Eddystone Steam Station (Philadelphia Electric) with a steam generator built by Combustion Engineering and the 4,700 psi Philo Plant (AEP) steam generator was built by Babcock & Wilcox.

Soon after these magnificent accomplishments was the 900 MW Combustion Engineering series of supercritical steam generators at Conemaugh & Keystone plants in western PA. Then the 1,300 MW supercritical steam generators built by B&W for AEP and TVA. Certainly impressive to me at the time with furnaces over 100 foot wide and operation at over 3,500 psi with superheated main steam at 1,000 degrees F. and also Reheated steam supply to 1,000 degrees F.

Duke Power designed, installed, operated and maintained the most efficient coal plants in the world with the additions of Marshall Units 3 & 4 on Lake Norman in 1969 and 1970.

Later, the Belews Creek coal plant was installed and between Marshall and Belews Creek competed for the highest efficiency coal plants in the U.S. Belews Creek Steam Station is a 2.24-GW, two-unit coal-fired generating facility located on Belews Lake in Stokes CountyNorth Carolina. It is or was  Duke Energy’s largest coal-burning power plant in the Carolinas and when it was operated on coal it ranked among the most efficient coal facilities in the United States. During 2006, it was the fifth most efficient coal power plant in the United States with a heat rate of 9,023 Btu/kWh (37.8% conversion efficiency). In 2008, it was the #1 most efficient coal power plant in the United States with a heat rate of 9,204 British thermal units per kilowatt-hour (2.697 kWh/kWh) or 37.1% conversion efficiency.

A Few of My Personal Experiences with Coal Plants in the 1970’s

My first foray into S.C. was as one of three startup engineers for the SCE&G Wateree coal plant in Eastover, SC. This is a coal fueled, two unit supercritical steam supply plant which uses two Riley Stoker supercritical steam generators. These are the only two supercritical steam generators built by Riley. They have been very successful and in fact, at this writing are still in service 53 years after the startup of Unit #1. After that in 1972 I was assigned as lead startup engineer at the 420 MW Sutton Unit #3 near Wilmington ,NC. This plant is shown below during steam line blowing in June 1972. Steam line blowing was one of my favorite activities in the startup of a new plant. The roar of the exiting steam at supersonic velocity was memorable and provided a sense of the enormous power of steam. Steam line blowing is a one time startup operation to remove grit and foreign debris from inside the superheater and reheater tubes and piping, so that when operation begins, solid particles of debris will not damage the steam turbine blades.

Following the startup of Sutton #3, in January 1973 I joined Carolina Power and Light Company as a senior engineer. My first assignment was as the lead startup engineer on Roxboro Unit #3. This is a 720 MW coal Unit with a unique design of two half capacity boilers and one common feedwater supply train with a blended single stream steam supply to one G-E 720 MW turbine rated at 2,400 psi 1,000 degree F. Superheat and 1,000 degree F. Reheated steam to the last 13 stages of the turbine. The Roxboro plant is shown below in a recent photo by Duke Energy. This plant was started up as CP&L and was later absorbed to be part of Duke Energy.

Reasonable Cost, Abundant, Reliable and Dispatchable Coal and Nuclear Provide the lowest Cost Electricity in the World

The Roxboro plant is still in operation and it is rated at 2462 MW generation capacity. Let me digress with a short anecdote. Back in the time frame of about 1975 I was involved in an ASME meeting in Niagara Falls, NY. As part of the group, we were given a tour of the Niagara Falls Hydro plant on the U.S. side of the river downstream of the falls. I was struck at the time with the realization that all of the water feeding several of the Great Lakes provides (on the U.S. side) about the same generation capacity as the Roxboro Thermal Plant did. A real world lesson in “Energy Density”. Roxboro’s four units are rated 2,462 MW, the Robert Moses Hydroelectric plant 2,300 MW. This comparison is one I find helpful when non-energy trained people ask why are coal plants necessary? It helps to explain the enormous energy density of a coal fueled power plant.

Niagara Falls, Robert Moses Hydroelectric Plant, about five miles downstream of Niagara Falls, From NY Power Authority website

Fuel Diversity Helps Keep Costs Down, All Fuels Are Important

I joined Riley Stoker in 1969 and worked at Tampa Electric on the final acceptance work of the Gannon Station Units 5 & 6. Then on to the SCE&G Waterree plant for the startup of Riley’s first and only supercritical steam generator. Wateree is still running today and it was very successful. After startup of Wateree #1, I was sent to the City of Lakeland, Florida to finish the startup of the 80 MW oil and gas fueled Power Plant #3 (now named McIntosh) The unique and difficult design of this unit was that it was a stand alone, single unit with no steam connections to another unit. It was fueled by heavy oil, #6 or also known as Bunker C. The oil required heating to about 220 degrees F. to reduce the viscosity for satisfactory atomization and complete burning in the furnace. Because there was no gas or steam connections, the startup entailed firing on Diesel fuel until the boiler had at least 1000 psi drum pressure. Then the stored energy of the boiler would be used to heat and circulate oil from the Heavy oil supply tank. It sounds simple enough, however when the new controls and safety interlocks were all in startup mode, unproven and with numerous glitches, steam pressure would be lost and the operation on diesel fuel would need to be repeated. Any field engineer with experience in oil firing Utility boilers knows the importance of steam or compressed air cleaning of the Ljungstrom regenerative air heaters to prevent fires. That is the reason I was sent to Lakeland. The previous startup engineer was not careful about airheater cleaning and both airheaters were destroyed by fires. I was sent to replace that unfortunate startup engineer.

Oil firing was common in the 1970’s because it was competitive with coal at $0.50/million Btu. After Lakeland I was sent to lead the startup of Jacksonville Electric Authority’s Northside #2. A 325 MW heavy oil fueled boiler. Then off to CP&L Sutton #3, a 420 MW fueled at startup with heavy oil and with provisions for future coal fuel. America’s power demand was rapidly growing, especially in the south where air conditioning and heat pumps were taking off in popularity. As I recall peak load growth was about 10% per year. To illustrate the rapid growth in electric demand, here is my recollection of the units added at CP&L over a five year period:

  • Robinson #2, 700 MW, 1970 (Nuclear)
  • Asheville Unit #2, 200 MW, 1971 (coal)
  • Sutton Unit #3, 420 MW , 1972 (coal/oil)
  • Roxboro Unit #3, 720MW, 1973 (coal)
  • Brunswick Unit #1, 836 MW, 1975 (nuclear)

During this time period (1970-1977) CP&L was a regional Utility separate from Duke Energy. The total installed capacity of CP&L back during this time was about 6,000 MW. Therefore, the rapid system load growth is illustrated by the addition of five generating units totaling 2,876 MW in generation capacity in just five years. It was a great time to be involved in the power industry… And then came the Oil Embargo and some difficult times for the industry.

City of Lakeland, Power Plant #3, Now there are three Units, including a 360 MW coal unit #3. Picture by Dick Storm about 1971

During 1973 the U.S. government supported Israel in the Yom Kippur War between Israel and the Arab nations.

At the time of the first oil embargo, 1973-1974, the EPA had been creating needed air pollution rules to reduce emissions from coal fueled power plants. Amongst the first pollutants to be addressed, was particulates. Before the Oil Embargo coal cost and oil cost per million Btus was about the same, right at $0.50 per million Btu. Therefore to reduce emissions fast, Utilities had an economic choice of converting coal plants to oil fuel which has nearly zero ash content or install millions of dollars of backend equipment, including electrostatic precipitators. Carolina Power and Light Company took the path of installing electrostatic precipitators on the newest units (Asheville #2, Sutton #3 and Roxboro #3) and converting the older, smaller coal units to being fueled by oil. Many utilities to the north, including VEPCO, PEPCO, Philadelphia Electric and others, chose the fuel oil conversion route to reduce particulates with less capital cost than installing electrostatic precipitators. This could be done with much lower costs to the consumer because the coal and heavy oil costs were about the same on the fuel cost/million BTU. About $0.50/mmb. Fuel cost is the largest single component of electricity production cost. Comprising between 75 and 92% of the production cost. Thus, when fuel costs escalate, so does the electricity production cost increase.

The Oil Embargo made an immediate fuel supply shortage for all petroleum products and including residual #6 heavy fuel oil. This is when, in my recollections, that major “Wheeling of Power” across state lines became common. The Utilities in the states to the north of CP&L were; VEPCO, PEPCO, Delmarva and Philadelphia Electric. They could receive coal generated electricity from Duke Power, CP&L and other southern Utilities across state lines using existing Transmission interconnections by wheeling power. This was before RTO’s (Regional Transmission Operators) were created.

The 1973-1980 time frame was difficult for Utilities and some had to cut once reliable dividends to stockholders and some went Bankrupt (Consolidated Edison in NY had a particularly difficult time) due to the volatile fuel costs.

National Energy Act of 1978

The energy shock of the oil embargo prompted Congress and the President to act on energy policy. Also during this time the Alaska Pipeline was approved and built(15). Jimmy Carter signed the first Energy Act in 1978.

America’s electricity supply has remained reliable and of reasonable cost for all of my lifetime. Below is a chart of world electricity prices in 2009 which shows the comparison of U.S. electricity prices to other industrialized countries of the world.

Shown on the chart of electricity costs above is Denmark and the Netherlands which were two of the first countries to implement wind farms for significant portions of their power generation.

America up to about 2012 used coal fuel for over 50% of our electricity production. Reasonable cost, reliable, abundant and dispatchable coal, generation powered the largest economy in the world. Reasonable cost electricity and GDP tend to parallel each other as shown on the graph below.

Coal Plant Efficiency Rankings

Up until the war on coal, coal plant designers, operators and maintenance personnel took pride in striving for the best overall efficiency. The best yearly coal plant efficiencies were typically from well run supercritical steam pressure units. Duke Power, PEPCO and AEP typically held the top positions. Duke Power’s Marshall and Belews Creek had repeatedly good years. Here is a typical ranking from 2013, Power Engineering Magazine:

I personally remember many meetings with Utility engineering management where the topic of discussion was modifications to the boilers and fuel burning equipment so that fuel changes could be made to reduce the production costs of power and at the same time, reduce emissions. One fuel change that was popular in the 1990’s was to convert coal plants designed for eastern Bituminous coal to fire western Powder River Basin fuel. This reduced emissions of NOx and kept production cost of power reasonable.

The Shale Gas Revolution

The combination of Hydraulic fracturing and Directional Drilling created an enormously large boost in U.S. natural gas production beginning about 2012. Natural gas prices at the Henry Hub dropped from a high of over $12.00/million BTU to about $2.00/million BTU in 2012. This abundance of natural gas fuel at this price, was competitive with well run, efficient coal plants. Then, the E.P.A. ramped up restrictions on coal plant emissions but the consumer was insulated from electricity price hikes because many natural gas CCGT (Combined Cycle Gas Turbine) plants were being built and fuel diversity allowed the Utilities to switch generation from coal plants to new, highly efficient CCGT generating units.

The vastly increased supply of natural gas drove the price of gas down to below the cost of coal on a unit heating value basis. Gas dropped to below $2.00 per million Btu. Also during this time period, gas turbine-combined cycle plant efficiencies increased to the range of 60%. Power generation efficiencies over the years is shown on the graph below. The combination of low cost natural gas and enormous efficiency advantage of CCGT plants greatly increased the use of natural gas fuel for power generation. Keep in mind, the advantage of natural gas fuel is only an advantage when there are pipelines to provide the fuel and there is an abundant natural gas supply. This does not work well in all states, such as Massachusetts and Hawaii.

The combinations of low fuel cost, low Capital cost, low environmental emissions controls cost and greatly increased efficiency together made natural gas fuel more economically attractive than coal for new generating plants. The fuel of choice became natural gas for Utilities that had pipelines and sources of natural gas fuel. Coal fuel accounted for 50% of electricity generation in 2004 but was reduced to 23% by the increased use of more economical natural gas by 2019.

Duke Energy, Buck Station CCGT Plant

America is Blessed with Enormous Energy and Mineral Resources

America has plenty of Coal, oil, natural gas and nuclear fuels to power our economy and our life styles. I have written other blog posts on the relationship of energy and economic prosperity. Specifically, our lifestyles and our industrial production requires on average, about 315 +/- 15 million Btus of energy each year per person This equates to about 100 Quadrillion Btus of energy per year for our country. This level of energy requirement has held steady for about twenty five years. More on the need for 100 Quads of energy/year are here, here, here and here (20, 21, 22, 23) . Up until the manufactured climate hoax and war on carbon, America enjoyed reasonable cost, reliable electricity and also gasoline, Diesel and Jet Fuel supplies. America became energy independent in 2020.

Energy Growth and Clean Air Too!

Protection of the environment is important to all of us, including me. In fact, much of my career was invested in improving efficiency and reducing emissions of coal generating plants. There has been steady progress in cleaning the air and water of the U.S. and I would be remiss if I did not show that during the preceding eight decades in spite of population growth, increases in the number of miles driven and the growth of the economy, the real pollutants have been drastically reduced from the levels of the 1950’s, 1960’s and 1970’s. The chart below was prepared by the EPA.

Two of the Last Clean Coal Plants Built in America

Coal plants are robust, reliable and when properly maintained can run safely and reliably for over fifty years. Several of the plants that I have personal experience with were mentioned above. However, newer designs with greater efficiency and improved emission controls should be built to replace the aging plants. In 2008 there were plans for dozens of new, clean coal plants to be built. Two magnificent examples are the John Turk Plant and the (then called Cliffside) #6 Unit at Rogers Energy Center in S.C.

Duke’s Rogers Energy Center Unit #6 Startup 2013
AEP-John Turk Plant, Arkansas

Example of Many New Coal & Nuclear Plants, Planned and Should Have Been Built 2012-2022

Santee-Cooper Pee Dee Plant, Planned to Be Built near Florence, SC

The Pee Dee Energy Center is one example of dozens of new, clean, efficient coal plants that were planned but cancelled due to political pressure of the environmental activists. I predict that these plants will be sorely missed during the winter peak power generation periods in December 2023 and January 2024. So will the Summer Nuclear Units #2 & 3 be missed.

Slide of Summer 2 & 3 and Vogtle Plant Construction from Dick Storm USCB-OLLI Course

Summary

My contribution to the progress made in the last 80 years was very modest and I will quickly admit that. However, because I worked with many talented and visionary engineers and in hundreds of generating plants around the world, I had a very good position to observe the progress of the giants in our industry. Engineers with a Vision of abundant, clean and reasonable cost electricity generation. To mention a few of these giants: Admiral Hyman Rickover, Bill Lee of Duke Power, Mendall Long of CP&L, Bill McCall of Santee-Cooper and many more fine engineers like them. What were their goals? To improve the quality of life, security, safety, economic growth, ensure that reasonable cost power could be produced for decades into the future, provide Bulk Power at the lowest possible cost to attract industry, increase industrial output, provide good paying jobs in their service territory, and design power plants that provide environmental protection for all of the citizens.

During the last 80 years nuclear power became a reality and today about 19% of our electricity is generated from clean, carbon free nuclear power plants. Many are now over fifty years old, but still reliable and inexpensive producers of vital electricity.

Natural gas generation has progressed from the first simple cycle unit built by G-E in 1949 at about 25% efficiency to today’s combined cycle gas turbine plants that at optimum load points can operate at over 60% thermal efficiency. They are amongst the most efficient machines ever built, of any kind.

Ultra-supercritical, clean coal plants such as Turk and Rogers #6 have been developed to provide reliable, reasonable cost, clean and importantly, Dispatchable power generation. There should have been built more like these Why? Because fuel diversity is important when one fuel becomes short in supply. For example, the 1973-74 Oil Embargo. Today most of the Dispatchable electricity generation is from natural gas which of course, flows through pipelines. Pipelines are reliable but, fuel storage is not practical. Coal plants, on the other hand, can store several months fuel supply on site.

Fuel Diversity is important for electricity generation reliability. I am proud to have worked during these years to do my best to make a small contribution to the great progress that was accomplished.

Part 2 will describe the self induced end of reliability, affordability and dispatch ability of electricity generation. As Dr. Euan Mearns recently wrote in “Watts Up With That”….The “Energy Transition is Social Vandalism”(19)

It is my best hope that America and our politicians will wake up and understand the importance of primary energy from conventional sources.

Yours very truly,

Dick Storm, October 4, 2023

References

  1. You Tube video of a “Living Better Electrically” ad hosted by Ronald Reagan, who was with the G-E Theater on Sunday nights for 8 years 1953-1962: https://www.youtube.com/watch?v=u5Lz1C53RwI
  2. NY Power Authority Facts on Robert Moses Hydroelectric Plant at Niagara Falls: https://www.niagarafallsinfo.com/niagara-falls-history/niagara-falls-power-development/the-history-of-power-development-in-niagara/robert-moses-generating-station/
  3. Duke Energy Roxboro Plant Info: https://www.duke-energy.com/our-company/about-us/power-plants/roxboro-plant
  4. Duke Power Belews Creek Plant Wikipedia: https://en.wikipedia.org/wiki/Belews_Creek_Power_Station
  5. 1973-1974 Oil Embargo History, Arab-Israel War: https://history.state.gov/milestones/1969-1976/oil-embargo
  6. 1973 Oil Embargo by Federal Reserve: https://www.federalreservehistory.org/essays/oil-shock-of-1973-74
  7. Duke Power References of Oconee & Marshall Steam Plant Annual Report 1967: https://www.nrc.gov/docs/ML1526/ML15261A046.pdf
  8. Power Magazine Feature article on the Top Plant, Duke’s Cliffside #6 which started up in 2013. The last new coal plant I can remember being commissioned for commercial service in the U.S. : https://www.powermag.com/cliffside-steam-station-unit-6-cliffside-north-carolina/
  9. Scientific American, March 2023, “Seven Ways Jimmy Carter Improved U.S. Energy Future, or At Least Tried to” : https://www.scientificamerican.com/article/7-ways-jimmy-carter-has-improved-americas-energy-future-or-tried-to/
  10. Power Magazine article on High Efficiency Gas Turbine Developments, 2018: https://www.powermag.com/efficiency-improvements-mark-advances-in-gas-turbines/
  11. POWER Magazine article on the History of Gas Turbines for Electricity generation: https://www.powermag.com/a-brief-history-of-ge-gas-turbines-2/
  12. Politico, 2015 article “Inside the War on Coal”: https://www.politico.com/agenda/story/2015/05/inside-war-on-coal-000002/
  13. Obama’s War on Coal 2008 article in Townhall: https://townhall.com/tipsheet/conncarroll/2014/04/01/obamas-war-on-coal-n1817140
  14. Explanation of Directional Drilling for Hydraulic Fracturing and production of Shale Gas, Drillers.com: https://drillers.com/directional-drilling-everything-you-ever-wanted-to-know/
  15. National Energy Act of 1978, Energy Policy Act and PURPA: https://en.wikipedia.org/wiki/National_Energy_Act
  16. History of the Alaska Pipeline by the American Oil & Gas History Society: https://aoghs.org/transportation/trans-alaska-pipeline/#:~:text=Oil%20was%20first%20discovered%20in,renewed%20in%20November%20of%202002.
  17. New York Times, May 10, 1974, Con-Edison Declares it may go Bankrupt without help, due to Oil Embargo fuel cost escalations: https://www.nytimes.com/1974/05/10/archives/con-edison-says-it-faces-bankruptcy-without-help-con-ed-says-it-is.html
  18. Congressional Report on Financial Condition of Utilities, 1970-1986: https://www.cbo.gov/sites/default/files/99th-congress-1985-1986/reports/doc10b-entire_1.pdf
  19. WUWT, Oct. 3, 2023, “Energy Transition is Social Vandalism” :https://wattsupwiththat.com/2023/10/03/the-energy-transition-is-social-vandalism/
  20. America Needs about 100 Quadrillion Btus of PRIMARY energy each year: https://dickstormprobizblog.org/2023/05/16/back-to-basics-the-u-s-needs-100-quadrillion-btus-year-of-primary-energy/
  21. Energy=Life as We Know and Enjoy it: https://dickstormprobizblog.org/2022/08/22/energy-life-that-is-life-as-we-enjoy-it/  
  22. Energizing the Public to Understand the Importance of Primary Energy: https://dickstormprobizblog.org/2023/03/20/educating-and-energizing-the-public-on-energy-policy-and-the-impossibility-of-powering-america-with-wind-and-solar/
  23. Energy and Economic Prosperity: https://dickstormprobizblog.org/2022/11/18/energy-and-economic-prosperity-2/
  24. Wake Up America:  https://dickstormprobizblog.org/2023/09/21/please-wake-up-america-your-energy-and-electricity-generation-reliability-are-at-risk/
  25. Dick Storm ENERUM, August 2022 presentation:  https://www.linkedin.com/posts/richard-storm-00557810_presentation-and-speakers-notes-from-august-activity-7068650158862827520-B-_W?utm_source=share&utm_medium=member_desktophttps://www.linkedin.com/feed/update/urn:li:activity:7056884647858765824?updateEntityUrn=urn%3Ali%3Afs_feedUpdate%3A%28V2%2Curn%3Ali%3Aactivity%3A7056884647858765824%29

Energy & World Peace

The United Nation’s Highest Priority In November 2021 to Save The Planet Was COP-26. Which Is More Important , Peace in the World, The Paris Climate Agreement or Avoiding World Famine and Improving the Quality of Life For All of the People of the World, Including Ukraine?

By Dick Storm

Introduction

Horrible crimes against humanity are being committed in the Russia-Ukraine war. Innocent people are being murdered, homes demolished by military bombardment and artillery, world food production slowed(3,4,5) and what are the leaders of the world concerned about? Manmade Climate Change, the most successful scientific hoax in the history of the world. Three world leaders could improve world peace and start the correction of the mess the world is in today if they would change the priorities of the UN. Who am I referring to: Joe Biden, Justin Trudeau and the United Nations Secretary General, António Guterres.

Remember the UN priorities in November 2021? If not, here is a review of what these three leaders considered the most sinister problem the people of the world would face in the future. Flashback to Scotland, November 2021:

Biden arriving in Scotland for COP-26
Guterres Addressing COP-26, Stating the need for “Climate Action”
Justin Trudeau at COP-26 in Scotland

What is The Purpose of the United Nations and The Paris Agreement? World Peace? Protection of the Environment?….or One World Government to Control The People of The World?

As the world is on the threshold of nuclear war with a world food crisis likely next winter from reduced fertilizer availability and massive unproductive farmland in a war zone, these three leaders and many other sycophants have the Paris Agreement for Climate Change Policies as their top agenda, instead of the best interests of their constituents, world peace and improving the human development index of the people of the world.

I feel strongly that the top priority of these leaders and the U.N. is not concern for the planet that drives them. It is politics and control of the world’s citizens. In short, power over people. For example, the UN Secretary General’s background is copied below. This is from his Bio on the UN web page, From Mr. Guterres Curriculum vitae: “For many years Mr. Guterres was active in the Socialist International, a worldwide organization of social democratic political parties.”

Let me digress and quote the past president of the Czech Republic on the “Climate Zealots” such as Guterres, Biden, Kerry, Gore, Trudeau and many more.

Vaclav Klaus is Past President of The Czech Republic and grew up under Communism then had to wrestle with policies by the “Greens” of Europe. An Economist by training. His words, from about 2007…..“Global Warming is a false myth and every serious person and scientist says so. It is not fair to refer to the U.N. panel. The IPCC is not a scientific institution: it’s a political body, a sort of non-government organization of green flavor. It’s neither a forum of neutral scientists nor a balanced group of scientists. These people are polititicized scientists who have arrive there with a one-sided opinion and a one-sided argument”(49)

Justin Trudeau also could help guide the United Nations to a truly serious priority, but according to Peter Schweizer’s recent book, “Red Handed”, Trudeau also ranks political power above world peace. See page 187 describing the Trudeau family and links to China: Justin Trudeau is quoted in 2013: When asked which country he admired the most replied “There is a level of admiration I actually have for China….because their basic dictatorship is allowing them to turn their economy around on a dime and say, ‘we need to go greenest, fastest—we need to invest in solar’ I mean, there is flexibility that I know Stephen Harper (the Canadian PM at the time) must dream dream about having a dictatorship that he can do everything he wanted, and I find that quite interesting”      

Avoiding Famine

It should be blatently obvious that ranking peace and the world food supply should be more important than the Paris Climate Agreement which is based on a scientific hoax anyway. Ukraine alone supplied about 12% of the global wheat before the war, and was the biggest producer of sunflower oil. About two-thirds of the country’s wheat exports had already been delivered before the invasion, but the rest is now blocked, and farmers may be unable to continue with spring planting, or take in grain harvests in the summer. A headline in the “Times of Israel” reads, “Israel scrambles for solutions as Ukraine war chokes off egg, wheat imports”Industry figures predict egg shortage and sky-high wheat prices just in time for Passover holiday. The prospect for the world later this year is shortages of food across the globe. (3,4,5, 30) 

Ukraine Grain Field from Times of Israel

Energy impacts Fertilizer too! Ukraine and Russia are also major producers of fertilizer, prices for which had already leapt under high energy prices – and the war is sending energy prices higher still, with further impacts on agricultural production costs.

Fertilizer costs in the U.S. have also tripled this year. Partly because of Biden’s energy policies and exacerbated by the Russian invasion of Ukraine.  The impact of energy on food availability goes beyond higher cost Diesel fuel for shipping transportation fuel in the supply chain. Fertilizer and farmland in areas of conflict are a huge problem. (2,3,4,9,10)

Perhaps better kept as a separate subject to write on, but most people are not aware that between 30 to 40% of the U.S. corn crop is used to produce Ethanol for a gasoline additive that lowers the energy equivalent of gasoline and reduces auto mileage. Suffice it to say, energy and environmental policies that promote burning food for fuel also affects the world food supply.(16,17)

How is Energy Linked to World Peace?

I began this essay on the priorities of the leaders of the world and the priorities they saw as top priority in November 2021. Well, if you think the Mainstream Media has been duped and indoctrinated then you are not alone. While the world’s media attention was on the War on Carbon, very serious problems were brewing and under-reported. Kindly take a look at the six charts below: 1. Total primary energy of the world, 2. Coal Consumption by Region, 3. COEmissions of the World, 4. Total Energy by Source for China and 5. Total End Use of Coal Fuel for Products and 6. China, The World’s Superpower of Manufacturing. 

Over 50% of the world’s Fossil Fuel energy is being used by China to manufacture over 50% of the world’s steel, aluminum and just about every other product needed by the free world. These are easily verifiable facts reported by Our World in Data, IEA.org, the United Nations, EIA  and Statista. Energy and Economic Prosperity are inextricably related.

Energy Use by China, U.S.A., Japan, EU and India By IEA
IEA Graph of Total CO2 Emissions from Combustion Processes 1900 2021

So what is driving the recent rapid increase in world CO2 emissions? According to the IEA, it’s mainly China:

The rebound of global CO2 emissions above pre-pandemic levels has largely been driven by China. . . . China’s CO2 emissions increased by 750 Mt over the two-year period between 2019 and 2021. China was the only major economy to experience economic growth in both 2020 and 2021. The emissions increase in China more than offset the aggregate decline in the rest of the world of 570 Mt between 2019 and 2021. . . . With rapid GDP growth and additional electrification of energy services, electricity demand in China grew by 10% in 2021, faster than economic growth at 8.4%. The increase in demand of almost 700 TWh was the largest ever experienced in China. With demand growth outstripping the increase of low emissions supply, coal was called on to fill 56% of the rise in electricity demand.(47)

Total Energy Supply (TES) By Source, People’s Republic of China, 1990-2019

The South China Morning Post” reported April 1, 2022, quoting “China’s Zhang Jianhua, chief of the National Energy Administration: “It signed an agreement to be supplied with 100 million metric tonnes of Russian crude oil over the next 10 years and a 30-year gas supply contract.

The world’s second largest economy suffered a nationwide energy crunch in September of last year amid local decarbonisation and energy saving campaigns, which has forced policymakers to adjust energy policies.

In the 14th five-year energy plan for 2021-25 released last week, Beijing said it would set annual crude output at around 200 million metric tonnes and lift natural gas output to more than 230 billion cubic metres from 205.3 billion cubic metres.

Coal and thermal power will remain the bedrock of China’s energy security strategy, Zhang wrote in the article.” (31)

The above is a direct quote from the SCMP, except the bold and underlining of the last line which was by me.

A recent post in WUWT stated, “China Continues To Laugh At Western “Green Energy” Foolishness”(47)

Why? The graphs above show China’s energy  sources and growth in consumption. Economic prosperity is powered by Energy and China has used a lot of energy to become the world’s largest manufacturer.

Russia is the World’s Gas Station, China is the World’s Largest Manufacturer, Still think the UN Has it Right with the War on Carbon as their Top Priority?

China continues to power their mammoth manufacturing might with coal plants. We should remember our history, do you remember the term “The Arsenal of Democracy” when America provided the remarkable production of airplanes, tanks, guns, ships, arms and materiel to help the Allies win WWll? Some say “History Repeats”…..and if we switch to current events, Russia and China are very cozy with each other at this horrible time for Ukraine.

My point is that energy is a pre-requisite for economic prosperity. China gets it. China, Environmental Extremists, Socialists and Russia have duped the UN and the world leaders into believing the planet is imperiled by 0.041% carbon dioxide that is in the atmosphere. Meanwhile, China burns over half of the world’s coal to power their industries. Russia remains the world’s gas station and holds Europe hostage to Russia’s gas (and more) while the Green’s of Germany shut down safe, proven, reliable and reasonable production cost coal and nuclear power plants, making them beholden to Russian energy. This is nuts.

China has risen from a “Developing Country” in 2000 to the second largest economy in the world. They not only manufacture much of the steel, aluminum, rare earth minerals for batteries, solar panels and wind turbine components, they also manufacture much of the Pharmaceuticals used in the world and in the U.S. Have you tried to purchase a made in U.S.A. Drug lately? This brings me to banking. As a small businessman about thirty years ago, I remember how important banks were to sustain our business. To provide business loans for expansion, cover payroll until the invoice for products or services was paid and for conducting commerce in other countries. Banks and the size of banks is one metric to use to judge a country’s economic prosperity.  China seems to me, to be pretty slick in their approach to dominating the world. They quietly support Russia and other rogue nations while they focus on producing products, acquiring world natural resources and taking over the world by using the weaknesses of Democracy & Capitalism to exploit their Financial muscle. Let’s take a look at China’s financial muscle. To be perfectly honest, the ranking of the world banks surprised me and I thought I kept up with world business news.

China and Banking

China now has five of the world’s ten largest Banks. Yes, being the world’s largest manufacturer has it’s advantages. It creates wealth which can then be converted into International Influence. The China “One Belt, One Road” or “Belt and Roads Initiative” is an example that is playing out around the world. Also, I am told by a financial expert, China holds about 4% of the U.S. Treasury debt.

A lot of people who have not run a business do not understand the need for working Capital. When a company cannot get loans to cover everyday costs or to finance future improvements they go out of business. We might ask some questions regarding the ESG Movement and Regulations that are pending with regard to discouraging or demonizing investments in fossil fuels (and suppliers to fossil fuel producers) by US investors. Is there a sinister, foreign influence side to the ESG movement and Federal Regulations? Here is the list of the top ten banks of the world. Yes, five of the top ten are Chinese.

My point is, manufacturing requires lots of energy. Especially primary metals and heavy manufacturing. As seen from the graphs above, China has grown enormously in manufacturing capacity since they entered the WTO in 2001. To put it in perspective, China built more electric generation capacity in twenty years than the U.S. did since the days of Thomas Edison and George Westinghouse 100+ years ago.

Getting back to finance, did you catch the small news item last week? As it is related to energy, Saudi Arabia is considering acceptance  of the Chinese Yuan for oil and China will be pushing to use other currency than the USD as they continue to grow their economy. (50)

Let’s Review the Sources of the Dependable, Dispatchable and in 2020, Reasonable Cost Energy that We Depend On

If you take what you see in the newspapers and on TV seriously, you would think that we only have a little way to go to convert our economy to zero carbon. This is not true!

I cite the example of a usually conservative Newspaper, the Wall Street Journal. This is a screen shot of a video they had last year which was based on facts, but at the same time misleading the public on the success of “Green Energy”.

WSJ Video, Screen Shot with my Text Added to Be Wary of Headlines such as this

Yes, the 90% of “NEW GENERATION” in 2020 was Renewable, but the true useful energy production was less than 4% of the total energy provided to the U.S.A.

This is a reminder, over 90% of America’s energy is provided by conventional fuels such as oil, natural gas, coal, nuclear, waste to energy, biomass and old hydroelectric power stations.  The Lawrence Livermore Labs Sankey Diagram, in my opinion, is the best single illustration to show true energy flows from the sources to end use. It is copied below for the year 2019. This is simply the true facts of where we obtain our energy:

America has been using right at 100 Quadrillion Btu’s of energy for decades. The next chart below, shows the historical energy use from 1950-2019.  This is a useful chart to consider the transfer of energy from fossil fuels to electric vehicles. Notice that only 3.78% of our Total Energy was provided by solar and wind in 2019. Now imagine the futility of replacing the 37% of our Total Energy now provided by petroleum, with EV’s. The Government Net Zero Carbon plans to replace not only the petroleum but also Natural Gas and Nuclear. The Total Energy supplied by Petroleum is about 37%, Gas 32%, Coal 11.4% and Nuclear 8.5%. These “Conventional sources of energy total 88.9%. Replacing this energy with renewables by 2030 or even 2050 will require an enormous technological breakthrough. The government should not promote policies based on miracles.

To keep our same freedom and high quality of life, it requires each of us 331 million Americans to utilize an average of about a million Btu’s in energy each day.  Averages are often misleading, consider the millions of Btu’s used by the world elitists that traveled to Scotland for COP-26. My understanding is that there were over 400 private jets and that the fuel used for these delegates exceeded the total petrol used by Scotland for an entire year. That should provide a clue regarding the sincere interest of the participants in the UN Climate talks to save the planet.   It is reasonable for each of us living in the Developed World to continue using our allotment of about a million Btu’s of energy each day.

America’s Total Energy Use has been steady at about 100 Quadrillion Btu’s each year for the last 20 years, EIA

My Suggestion, On How to Fix this Energy, World Peace and Food Supply Mess

The War of Carbon in my viewpoint is contributing to International conflicts and harming world peace. If Joe Biden would  rescind most of his Executive orders  including drilling on Federal Lands, Building the Keystone Pipeline and scrapping the Paris Climate Agreement, it would, in my opinion, contribute to world peace and much more. (1,2,3,5,13)  

The Biden administration is testing new depths of mind-blowing political dysfunction, by begging OPEC for more oil, while at the same time maintaining their attack on the US domestic oil industry. (28) Speaking of attacks on the energy producers that we depend on…..

ESG, One of America’s Self Inflicted Roadblocks for a Sane Energy Policy

The (ESG) movement is harming U.S. productive capacity of conventional fuels that are needed. (See above Sankey Diagram to show what we need) These actions are pushed by environmental groups, by government and by big business. (33, 34, 35, 36, 37, 38, 39, 40)  These ESG punitive actions have been ramped up, such as Biden’s “Whole Government Approach to Climate Control Policies” with involvement of the Securities and Exchange Commission, the EPA, IRS Tax policies and more. 

Meanwhile, NGO’s also are attacking US Energy producers. Does this look to you like it could be coordinated with America’s world competitors or enemies? It does to me. Check reference #44 entitled, “What Divestment From Russia Means for Activism Against Fossil Fuels” then the sub title: “It’s time to scale up fossil fuels divestment”(44). When 80% of the energy we depend on is from oil, gas & coal, does this seem like a Patriotic and good action? Not in my book. Another excellent reference on the good that Fossil Fuels do to keep America strong and to improve the quality of life for all of the people of the world.  The publication by Liberty Oilfield Services is entitled “Bettering Human Lives, 2020 ESG Report”(45)  

It could be argued, that keeping America energy independent and the Free World less dependent on rogue nations is important for national security. Look at the mess Europe is in now with their dependence on Putin’s Russian natural gas. The Greens helped push Europe toward Green Energy and they are working hard here in the US too. The environmental extremists were successful in stopping all major new coal plants from being constructed in the US since about 2012. The last major Utility scale clean coal plants I am aware of are Turk in Arkansas and Longview in West Virginia. Even then to obtain operating permits, the environmental extremists were paid off in settlements. These settlements were millions of dollars.(46)  Quite honestly, it is extortion which was enabled by the US government. How does this make America stronger and more energy independent?

How About Clean Air?

Before Biden’s Executive orders to push America toward intermittent green energy, our air was and remains amongst the cleanest in the world. The EPA Graphic copied below shows the trends of cleaner air from 1970-2020. This is regarding the six major pollutants that are a real threat to health. I just like everyone else enjoy and appreciate clean air and clean water. I also like my freedom and the American life style that I have enjoyed all of my life.

From EPA website

From my personal experiences of traveling around the world, I can honestly say America’s air is as clean or cleaner than most other countries that I have visited either on business or pleasure. Note the EPA chart above does show the increases in population and GDP from 1970 to 2019, as the six aggregate named pollutants were steadily reduced. There does come to be a point of diminishing returns on air pollution controls just like most other problems. That is, unless you are a Bureaucrat and wish to keep making more and more and stricter yet Regulations. That is the case, in my opinion of the restrictions on COand the Net Zero Carbon and Extreme Green policies.  These Regulations and Executive Orders are harmful for American competitiveness and harmful for Peace and Prosperity of the world.

Conclusions

  1. The Net-Zero Carbon Climate Policies are contributing to turmoil in the world by weakening America and NATO Allies. The Paris Agreement for working toward Net Zero Carbon is politically driven, not by concern to save the planet.
  2. The Green Energy Movement in Europe should be an example for the U.S. to learn from. They have had extreme cost escalations and, in some cases, rolling blackouts.
  3. Conventional Fuels of Natural Gas, Coal, Oil, Nuclear, Hydroelectric and Biomass provide over 90% of our energy. Ramping up Renewable solar and wind from about 4% to 100% is unrealistic and impossible to achieve without technological breakthroughs.
  4. The ESG Movement (Environmental Social and Governance) is Discouraging needed investments in oil and gas production as well as harming most all Energy Producers. Check references 33 through 39 for more details.
  5. If Net Zero Carbon was really needed or important, then the Government would encourage the building of more nuclear power plants. Hundreds of them as most of the about 20% of our electricity and over 50% of our carbon free electricity is produced by nuclear now. Most of these nuclear plants were started up in the 1970’s and 1980’s. (41, 42, 43)
  6.  World Peace and Prosperity could be better achieved if the world leaders were to focus on the true problems of the world, rather than a war on carbon.

The foregoing are selected facts and data to support my claim that if President Biden were to rescind his 2021 Executive orders and roll back EPA, Dept of the Interior and other Government Regulations to those in effect when he took office, America could begin a recovery of correcting inflation, supply chain issues, increased food production for the world, improved economic growth & Prosperity and even leading the world to peace.

Respectfully submitted,

Dick Storm, April 5, 2022

References and Resources for Further Reading to Support My Conclusions:

  1. Joe Biden Executive Orders List From January 20, 2021: https://www.marketwatch.com/story/all-of-president-bidens-key-executive-orders-in-one-chart-2021-01-21
  2. Peace Through Strength & Free Markets are what built America, Phil Gramm and Mike Solon, March 2, 2022: https://www.wsj.com/articles/peace-through-strength-economic-freedom-open-trade-china-ccp-economy-america-competes-act-antitrust-biden-11646154226?cx_testId=3&cx_testVariant=cx_130&cx_artPos=7&mod=WTRN#cxrecs_s
  3. World Food Supply Insecurity, WSJ: https://www.wsj.com/articles/ukraine-war-stokes-insecurity-in-the-worlds-food-supply-11647343035?mod=Searchresults_pos20&page=1
  4. Fertilizer Prices Worldwide are increasing, WSJ: https://www.wsj.com/articles/ukraine-war-hits-worlds-farmers-as-russia-cuts-fertilizer-supplies-hurting-brazil-11646487815?mod=article_inline
  5. Surging Fertilizer Prices Push Farmers to shift Planting Plans, Raise Prices : https://www.wsj.com/articles/surging-fertilizer-costs-push-farmers-to-shift-planting-plans-raise-prices-11639580768?mod=itp_wsj&mod=djemITP_h
  6. IEA Energy Profile of China: https://www.iea.org/countries/china
  7. Germany’s Energiewiende description by World Nuclear Association. : https://world-nuclear.org/information-library/energy-and-the-environment/energiewende.aspx
  8. German Magazine Der Spiegel article on the importance of coal in Nov. 2021: https://www.spiegel.de/international/business/troubling-addiction-the-world-is-failing-to-phase-out-coal-a-6d2007de-8196-4466-aaca-8b6a2714ec78
  9. World Food Crisis Likely due to Russia-Ukraine War, The Guardian, March 14, 2022: https://www.theguardian.com/world/2022/mar/14/ukraine-invasion-worldwide-food-crisis-warns-un
  10. Eleven-year-old article on the importance of Ukraine Grain, the Guardian: https://www.theguardian.com/world/2010/jul/20/ukraine-grain-farming-exports
  11. Top Banks in the world, lexis Nexis: https://risk.lexisnexis.com/insights-resources/article/bank-rankings-top-banks-in-the-world
  12. Saudi Arabia considers payment for oil with Yuan, Bloomberg, March 15, 2022: https://www.bloomberg.com/news/articles/2022-03-15/yuan-surges-after-report-on-saudis-accepting-currency-for-oil
  13. Biden’s Plan to starve Americans of Fossil Fuels, Paul Driessen, CFACT: https://www.cfact.org/2022/03/27/bidens-plan-to-starve-america-of-fossil-fuels/
  14. “Greenpeace Environmentalism in Europe, Allowed Putin to Invade Ukraine”, CFACT: https://www.cfact.org/2022/03/09/greenpeace-environmentalism-allowed-putin-to-invade-ukraine/
  15. Competitive Enterprise Institute, Background on the Clean Power Plan: https://cei.org/clean-power-plan/
  16. Scientific American, Rethinking our Corn to Ethanol Policy: https://www.scientificamerican.com/article/time-to-rethink-corn/
  17. Corn for Ethanol, Univ. of Nebraska: https://cropwatch.unl.edu/bioenergy/corn
  18. Why your Electric Costs are Surging and likely to go higher, March 15, 2022: https://www.wsj.com/articles/why-your-electric-bill-is-soaringand-likely-to-go-higher-11647250380?mod=hp_featst_pos4
  19. Germany’s Nuclear Surrender Opinion, Dec. 24, 2021: (See last reference #51 below)
  20. Factories close in UK due to High Energy Costs, WSJ: https://www.wsj.com/articles/surging-energy-prices-close-u-k-factories-another-bottleneck-in-a-world-full-of-them-11631792586?mod=Searchresults_pos5&page=1
  21. Behind the rise of U.S. Solar,  Built with a Mountain of Chinese Coal WSJ: https://www.wsj.com/articles/behind-the-rise-of-u-s-solar-power-a-mountain-of-chinese-coal-11627734770?mod=Searchresults_pos18&page=9
  22. If Renewables are so Cheap, then Why is Germany’s Electricity so Expensive? American Experiment : https://www.americanexperiment.org/if-renewables-are-so-cheap-why-is-germanys-electricity-so-expensive/
  23. United Nations News, November 2021, COP-26: https://news.un.org/en/news/topic/climate-change
  24. United Nations, News regarding “World Peace and Sustainability” March 22, 2022: https://news.un.org/en/story/2022/03/1115272
  25. Scottish News, “Private Jets of Climate Elites Blast More CO2 to Travel to COP-26  than 1600 Scots Pump Out in a Year”: https://www.dailyrecord.co.uk/news/scottish-news/private-jets-flying-cop26-blast-25338840
  26. Donn Dears articles on the true facts and Common Sense of the Importance of Energy, including “How Europe Dithers” while the Russians prepared for war: https://ddears.com/donns-articles/
  27. WUWT Blog, “Arab Nations Respond to Global Energy Demand for Energy Security”, April 3, 2022: https://wattsupwiththat.com/2022/04/02/whos-talking-climate-change-now-arab-states-respond-to-global-demand-for-energy-security/
  28. Biden Suspends Oil and Gas Leases to Protect the World from Climate Change, WUWT January 2021: https://wattsupwiththat.com/2021/01/21/biden-suspends-federal-oil-and-gas-permits-because-climate-change/
  29. Toronto Sun, “Oh the Hypocrisy of Climate Change”: https://torontosun.com/news/world/oh-the-hypocrisy-private-jets-pack-scotlands-climate-conference
  30. Times of Israel, “Israeli’s Scramble For Food” : https://www.google.com/url?q=https://toi.by/nwkDto&source=gmail&ust=1649072066572000&usg=AOvVaw1zxNxuPXllU7WBiaJoMgyM
  31. South China Morning Post, Energy News regarding Russia-Ukraine War, April1, 2022: https://www.scmp.com/economy/china-economy/article/3172764/china-vows-bolster-energy-security-ukraine-war-stokes-period
  32. IEA, Total Primary Energy Use for World 1971-2017: https://www.iea.org/data-and-statistics/charts/total-primary-energy-supply-for-the-eu-and-selected-countries-1971-2017 ESG and Climate Related Financial News to Cripple U.S. Conventional Fuels Production:
  33. BANK OF AMERICA CEO, Nov. 9, 2021: https://www.wsj.com/articles/why-financing-the-multi-trillion-dollar-transition-to-net-zero-isnt-that-hard-11636018200
  34. Who is Driving “Climate Funds”: https://www.wsj.com/articles/climate-funds-whos-driving-growing-demand-11637165424?mod=latest_headlines
  35. WSJ Citi Bank to eliminate some Clients that are not “Green” enough, Dec. 7, 2021: 
  36. https://www.wsj.com/articles/citigroups-jane-fraser-expects-to-shed-some-clients-for-climate-purposes-11638912251?mod=business_minor_pos15
  37. WSJ Finance ESG Conflict of Interests, Jan 29, 2022: https://www.wsj.com/articles/wall-streets-green-push-exposes-new-conflicts-of-interest-11643452202?cx_testId=3&cx_testVariant=cx_5&cx_artPos=0&mod=WTRN#cxrecs_s
  38. ESG Investing Nov. 18, 2021: https://www.wsj.com/articles/climate-and-environment-focused-funds-dominate-esg-11637092844
  39. SEC Requirements for Climate Change Disclosure March 21, 2022: https://www.wsj.com/articles/sec-to-float-mandatory-disclosure-of-climate-change-risks-emissions-11647874814?mod=djemalertNEWS
  40. Blackrock Climate Policies to Make Money Jan. 7, 2022: https://www.wsj.com/articles/larry-fink-wants-to-save-the-world-and-make-money-doing-it-11641484864?mod=itp_wsj&mod=djemITP_h
  41.  Small Modular Reactors, WSJ, Aug. 2021 : https://www.wsj.com/articles/utilities-eye-mini-nuclear-reactors-as-climate-concerns-grow-11627905600?mod=article_inline
  42. WSJ Saturday Essay on the Future of Nuclear Power in a Carbon-Free World: https://www.wsj.com/articles/is-nuclear-power-part-of-the-climate-solution-11641571176
  43. World Nuclear Association, Nuclear Power Facts: https://world-nuclear.org/information-library/country-profiles/countries-t-z/usa-nuclear-power-policy.aspx
  44. An interesting post by the Sierra Club, entitled, “What Divestment from Russia Means for Activism Against Fossil Fuels From Russia” March 22, 2022: https://www.sierraclub.org/sierra/what-divestment-russia-means-for-activism-against-fossil-fuels
  45. Liberty Oilfield Services, 2020 ESG Report, “Bettering Human Lives”: https://www.libertyfrac.com/bettering-human-lives-2020-esg-report/
  46. Settlement of John Turk Power Plant with Environmental groups, Arkansas Times, 2011: https://arktimes.com/arkansas-blog/2011/12/22/sierra-club-audubon-settle-with-swepco-on-turk-power-plant  and https://www.aep.com/news/releases/read/1235/AEP-
  47.  China Continues To Laugh At Western “Green Energy” Foolishness, April 2, Manhatten Contrarian: https://wattsupwiththat.com/2022/04/03/china-continues-to-laugh-at-western-green-energy-foolishness/
  48. China’s Energy Dream, Patricia Adams, GWPF: https://www.thegwpf.org/content/uploads/2021/12/Adams-Chinas-Energy-Dream.pdf
  49.  Vaclav Klaus Book, “Blue Planet in Green Shackles”, published in English in 2007 by Competitive Enterprise Institute
  50. Saudi Arabia considers acceptance of Yuan for Oil payments, WSJ March 15, 2022: https://www.wsj.com/articles/saudi-arabia-considers-accepting-yuan-instead-of-dollars-for-chinese-oil-sales-11647351541

51. Germany’s Nuclear Surrender:

China’s Economic Influence in the World and Some Thoughts on the need to Reshore American Manufacturing

If America Was the Arsenal of Democracy for the Allies in WWII, Then What to Think of The Rise of China?

I voted for and support President Trump for reelection in 2020 because, I see him as the first President in recent years to recognize and act on reversing the De-Industrialization of America. The graphic below shows the ranking of world manufacturers. This in itself is not troubling. However, as you read later in this document, the rise of China may not be done solely for Humanitarian purposes and to lift 1.5 billion chinese from poverty. The Chinese 100 year plan 1949-2049 serves the CCP First.

The Rise of China since 1950

The Chinese Flag and Statue in Front of The CCP School. From PBS News Hour Report 2019
From the You Tube Video Which Illustrates the Top 10 Car Producing Countries in the World. In 1950, China had Negligible Car Production

In 1950, China was not a significant manufacturer of automobiles when compared to other nations. I took screen shots of a you tube video presented by USCB which showed the changing world manufacturing of automobiles from 1950-2020. This video is on you tube.

Then, by the year 2000, China progressed to rank #8 manufacturing just short of 2 million vehicles per year and more than the UK.

China is admitted to the WTO (World Trade Organization) in 2001 and China welcomes western Industry to setup manufacturing facilities in China.  Yes, we gave much of our manufacturing expertise to China, but what they were not given, they took. The automobile production which is mostly for Chinese consumption, is an index of economic growth and increased demand for steel, aluminum, copper and other materials. 

The astounding production year 2016 is shown below and still increasing. China is now building more than 2X the number of motor vehicles than we do in America. 

By 2016, China has Progressed to Ranking the #1 Car Manufacturer in the World

Some may say, “so what?”  They have 1.5 Billion people in China and they need a lot of cars.  This is true. Yes, they do need a lot of cars, but let’s take a look at China’s Published Grand Strategy:

Well, the supply chain for building motor vehicles is much the same as for military equipment. 

Remember recent history of America in WWII when FDR referred to us as the “Arsenal of Democracy” Steel, aluminum, copper, electronics, ships, planes, tanks, guns, etc.

 Below is the World Steel Association report from 2018 steel production. (World Steel Association: https://www.worldsteel.org/steel-by-topic/statistics/World-Steel-in-Figures.html)

I have seen these numbers, at least the percentages, in other articles and magazines. Fact: China produces over 50% of the World’s steel and Aluminum. 

On aluminum, in 2016 I was preparing for a talk and copied the aluminum production from the Aluminum Institute web site. This talk text is included on this Blog in 2016. References for World Aluminum Production are on the web at: (https://alucycle.world-aluminium.org/public-access/) Today they have updated the site to show a Sankey Diagram of aluminum flows by country and including recycling. 2018 data, International Aluminum Institute diagram is copied immediately below: 

The Largest World Producer of Aluminum is China. This from the International Aluminum Institute

The photo credit on the aluminum ingots on the dock is from the Wall Street Journal which wrote quite a bit about how China was taking over the world aluminum production in 2016. It began about 2002 from the chart above (no longer on the IAI website)

This was of particular interest to me because I did a great deal of work for ALCOA, all around the world, every year from 1977 to about 2012. I saw first hand how their business was shrinking from many plants all over the world and in 2006, about 125,000 employees, now drastically downsized. Thanks to China dumping of metal ingots on the world market.

Usually, I write about energy and electric power generation. That was my career for 50+ years. The observation I made during those years of world travel was that economic prosperity and energy use usually parallel each other. That is, it takes a lot of energy to create manufacturing  jobs and to produce primary metals. China after entering the WTO then began building new power plants at an incredible pace. They built more coal fueled power generation capacity in twenty years than America did in the preceding 100 years. This is not an exaggeration. The coal consumption data as compiled by the EIA (U.S. Department of Energy, Energy Information Administration) is copied below. China uses about 5X America’s coal consumption for electric power generation.

China’s “Belt and Roads Initiative” is worldwide. It includes gaining control of ports and natural resources all over the world, including Africa and South America. I personally was involved with a meeting with a law firm in West Virginia in 2008 and China was attempting to purchase WVA metalurgical coal mine. As you will see below, they have secured a foothold in American Real-Estate in the Mariana Islands.

Coal Consumption for Electric Power Generation by China. From the US-Dept. of Energy, EIA

Not only does China consume a lot of coal for power generation, but they have exported their coal plants at extremely cheap prices to other countries of the world. This improves their manufacturing economy, employs millions of workers at home and expands their reach. It also works toward the economic harm of America (and all western countries) through unfair competition.

New Coal Power Generation Plant Being Built in Dubai, Hassyan Plant

Here is one example of a coal plant being built in Dubai with a joint venture of Chinese investments and UAE. Link: https://www.nsenergybusiness.com/projects/hassyan-coal-fired-power-plant-dubai/

China is exporting their power generation equipment with components manufactured in China, all over the world. America once did this through USAID. 

Below is from a lecture by a retired General who had personal experience in command of Pacific Defense installations.

So, what is the economic activity that China is engaged in, in the South China Sea and Western Pacific?

Bloomberg News of Casino built in Saipan by China: https://www.bloomberg.com/news/features/2018-02-15/a-chinese-company-has-conquered-a-piece-of-america

Some would say, so, China built a Casino on American soil in Saipan. So what? Also in the news if you dig deeply, is reference to China building military bases on manmade islands in the South China Sea and Pacific.  Here are some satelite photos:

Energy and Economic Prosperity are inter-related. The World uses about 100 million barrels of oil per day. Much of this oil is transported to Asia through the Straits of Malacca.

So, if I get back to the matters of manufacturing, energy and economic prosperity, then a picture can be drawn of the rise of Chinese influence and control and the reduction of American influence and control. The economic piece of the aggression is ceding of the western Free World’s Manufacturing might to China. In doing so, it provides a revenue stream to fund their military buildup. One estimate of the projected military resources in 2025 is shown below. The red images of planes, missles, ships, submarines are China’s. The blue represent America’s. 

In my opinion, the return of manufacturing to the U.S.A. is important. Remaining energy independent is important. Keeping America’s military strong to continue Ronald Reagan’s legacy of “Peace through Strength is important. 

Additionally, protecting America’s Intellectual Property and securing the R&D of  American Universities and Industry is important.

It is not only steel and aluminum that China has exceeded all other world manufacturers. It is also Pharmaceuticals as we learned during the recent Pandemic. It is also Rare earth minerals and electronics as used in modern electronic devices. Manufacturing by U.S.A. companies also funds R&D which is then owned by the inventing company. If manufacturing is lost in America much of the funding for higher education as well as R&D will be compromised.

All of these and more require a President to place America’s priorities FIRST. These are some of the reasons why I voted for President Trump and a Straight Republican Ballot.

Let me close by asking before you vote, please do research on the inter-relationships of the importance of being energy independent, economic prosperity, fair trade and improving K-12 as well as Trade and College education within our borders.

Dick Storm

November 1, 2020

Additional References:

  1. Brian T. Kennedy, President of American Strategy Group, “Facing Up to the China Threat”, https://imprimis.hillsdale.edu/facing-china-threat/
  2. German News on 40 years of China’s Rise in Economic Power: https://www.youtube.com/watch?v=1SBnK9XIlZE
  3. PBS Hour Power and Prosperity Nov 2019: https://www.youtube.com/watch?v=JovtmKFxi3c
  4. Bloomberg News of Casino built in Saipan by China: https://www.bloomberg.com/news/features/2018-02-15/a-chinese-company-has-conquered-a-piece-of-america
  5. Dubai Coal Power Plant being built by China joint venture: https://www.nsenergybusiness.com/projects/hassyan-coal-fired-power-plant-dubai/
  6. Vehicle Manufacturing 1950-2018 You Tube: https://www.youtube.com/watch?v=kZCeuTzc850
  7. World Steel Association report from 2018 steel production. (World Steel Association: https://www.worldsteel.org/steel-by-topic/statistics/World-Steel-in-Figures.html)
  8. International Aluminum Institute:  web site. https://alucycle.world-aluminium.org/public-access/
  9. Dick Storm’s Blog, “The Importance of Energy to Economic Prosperity” https://dickstormprobizblog.wordpress.com/2020/09/21/part-4-the-importance-of-energy-to-economic-prosperity/