Background: Bulk Power Supply in the S.C. Lowcountry
The wholesale (Bulk Power) electricity providers serving our region are Santee-Cooper (officially the South Carolina Public Service Authority, or SCPSA) and Dominion Energy (which replaced South Carolina Electric & Gas as the Investor-Owned Utility). Most of Palmetto Electric’s Bulk Power comes from Santee-Cooper.
Santee-Cooper is a state-owned agency operating since the 1930s. Its first electricity was generated in 1941 from the Jefferies hydroelectric dam at Moncks Corner. Today, SCPSA’s hydroelectric plants still operate with a combined capacity of 142 MW.
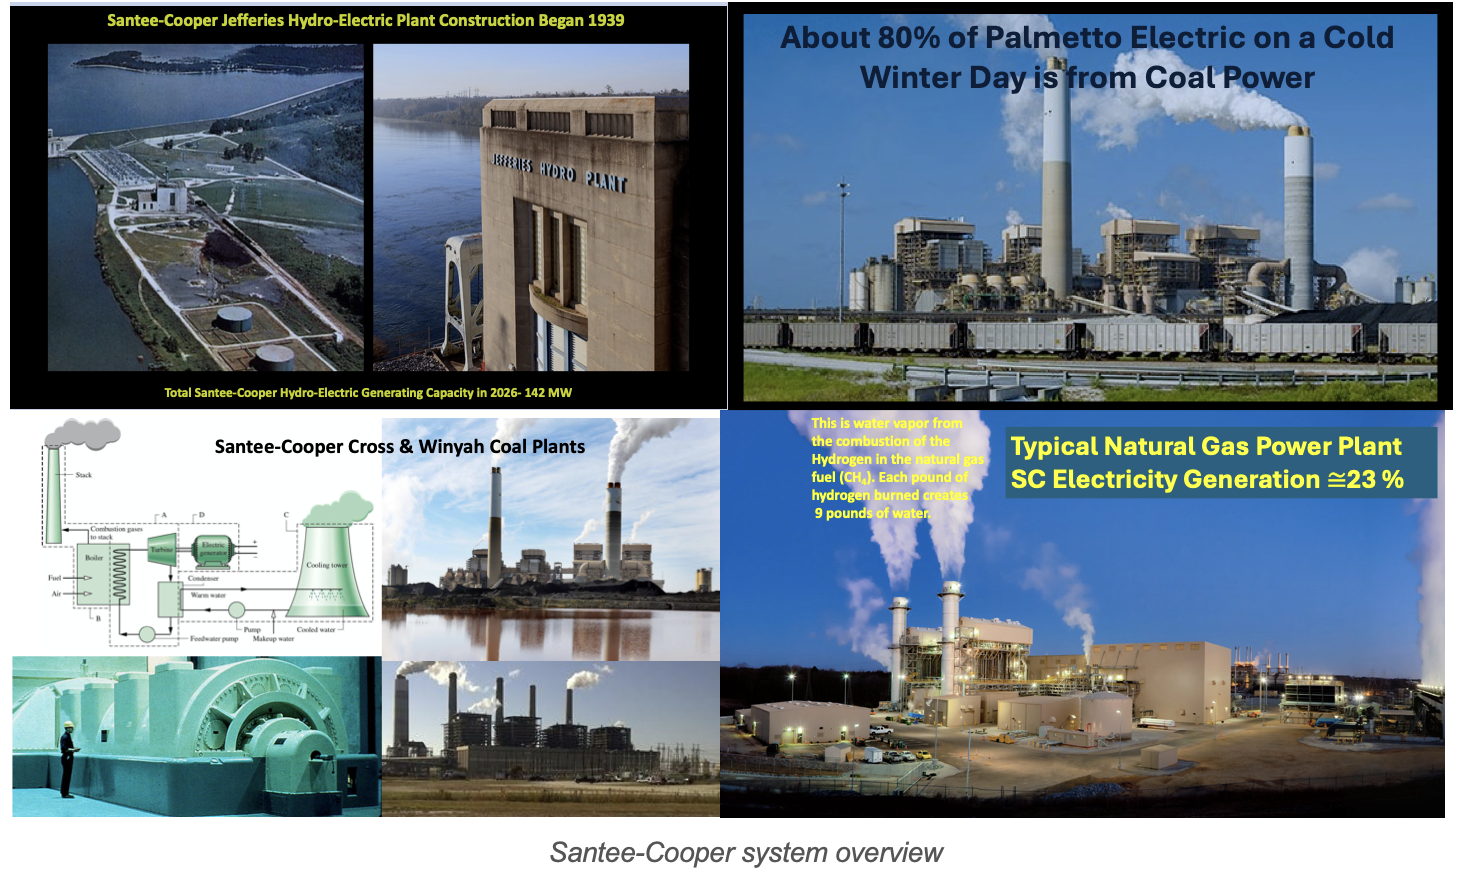
Since 1941, population growth, industrial expansion, and regional electrification have driven steadily increasing electricity demand. During peak-load periods, SCPSA now generates up to approximately 5,000 MW. Over more than 80 years, coal has been the primary energy source, keeping production costs at or below the U.S. average—a commendable achievement.
This low-cost electricity attracted energy-intensive industries, most notably NUCOR Steel and Century Aluminum. Affordable coal-fired power was the decisive factor in locating these facilities in South Carolina. This has benefited heavy industry and all citizens of the region, including our area around Bluffton and Hilton Head Island.
How South Carolina Uses Its Electricity
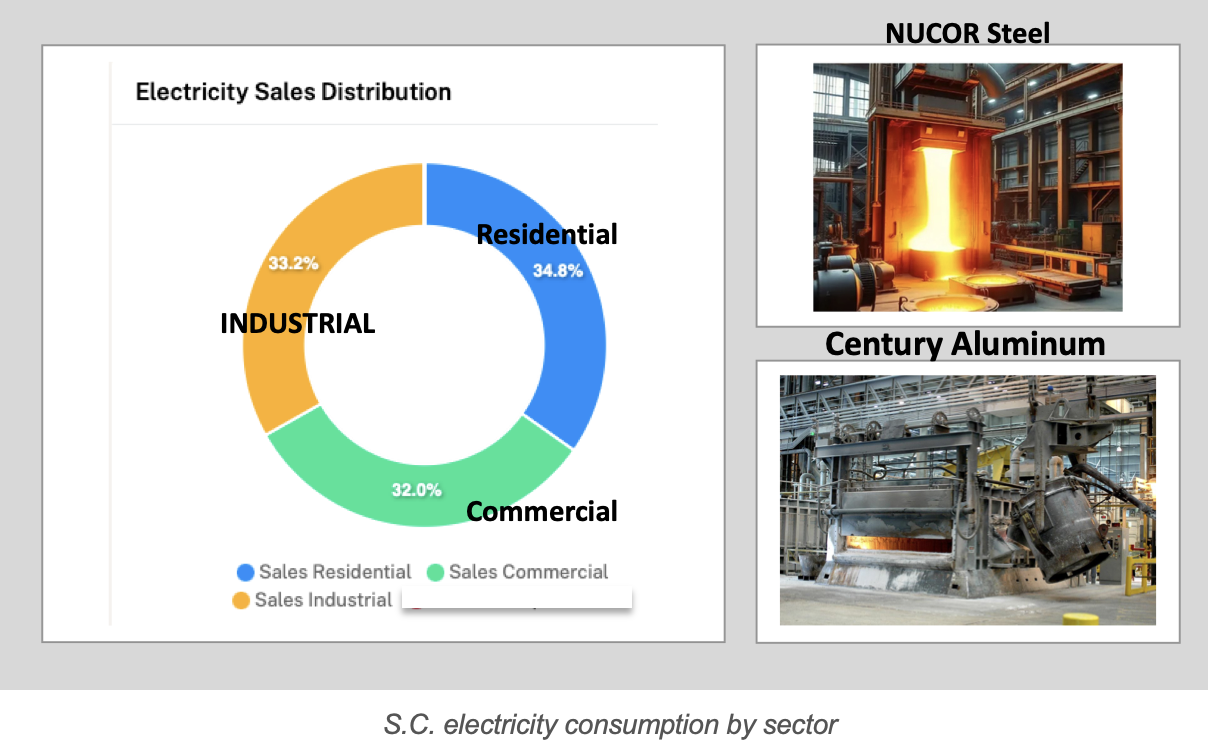
Industrial, Residential, and Commercial customers each consume approximately one-third of total S.C. electricity generation. NUCOR, Century Aluminum, and other industrial customers consume about a third of all electricity generated by S.C. utilities.
The Scale of Industrial Energy Demand
Aluminum and steel production are extremely energy-intensive. It takes approximately 6 kWh of electricity to produce just one pound of aluminum from aluminum oxide powder—and that is only to create raw ingots, not including the energy to refine bauxite ore or form finished products.
At full production, NUCOR and Century Aluminum together consume more Bulk Power on a given day than the entire island of Hilton Head uses during its highest winter peak-load demand day.
Affordable electricity supports economic prosperity, employment, and national security—in addition to keeping our homes heated and cooled.
Coal-Fired Generating Stations in The Low Country of S.C.
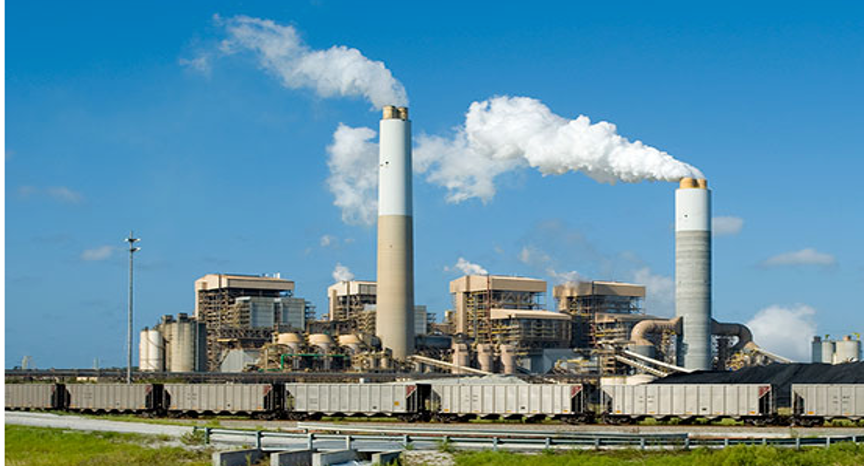
The Cross Generating Station, located about 100 miles north of Hilton Head Island, has four units built between 1983 and 2009 with a combined capacity of approximately 2,390 MW. All four units are equipped with stack-cleaning equipment; the visible stack plume is harmless water vapor.
Winter Storm Fern Proved the Importance of Coal-Fueled Electricity Generation
Cross and Winyah coal plants provided over 80% of the electricity consumed in the S.C. Lowcountry during the Winter Storm Fern peak demand period (January 26 – February 4, 2026). Natural gas and solar generation are also shown in the chart below. Not shown: the 322 MW of nuclear generation from Santee-Cooper’s one-third share of V.C. Summer Nuclear Plant.

The chart above is the actual “Bulk Power Supply” as generated by SCPSA, which provides the wholesale power to Palmetto Electric. Note that over 80% is from coal generation. Also, note the small contribution of solar. Not shown is the 322 MW of nuclear generation from Dominion Energy.
The Net Zero Carbon Mandate and Rising Costs
The least-cost fuels for electricity generation are coal and nuclear. However, SCPSA and other S.C. utilities have been ordered by the S.C. Legislature to transition away from coal toward Net Zero Carbon. The path ahead is described in the Santee-Cooper Integrated Resource Plan (IRP).
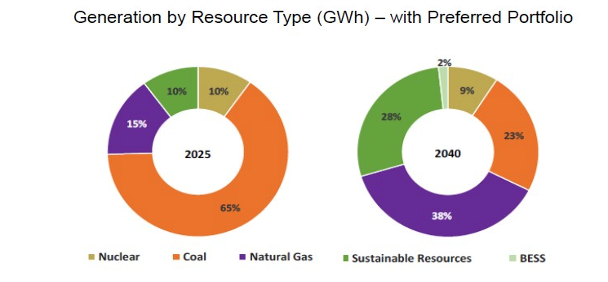
As can be seen on the portfolio transition, the plan is to reduce coal from over 55% to about 23% by 2040.
The S.C. Legislation to Increase Electricity Costs
South Carolina law (S.C. Code Ann. §58-37-40) directs the retirement of coal-fired generation:
S.C. General Assembly — H.3194 (Session 124, 2021–2022)
Santee-Cooper’s analysis demonstrated that the Net Zero CO₂ by 2050 portfolio would be higher in costs and involve more risk for customers than the Economically Optimized Portfolio. Several supplemental analyses were performed reflecting the retirement of the Winyah generating station by end of 2028 or 2030.
This is the fundamental reason electricity costs will rise in the years ahead. The transition from reliable, affordable coal generation is a transition to higher-cost production. This is not a forecast—it is fact, based on the experience of countries and U.S. states already further along in the Net Zero transition.
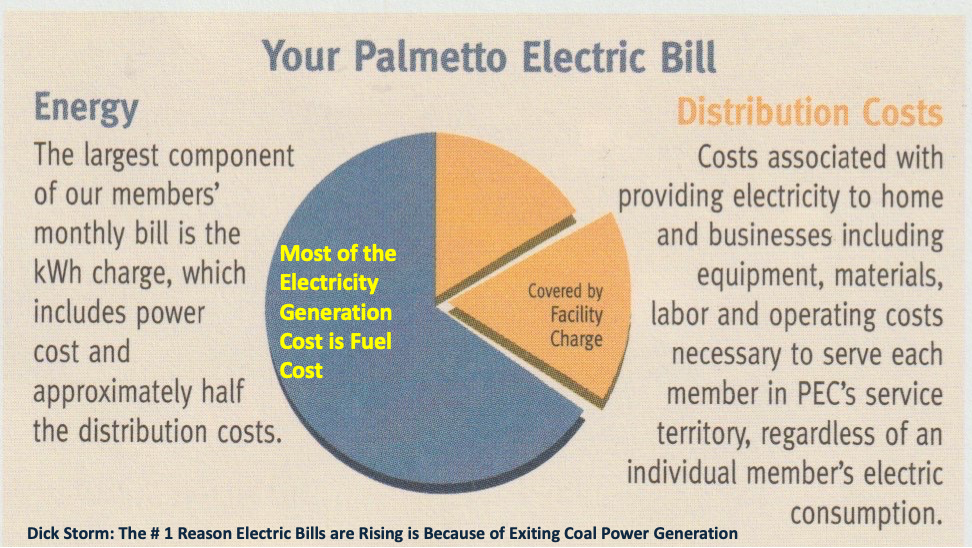
Understanding Your Electric Bill
The major component of electricity production cost is primary energy (fuel). When wholesale power costs rise, retail electric bills follow. For a Combined Cycle natural gas plant, fuel alone constitutes about 90% of production cost. If natural gas prices double, so does the cost of electricity. Coal is a low-cost, price-stable source of primary energy, benefiting all ratepayers.
Why Transitioning to Renewables Raises Electricity Costs
The Core Problem: Backup Power
When the sun is not shining and the wind is not blowing, power must be supplied immediately by backup generation. In the U.S., that backup has primarily been natural gas. In some cases—Hawaii and New England—diesel, kerosene, and jet fuel have been used when other sources were unavailable.
Electricity must be generated the instant it is needed. Wind and sunshine may be free, but backup power is not. The charts below show world generation by fuel. Note the coal consumption of Asia compared to the U.S.
This shows the absurdity of the path to Net-Zero Carbon when the entire world coal consumption is considered. If America’s coal consumption went to zero, it would barely make a difference in total CO2 emissions.
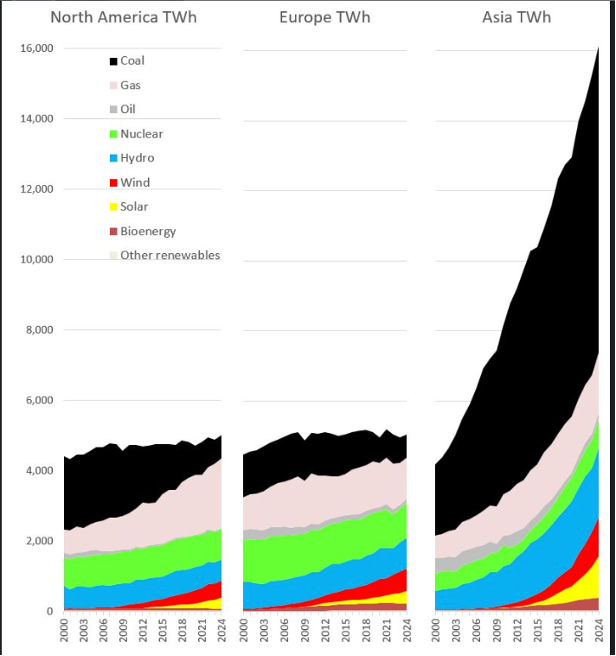
Credit for the chart above goes to Mr. Mike Caravaggio who prepared and posted on LinkedIn.
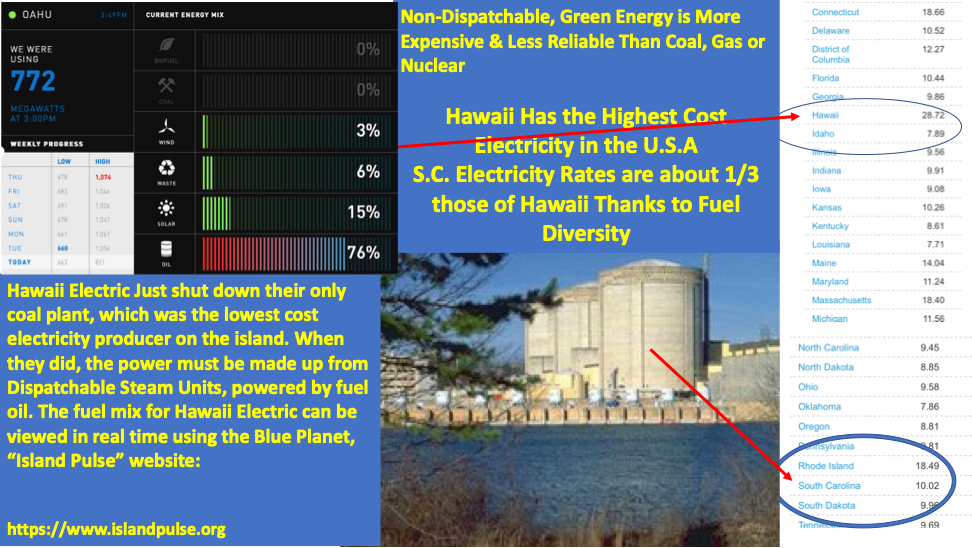
Case Study: Hawaii — An Energy Island
Hawaii is not connected to the mainland grid, making it a telling example. In 2021, 76% of its generation fuel was diesel. Hawaii once had a 180 MW coal plant that produced its lowest-cost electricity—even with imported coal. After transitioning to renewables, diesel backup became dominant when the sun set or wind dropped. Because diesel is among the most expensive generation fuels, Hawaii now has the highest electricity rates of all 50 states.
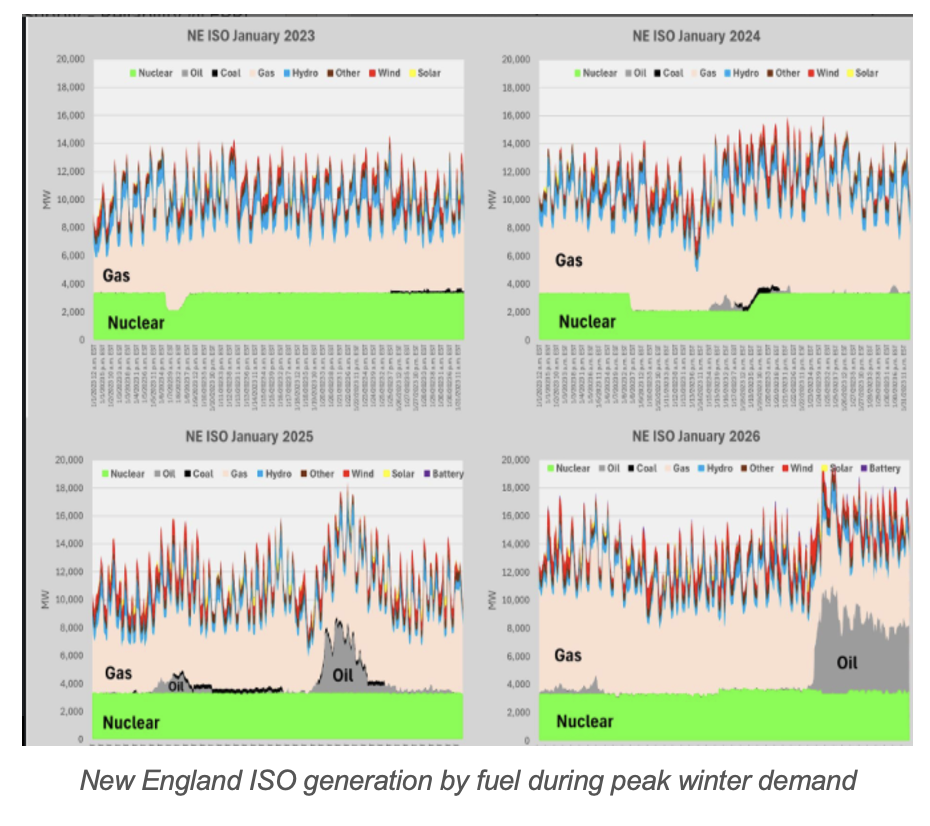
Case Study: New England
States that have retired coal plants have experienced sharply escalating costs, including California, Massachusetts, New Hampshire, Rhode Island, Connecticut, Vermont, and Maine. During Winter Storm Fern, New England generated roughly one-third of its electricity from diesel for several days. Their plan to import Canadian hydropower failed when Canada needed its own capacity during extreme cold.
Electricity Costs by State
The pattern is clear: states with the least coal power tend to have the highest electricity costs.
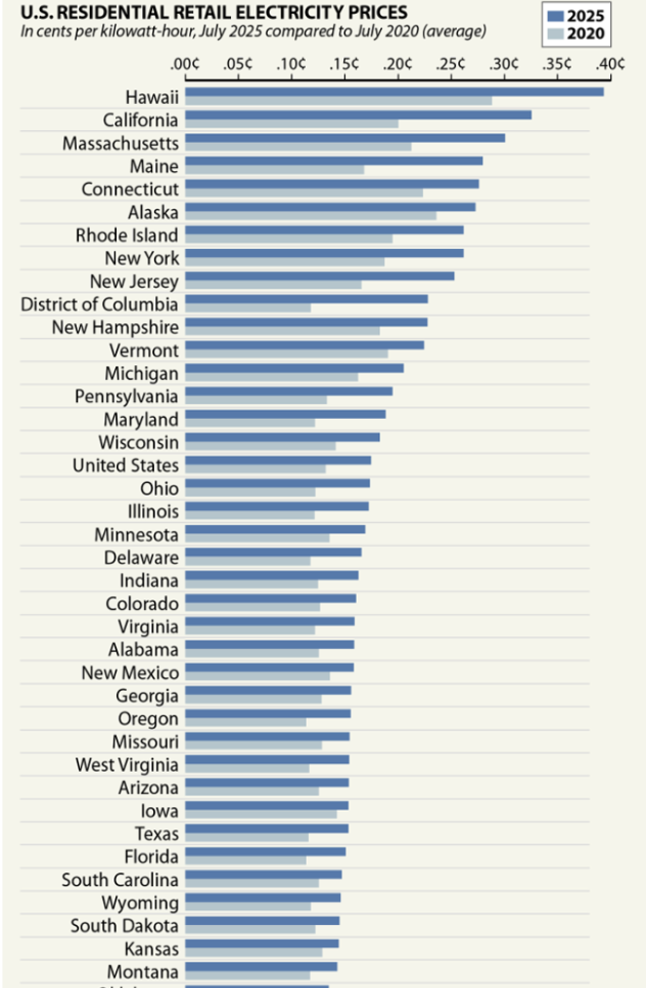
The state of Tennessee for some reason was not included in the chart above. TN does in fact have some of the lowest electricity costs in the U.S. according to: https://findenergy.com/tn/ The low cost is attributed to a lot of old hydroelectric power, considerable nuclear and a still large coal fleet. TN average electricity cost is about $0.129/kWh.
Case Study: Germany
Germany began its coal transition in 2011 under the Energiewende policy. Once Europe’s strongest manufacturer, Germany has experienced de-industrialization driven by skyrocketing electricity costs—now approximately $0.33/kWh, even higher than Hawaii.
Dr. Lars Schernikau is an energy expert and knows a lot about European energy policies, including Germany. Here is a quote from Dr. Schernikau in the Engineering News:
Schernikau was bluntly pessimistic about the true financial viability of wind and solar energy on a grid scale.
“There is no way you can make honest money with wind and solar. It’s not possible. When I say honest money, I mean without somebody else’s money, because you are living off somebody’s subsidies, which is paid by taxpayers,” he said.
He illustrated this by pointing to the economic problems with high solarpenetration in markets such as Germany, where an oversupply of solar energy has led to a significant drop in prices. In May, for example, the price of solar energy in Germany fell by 50%, reducing the earnings of solar producers. Negative power price days are at an all time high in Germany and other countries, Schernikau pointed out.
The impact of high electricity costs on households was another area of concern. Schernikau cited a March report from the German government auditor Bundesnetzagentur, which revealed that energy poverty in Germany had risen to 25%, meaning one in four households is now classified as energy poor.
So, I would ask. Why is South Carolina following the same Net Zero path of Germany?
Natural Gas for Electric Power Generation
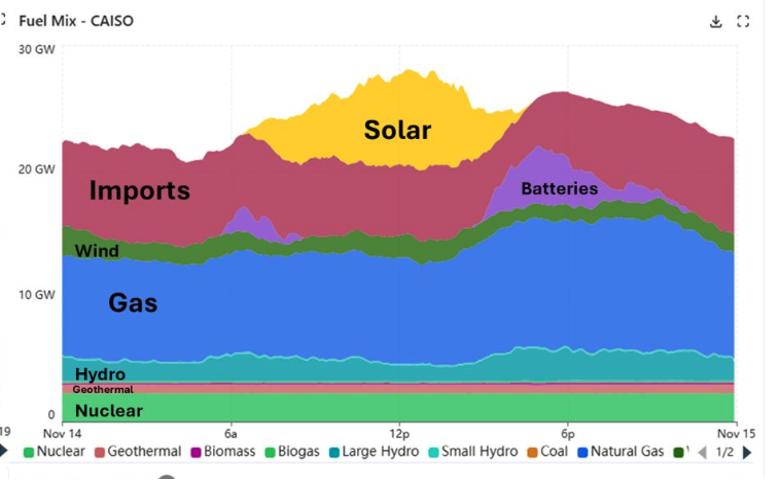
Intermittent sources like solar and wind must be backed up by dispatchable generation—gas turbines or reciprocating engines (RICE). The chart below shows a typical daily generation profile in California. Solar (yellow) is strong for about six hours; as the sun sets, Dispatchable power must ramp up sharply.
Here is the generation by fuel for the lower 48 states for the first 24 days of January 2026. Thanks again to Mike Caravaggio from EPRI for posting this on LinkedIn.
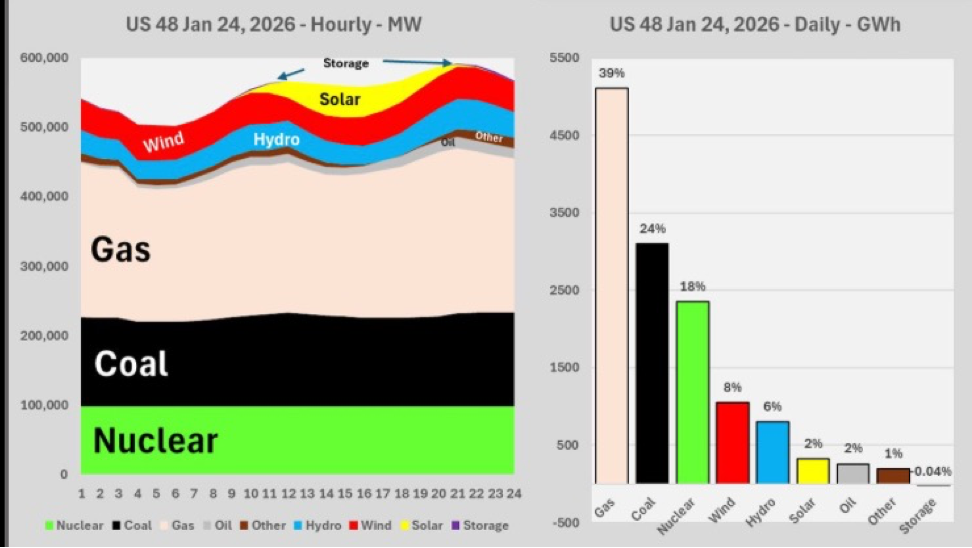
A reliable Grid should have a balanced generation portfolio. In my experience, 85% Dispatchable or Base load generation works well and has been proven.
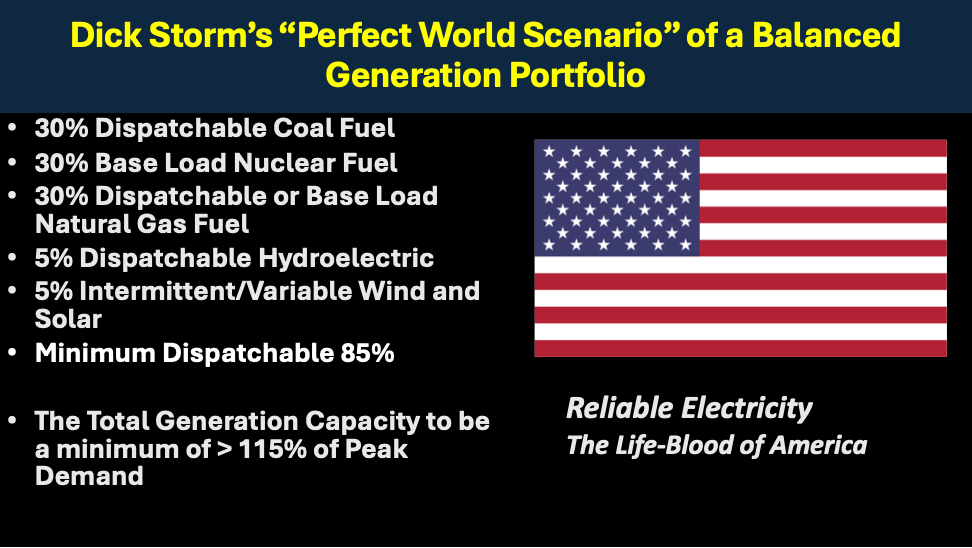
A balanced generation portfolio works best with at least 85% dispatchable power generation capacity.
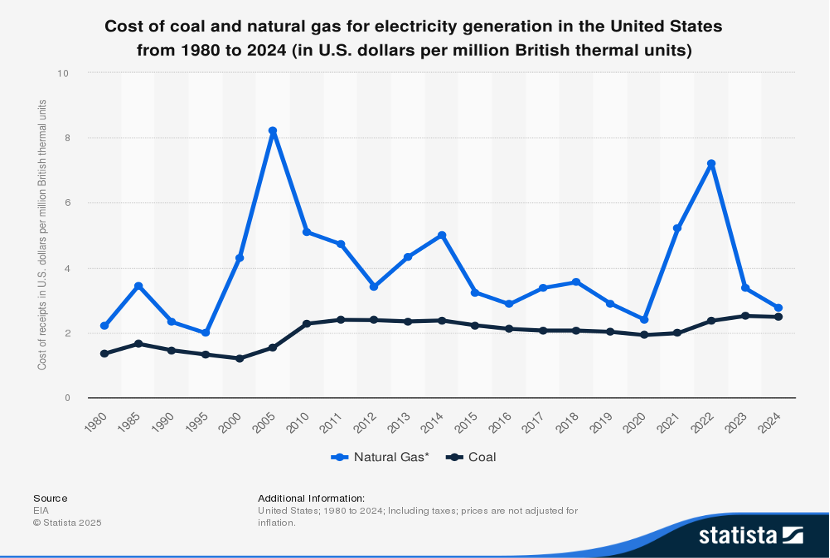
Fuel Price Stability: Coal vs. Natural Gas
Natural gas prices are volatile, especially during winter when home heating competes with power generation for pipeline capacity.
A key point on the generation of electricity: The fuel cost is the single largest component of the operating dollar for the production of electricity. So, if much solar and wind is installed, then it must be backed up with Dispatchable electricity generation. Usually in the U.S., that fuel for Dispatchable, backup power is natural gas. As can be seen from the examples of New England, California, Hawaii, Germany and the UK, the cost of that backup fuel matters when retail electricity prices are compared.
The chart below compares natural gas prices (blue) with coal prices (black) since 1980.
Conclusions
- Coal provides the fuel to generate reliable electricity at amongst the lowest cost in the world. This is based on actual results and actual rates, not on economic models or expert opinions.
- Modern coal plants like Cross are clean; their ash is recycled for cement and sheetrock manufacture.
- Nuclear is excellent but new construction takes a decade and costs tens of billions (Vogtle 3 & 4: 10 years, $30+ billion).
- Natural gas already provides ~43% of U.S. electricity (2025)—a high share for a pipeline-delivered fuel. Coal plants balance price volatility and store weeks of fuel on-site, an intrinsic grid security advantage.
- The author recommends the S.C. Legislature repeal the Net Zero Carbon law and allow SCPSA and AI Data Center developers to pursue new coal-fueled generation
Part 2 will follow and show some more reasons why wind and solar although using “Free” fuel, cost more.
Respectfully and very truly yours,
Dick Storm, March 11, 2026
