FREEDOM IS NOT FREE, NEITHER WILL NET ZERO CARBON BE FREE

Reducing Reliability and Increasing Prices of Our Energy Supply

Introduction

Vaclav Klaus was the President of the Czech Republic in 2003. I have a copy of his book, “Blue Planet in Green Shackles” with the sub-title, “What is Endangered: Climate or Freedom”

As I was straightening up my book case, I found this interesting insight from nearly 20 years ago. I started paging through the book and one quote by Klaus caught my attention.  “As someone who lived under communism for most of my life, I feel obliged to say that the biggest threat to freedom, democracy, the market economy and prosperity at the beginning of the 21st century is not communism or its various softer variants. Communism was replaced by the threat of ambitious environmentalism.”

Klaus’ book reminded me of my friend Tom’s experience as a Charlotte, NC,  City Ambassador during the 2008 Democrat Party Presidential Convention. Tom, like me was also employed in the energy industry for many decades. So, when energy issues were discussed, his antenna went up.  He heard influential leaders of the Democrat Party strategizing on how to wage the war on coal. Their reasoning was, If they could craft policies to increase coal generated electricity prices, then solar and wind power will become competitive.  Obviously, President Obama won that election and the war on carbon accelerated during his eight years.

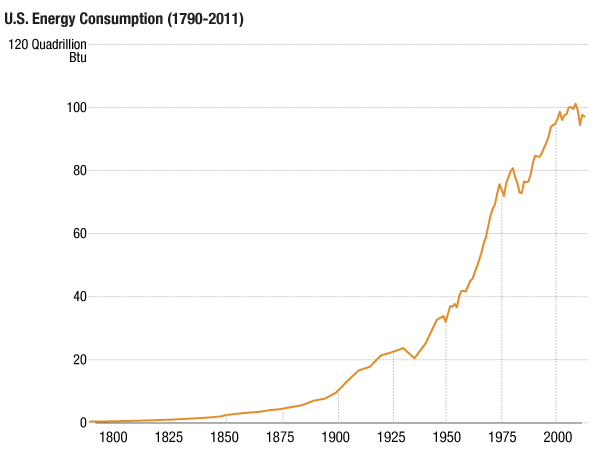
These two examples of green policy intentions on two continents are the inspiration for this article. My last post was a reminder that in America we depend on (including the Btu equivalent of renewable generated electricity) about 100 Quadrillion Btu’s each year to fuel our economy. Over 85% of that energy is used in heat engines. So called, because steam turbines, reciprocating gasoline or Diesel internal combustion engines, jet engines and stationary gas turbine generators are all Heat-Engines. Heat-Engines convert the chemical (or nuclear) energy of fuel to heat that is then applied as shaft horsepower, motive force or jet thrust for producing electricity, transportation or industrial production. 

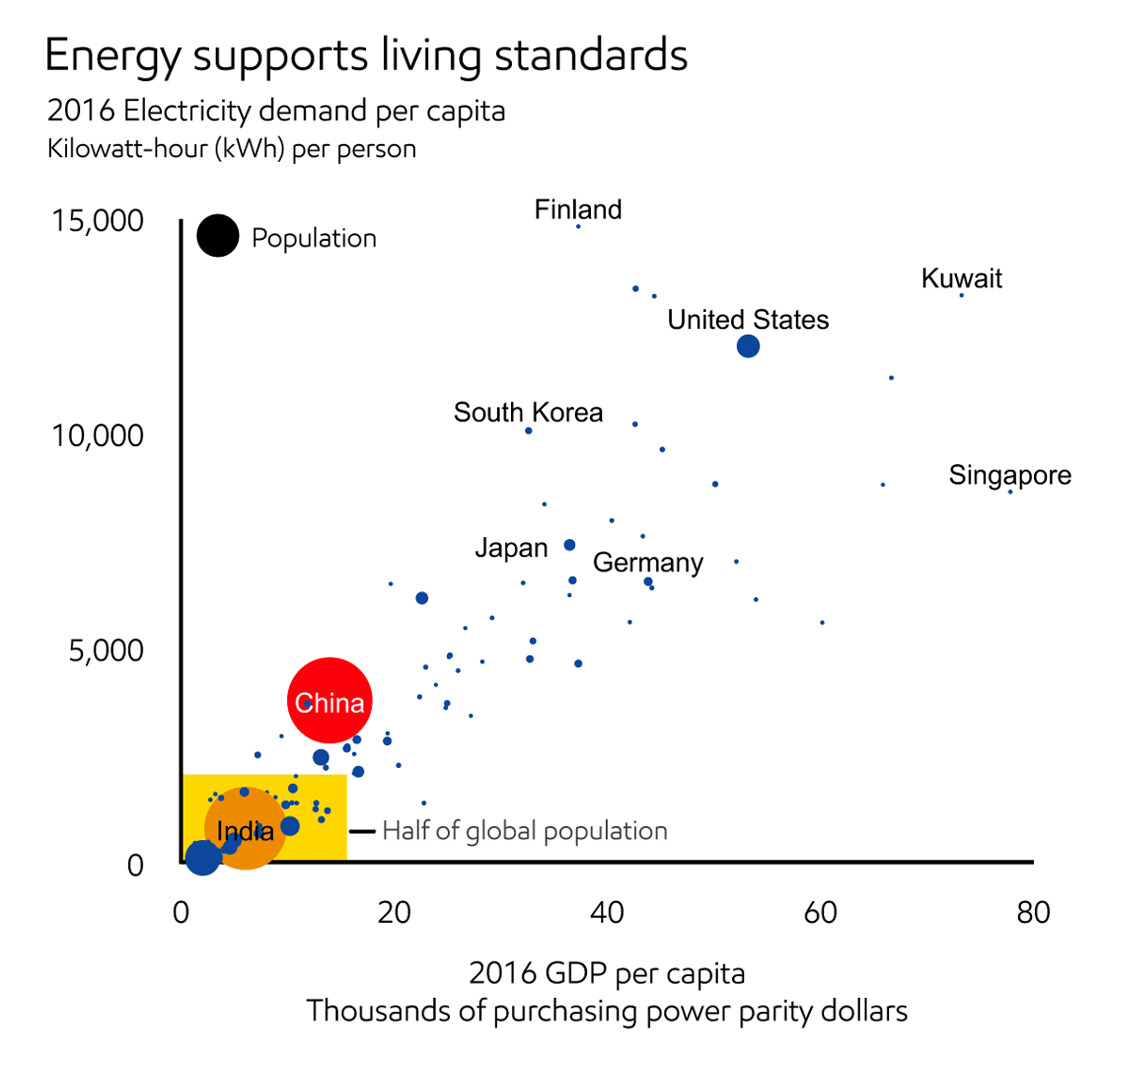
Reasonable cost and reliable energy are important for us to continue our high standard of living.

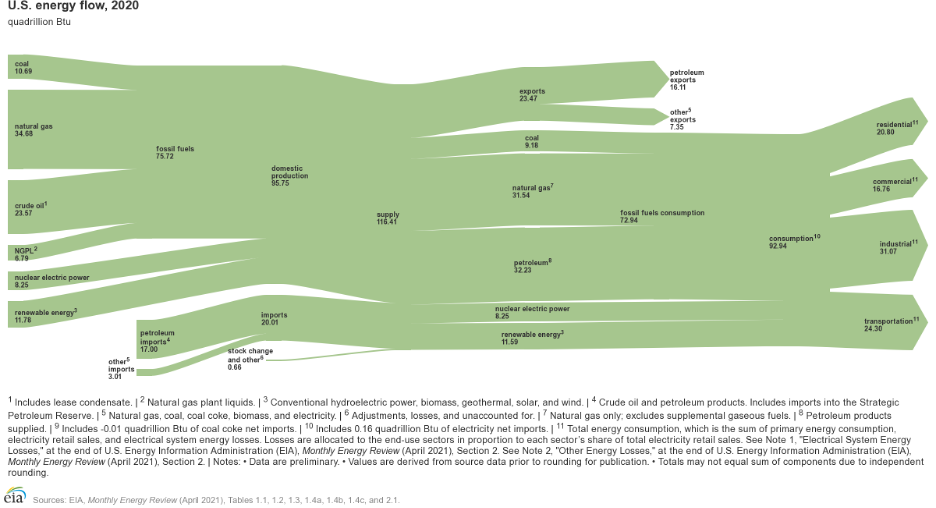
Below is the Lawrence Livermore Laboratory Sankey Diagram which shows the energy flows from 2019. This was a more normal year of economic activity. The total energy used was right at 100.2 Quadrillion Btu’s. If you study the energy flows, you can verify the conclusion that most of our energy is used in heat engines. Heat engines such as; steam turbines which are used to generate electricity from coal, natural gas, nuclear, geothermal, biomass and petroleum. Gas turbines that are used for stationary power generation, ship propulsion, turbo-prop aircraft propulsion. Diesel engines for trucks, buses, farm tractors, railroad locomotives and backup electric power generation, jet aircraft engines, gasoline for automobiles and trucks.

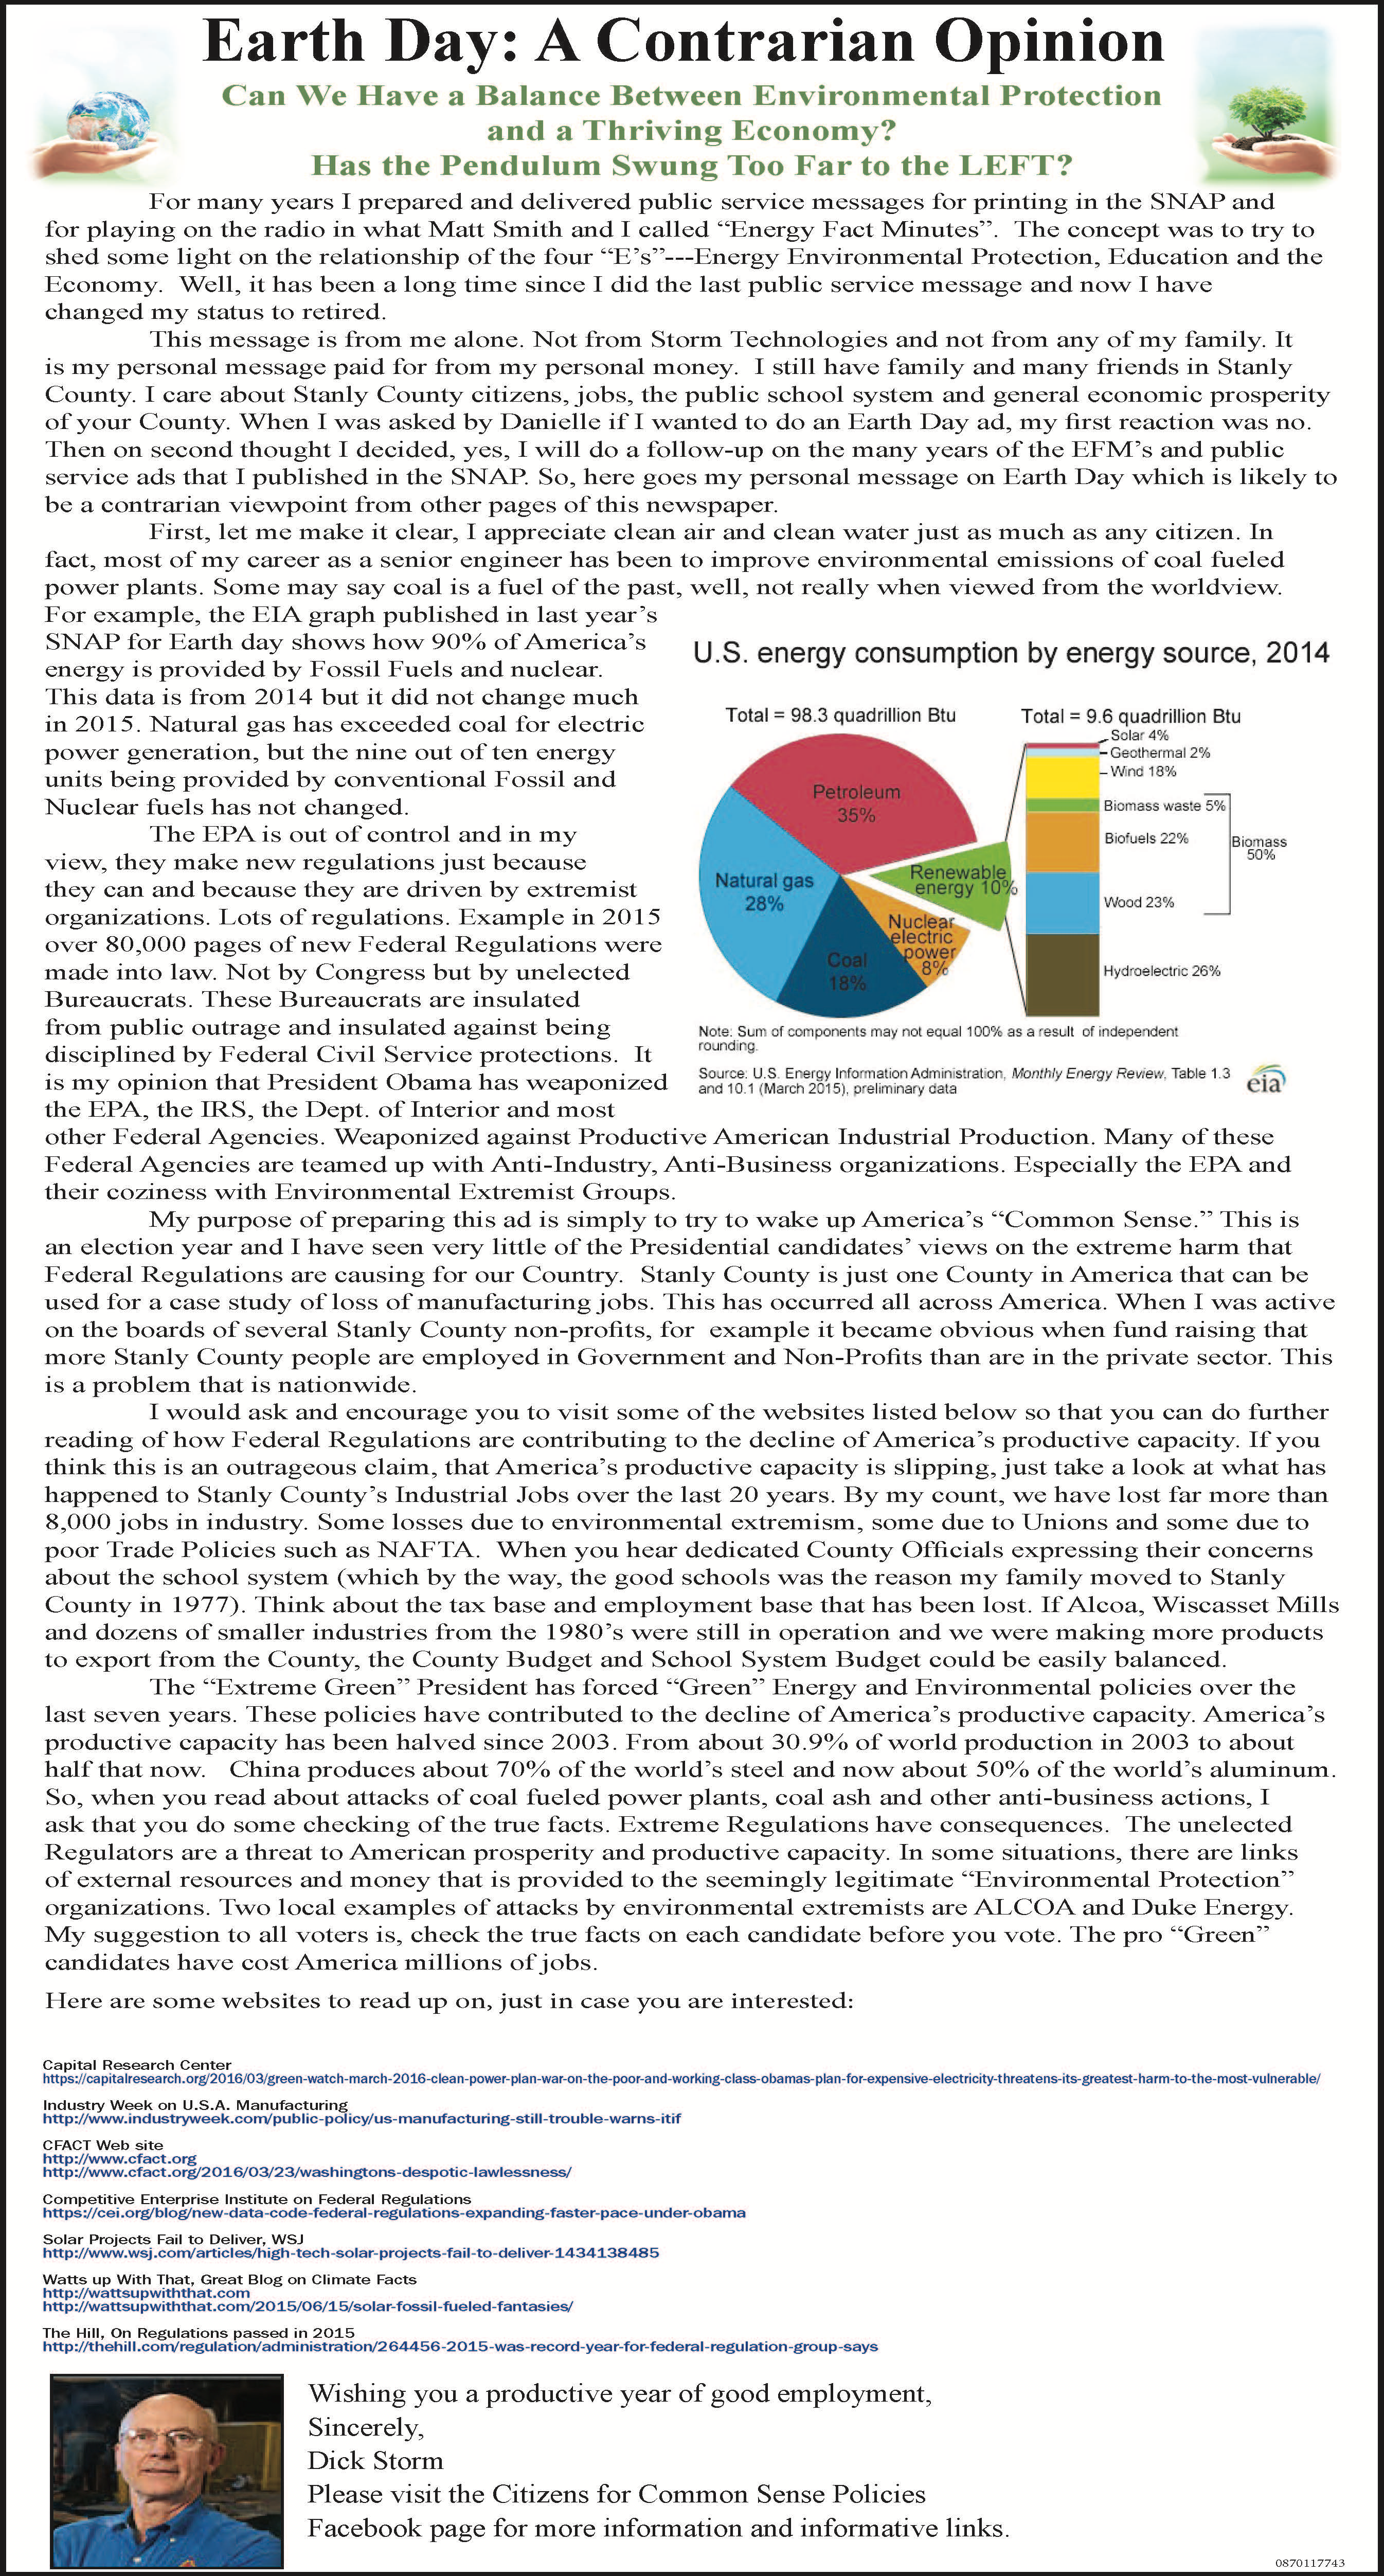
You get the point I am trying to make. To power our high quality of living, we use about 100 Quadrillion Btu’s equivalent of energy. American citizens take energy for granted and many, especially the current Congress and President assume that the existing forms of energy can be substituted in the next 15 years with Renewable forms of energy such as windmills, solar panels and Hydrogen. This is the path our elected officials have us on. So, let me ask you to check the chart below and then visualize replacing the nuclear (8.5%), natural gas (32%), coal (11.4%) and petroleum (37%) with Renewables.  The total of these four sources of energy is 88.66 Quadrillion Btu’s or right at 89% of our total energy used each year. Note solar and wind was 1.04 and 2.74 Quadrillion Btu’s, totaling 3.78 Quadrillion Btu’s. Right at 3.8%.

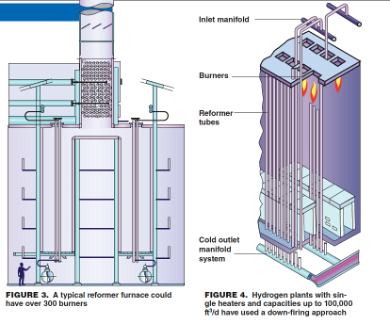
Hydrogen is a medium that can be used for storage and is therefore zero on the chart below. Hydrogen is planned to be a large part of America’s future fuels, but it should be pointed out, hydrogen requires more energy to produce it by electrolysis than it will produce in a fuel cell or by combustion in an internal combustion engine.

Current Energy Costs for Various Fuels

I have never liked the word “Cheap” and try not to use it. However, when referring to fuel to produce power or motive force, cheaper energy is better. Example, electricity  produced by a gas turbine requires Capital cost to purchase the equipment, construction cost to build the power plant, employees to operate and maintain the plant and spare parts to keep the turbine and all of its auxiliary equipment in top condition. Would you be surprised if I said a gas turbine, combined cycle power plant of say, 600 MW may cost about $ 720 million dollars? The going cost today for a GTCC plant is about $1,200/kW installed capacity. Now, think about the cost of electricity produced by the GTCC plant. It would likely be about $0.02 per kWh if the natural gas fuel was $3.00/million Btu (British Thermal Units). Over 90% of the production cost of a modern high efficiency GTCC plant is for fuel. The raw natural gas fuel is the single most expensive component of electricity production cost. Not the amortization of capital cost, or labor or spare parts. It is fuel cost that governs the production cost of electricity. So, if the natural gas price doubles, so does the production cost of electricity.

Thanks to Hydraulic Fracturing, the War on Coal has not caused a dramatic increase in the cost of electricity because natural gas prices have been very low since about 2012 or so. 

Here is a chart of natural gas prices 2006-2012 from EIA data of Henry Hub spot prices, as recorded by the EIA. The war on coal has been going on since the Bill Clinton Administration but accelerated during Obama’s Presidency. The lower cost coal plants equipped with flue gas cleaning Baghouses, Electrostatic Precipitators, Selective Catalytic Reactors and  Sulfur Scrubbers were the lowest cost generators. Then came Hydraulic Fracturing and cheap natural gas. The low production cost of electricity production by natural gas made competition by coal nearly impossible. Remember, fuel is 90% + of the electricity production cost for GTCC plants. Thus, cheap gas equals very reasonable cost electricity. America has had a good run of reasonable cost electricity up to now.

NATURAL GAS PRICES AT THE HENRY HUB 2006-2012

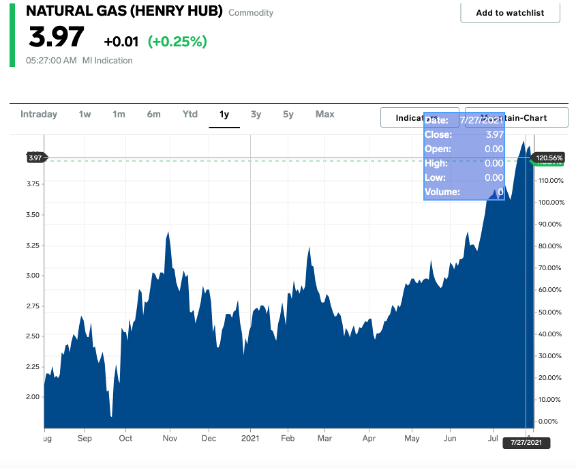
The current natural gas prices have increased from $2.00/million last year, to nearly double the price of 2012. Therefore, if this trend continues electricity prices will have to increase or electricity from lower cost producers, such as coal and nuclear will be needed to keep power costs down.

Here below is the natural gas price as reported by Business Insider Commodities.

The figure below illustrates production cost for the fuel component only when comparing a clean coal plant with a gas turbine combined cycle plant:

COMPARATIVE ELECTRICITY PRODUCTION COSTS BY NATURAL GAS AND COAL FUELS AT THE PLANT BUSBAR

When fuel cost per million Btu’s increases, so does production cost.  Hydrogen cost if you can find it (California prices)  is about  $142.23/million Btu’s as compared to the comparatively less expensive natural gas at $4.00/million Btu.

Typical Fuel Costs Today

The above is my attempt to explain the fundamental costs of Thermal Power Generation of electricity. Because coal plants have many other costs of flue gas cleaning reagents, more O&M personnel and more maintenance requirements of a solid fuel power plant, the fuel cost component for a typical coal plant is about 75% of production cost. Fuel is still the major cost component for electricity generation for gas, coal and oil fueled thermal power plants. 

Gasoline, Regular Octane at               $3.00/gallon   116,000 Btu’s/gal.       $25.86/million Btu’s

Diesel Fuel                                          $3.00/gallon   135,000 Btu’s/gallon  $22.22/million Btu’s

Jet Fuel Jet A   (IATA airline cost)       $1.93/gallon   119,000 Btu’s/gal.      $16.22/million Btu’s

Natural Gas at Henry Hub (July 27, 2021)                                                      $ 3.97/million Btu’s

Coal delivered at SC Power plant estimated                                                  $ 2.00/million Btu’s

The above shows traditional energy costs for “Heat-Engines”. There is a push by the Democrat’s in government to change to “Green Renewable Power”.  Autos, airplanes and trucks  cannot be run on windmills or solar. But, the technology to power these heat engines with Hydrogen is technically possible. The amount of power output is conversion of hydrogen into either electricity through the use of fuel cells or by combustion in an internal combustion engine. The cost to operate will be commensurate with the energy contained in a given unit of hydrogen, usually expressed as Btu’s. The equivalent cost of hydrogen is about $16.51 to replace a gallon of gasoline. Perhaps some day the cost of hydrogen will come down to compare with gasoline prices for a given energy output? 

CONCLUSION:

Net Zero Carbon will come at a very high cost and the high cost will harm our current Freedoms.

Dick Storm

August 5, 2021

References:

  1. Natural Gas Prices from Business Insider commodities: https://markets.businessinsider.com/commodities/natural-gas-price
  2. Storm Technologies Seminar information on economics of power generation.
  3. “Blue Planet in Green Shackles” by Vaclav Klaus Competitive Enterprise Institute, 2007
  4. IATA Jet Fuel Prices: https://www.iata.org/en/publications/economics/fuel-monitor/
  5. Chevron Aviation Jet Fuel specs: https://www.chevron.com/-/media/chevron/operations/documents/aviation-tech-review.pdf
  6. Coal Costs by EIA Coal Markets: https://www.eia.gov/coal/markets/
  7. California Hydrogen Fuel Council: https://cafcp.org/sites/default/files/Path-to-Hydrogen-Competitiveness_Full-Study-1.pdf
  8. Lawrence Livermore National Laboratory Sankey Diagram of Energy Flows: https://str.llnl.gov/content/pages/2021-02/pdf/02.02.2.pdf 

The Importance of Fossil Fuels and Why It Will Be Impossible to Eliminate them in My Grandchildren’s Lifetimes Without Harming Their Quality of Living and America’s Leadership in The World

Introduction

America, the rest of the Developed World and the Developing Countries of the World all depend on Fossil Fuels to power Industry, Quality of Life, Transportation and strong Economy’s. In fact more than 85% of the energy used today is used in “Heat-Engines”. Think about your life today and what you depend on. A car for transportation, air conditioning for summer comfort, Industrial production to provide jobs, economic strength and to continue to fuel our strong Economy, fuel for jet aircraft to shrink the world, Diesel fuel for trucks to deliver our food, Diesel fuel for shipping to transport products around the world. The largest slice of the energy production pie is provided by petroleum. Love them or hate them, the energy density of fossil fuels make them important to power our lives.

In America we use about 20 million barrels of oil each day. America has about 275 million cars and light trucks on the roads. This is peak vacation time in America, summer travel is brisk of people getting away to our favorite beach, mountain retreat or foreign destination. When we travel, we use energy. A lot of it. 

Some prominent Americans, the Main Stream Media, the President and elected officials in high office are promoting “Net Zero Carbon by 2050”.

In my opinion, this is wrong for America and impossible to achieve. I will attempt to simplify my reasoning of why fossil fuels are important and the fact that we cannot eliminate them in the next 30 years unless there are major new break-throughs in technology.

Where We Get Our Energy

Each year, America uses about 100 Quadrillion Btu’s of energy. The U.S. Department of Energy has kept track of our actual energy sources and consumption for decades. Each year a report is produced to show the previous years energy production and use. Since about the year 2006 America has used between 95 and 103 Quadrillion Btu’s each year. Here below are two charts which show the sources and uses for energy in the U.S.A. during 2020. Note that due to the Pandemic, energy use declined from 2019 to only about 98 Quadrillion Btu’s. This was due to reduced travel and economic production during 2020, because of Covid-19. Chart 1 below shows the sources of our energy and the consumption. Note that the optimistic Renewables in 2050 is about 17 Quadrillion Btu’s equivalent. The EIA converts energy from hydroelectric, solar and wind to equivalent energy in Btu’s. Each Btu is equivalent at 100% efficiency of conversion to 778 Foot Pounds of work. Thus, the BTU’s produced and used represent all forms of energy on the charts below.

Sources in 2050 of our energy. Forecast based on the EIA analyses.

  • 38 Quadrillion Btu’s Petroleum
  • 37 Quadrillion Btu’s Natural Gas
  • 17 Quadrillionn Btu’s Renewable Energy
  • 7   Quadrillion Btu’s Nuclear energy
  • 3   Quadrillion Btu’s Hydro-electric
  • 3   Quadrillion Btu’s Biofuels

Total 105 Quadrillion Btu’s projected to be utilized in 2050 (5)

In my opinion, that number is low because our population is growing and I suspect that in order to provide the same quality of life in 2050 as we enjoy now, with a population expected to grow to 390(6) million in 2050, will require more than 105 Quadrillion Btu’s if we continue our high quality of lives.

Let’s discuss Electric Vehicles. Today there are about 276 million cars and light trucks on the road (7). Most are fueled by gasoline or diesel fuel which is provided by over 100,000 conveniently located service stations for refueling. If these are switched to being powered by electric, then the electric power demand will be much larger than 37% of our total energy production. 

The electricity production chart below shows current and future trends for electricity production. If the auto manufacturers stop producing cars powered by internal combustion engines, then to preserve our current freedom to travel, the same total energy will be required for a given prosperous population. Thus, driving similar miles per year will require that electricity be produced in proportion to the fleet of EV’s. Study the chart below. In 2050 the projections are for 42% of our electricity to be generated from Renewables. The other 58% then is projected to be generated from traditional sources, natural gas, nuclear and coal. We should keep in mind that the population is expected to increase by about 18% by 2050.

Conclusion:

If we continue our high quality of living, then Fossil Fuels will be required through 2050. Net Zero Carbon Emissions by 2050 will be difficult or impossible to achieve, in my opinion.

Richard F. Storm

July 31, 2021

References:

  1. Dick Storm’s ProBizBlog: https://dickstormprobizblog.wordpress.com/2020/08/28/the-importance-of-energy-part-2-our-energy-sources/
  2. https://dickstormprobizblog.wordpress.com/category/energy-electricity-economic-prosperity-and-environmental-protection/
  3. Donn Dears “Power for the USA” Blog:  https://ddears.com/2021/04/20/america-we-have-a-problem-the-green-nightmare-part-1-the-nuclear-problem/
  4. Mark Mills, Manhatten Institute, “The Green New Deal Can’t Break the Laws of Physics” : https://www.manhattan-institute.org/green-new-deal-laws-of-physics
  5. U.S. Department of Energy, EIA (Energy Information Administration) Annual Energy Outlook, 2021: https://www.eia.gov/outlooks/aeo/
  6. U.S. Census Data of population projections into the future: https://www.census.gov/data/tables/2017/demo/popproj/2017-summary-tables.html
  7. Number of cars and light trucks registered in the U.S.A. by Statista: https://www.statista.com/statistics/183505/number-of-vehicles-in-the-united-states-since-1990/
  8. The German Experience with Renewables by Michael Schellenberger July 2021: https://michaelshellenberger.substack.com/p/german-emissions-from-electricity-674?token=eyJ1c2VyX2lkIjozNTA0MDMyMSwicG9zdF9pZCI6MzkzMjEwODMsIl8iOiJleWpPVSIsImlhdCI6MTYyNzcyNjM5NywiZXhwIjoxNjI3NzI5OTk3LCJpc3MiOiJwdWItMjc5NDAwIiwic3ViIjoicG9zdC1yZWFjdGlvbiJ9.e-R9JLkkOf0AoO-vTujt5twuRqVqIdPKOz-X9f0Fvko

Hydrogen, Part 1

A Primer on Hydrogen as a fuel

Introduction

There has been much talk and writing of proposed laws by Congress to create a transformational change to renewable power. Some of this has been described as the “New Green Deal”. I have checked the Biden Administration proposed Budget and read what the Democrats have proposed for driving America to a “Net Zero CO2 America”(2,3). Based on all of this attention to “Nationalizing American Energy” supply, as one Princeton University Professor referred to it, I thought it would be helpful to create a Blog of information on hydrogen. A place where my friends can visit to learn more about American Manufacturing competitiveness, reliable, affordable electricity and reasonable cost transportation energy. This Blog is my attempt to de-mystify hydrogen as a fuel. Much has been written and hyped for  EV’s (Electric Vehicles). Tesla is perhaps the best known. However, VW, GM, Ford, Porsche, Mercedes and other major automotive manufacturers have made promises to eliminate Internal Combustion Engines by as soon as 2035 and switch to EV’s or hydrogen fuel-cells. Personally, I considered purchasing an electric vehicle but decided against it on the limited range of about 300 miles. The hydrogen fuel-cell vehicles on the other hand, can be refueled much like a gasoline or Diesel  powered vehicle can be. Thus, hydrogen powered vehicles make the most sense for freedom of travel.  The cost likely will be much higher but, at least the performance and range is not limited due to technical limitations as EV’s are. Having said that, maybe the U.S.A. will work slowly into a transition from internal combustion engine powered vehicles to EV and hydrogen power. 

Let’s Assume that we are on a Path to a Hydrogen Economy

There has been much written and talk about hydrogen as part of America’s path to net zero carbon dioxide emissions. It may or may not be practical? For sure, changing to a hydrogen economy will require many changes of industries, fuel distribution network and the electric power system. All things considered, let’s just take a couple pages to review hydrogen as a fuel.

I have worked as a senior engineer in power generation for many years and even to me, there was (and remains) much mystery on the topic of hydrogen as a fuel. So, I thought I would attempt to de-mystify Hydrogen as a fuel and to present some of the facts and details. In an environmentalist’s “Perfect World”, solar and wind would provide all of the energy needed for our ground, sea and air transportation, home heating, air-conditioning, industrial production powering of our Military planes, ships and vehicles and powering our high quality of life. The proponents of hydrogen hope and believe that if they can install enough excess solar and wind power, then the excess power can be used to produce hydrogen. The hydrogen would be stored and then used in internal combustion engines, gas turbines or fuel cells later. Thus, the hydrogen is not a “Primary Fuel” as Fossil, Hydro and Nuclear are now. Hydrogen is a “Secondary Fuel” which means of storing energy that can be used later to generate electricity. When the hydrogen is produced using “Electrolyzers” powered by renewable power, then the hydrogen is referred to as “Green Hydrogen” because there is no carbon used in its production.  Production of hydrogen by electrolyzers has been done for over 100 years and the technology is proven. The U.S. Navy, has used electrolyzers for decades in submarines to produce oxygen from sea water.  About 90% or more of today’s commercial hydrogen is referred to as Grey or Brown Hydrogen. That is because the production of hydrogen is not carbon free and the COthat is released is not captured. There is a Rainbow of Hydrogen colors which are used to describe its production process. They are ranked in order of environmental friendliness, with the least carbon emitting at the top of the list.

  • Green Hydrogen is produced by carbon free electrolyzers powered by solar or wind power The stored hydrogen is then utilized for transportation or peak period electricity production.
Green Hydrogen from wind turbines and solar power is used to power electrolyzers to produce hydrogen from water. It takes nine pounds of water to break the water molecule down to one pound of hydrogen
  • Red or Pink Hydrogen is produced by carbon free nuclear power used to produce hydrogen from electroyzers, using off peak electric power to produce hydrogen
  • Blue Hydrogen is produced using natural gas feedstock with steam reforming (S-M-R) of the molecules and carbon dioxide capture and storage. 
  • White Hydrogen is produced using Biomass with COcapture.
  • Grey hydrogen is produced from methane (CH4) and steam with no COcapture. This, Steam-Methane-Reforming (S-M-R) is the most common method commercial hydrogen is produced today (about 90%). The figures below are from the Chemical Engineering Magazine, Hydrogen Guidebook, This article was first published in May 2010(6).
  • Brown hydrogen is produced using coal as the feedstock with no COcapture and of course, this is the greatest carbon emitting process. 

Fossil fuels are all hydrocarbons and can be utilized as feedstock to produce elemental hydrogen. Methane with four molecules of hydrogen and one carbon (CH4) is the richest hydrogen fuel that exists in nature and is the most common feedstock to produce hydrogen today, so called grey hydrogen, produced as shown above by S-M-R, (Steam-Methane-Reforming). The ranking of the methods above are listed most environmentally friendly top to bottom. The cost of production is inverse with the least cost from bottom to top. If solar and wind were built at extremely low cost with “free fuel” then of course, the green hydrogen may someday become reasonable cost. However, because hydrogen is a “Secondary fuel”, and requires much energy to produce it, the use of hydrogen for transportation in fuel cells is going to be at a far higher cost than the traditional fuels of gasoline, diesel and jet fuel. Also, hydrogen power will be much higher cost as a stored energy source to power gas turbines during peak electric demand periods when there is insufficient solar and wind such as has recently (California Aug.2020, Texas February 2021) been experienced in Texas and California.

Cost will be discussed more later. Suffice it to say that the equivalent cost per million Btu’s of hydrogen will be multiples of the cost/million Btu’s of gasoline, methane, jet fuel or Diesel fuel. In fact, the commercial cost of hydrogen today (if you can find it to buy) would be in the magnitude of ten times more costly on a dollar/million Btu basis for equivalent energy.

How Much Energy Do We Need?

To try to put America’s energy needs into perspective, we use about 100 Quadrillion Btu’s per year of energy. This is equivalent to about an average of 300 million Btu’s per year for each American. 

The Sankey Diagram below shows the flow of all energy supplied and utilized in America for 2020.

U.S. Dept. of Energy, Energy Information Administration, EIA.GOV

Note the 11.78 Quadrillion Btu’s equivalent in the lower left corner. This is the total renewable energy produced in America in 2020 and if you dig down into the EIA data, most of that renewable energy was produced by (old) hydroelectric power such as at Niagara Falls and Bonneville Power out west. If we are to believe that renewables and hydrogen storage can replace fossil fuels and nuclear power, then I think it is important to understand the total energy needs of America. There are prominent politicians, including our President and Speaker of the House of Representatives that believe we can become carbon free by 2035. The Princeton University and National Academy of Sciences(2,3) “Net Zero America” presentation(s) included in the references shows an  impractical, highly costly, Ivory Tower path to Net Zero Carbon. Impractical as it is, about 50% of American citizens think it is a desirable path to follow. The energy experts that draw these plans up are smart. They have spent their entire adult lives in America’s finest Universities and they have numerous technical degrees.  It is energy “experts” like these that are advising our top levels of government. They believe that increasing the solar and wind production of America and by completely rebuilding our electric distribution system that America’s demand for total energy for electricity, EV’s, trucking, industrial output and maintaining our high standard of living can be achieved. It is my opinion that they have proven the technical feasibility of producing renewable power and hydrogen, but at what cost? How much disruption of our Industry? How much loss of American competitiveness? How much loss of American manufacturing capacity?

Total Energy Used By the U.S.A.

Before getting into hydrogen as a fuel, the Sankey Diagram above and the next one below, show the actual sources and uses of American energy in 2020. Both the sources of our total energy and the uses of that energy. 2020 was an unusual year because of the Pandemic and our total energy use actually declines from the range of 100 Quadrillion Btu’s per year to about 93 Quadrillion Btu’s. Here is the EIA (US Department of Energy Information Administration) (1)

The preceding two charts show the energy flows in America during 2020. This amount of energy is what it takes for us to enjoy, what we would consider, our normal, productive and happy lives. I think it is prudent to show where our energy now comes from before discussing replacement of the fossil fuels with renewable energy. Note the renewable energy total above is about 12% of America’s total energy supply and if you dig down into the data, most of that is from 75+ year old hydroelectric dams and from non-dispatchable wind. I am getting ahead of myself as Hydrogen is thought to be the secondary energy that will provide a means of storing renewable energy from peak times such as high wind power production at night when normal electric demand is lower.  More will be discussed in Part 2.  For now, try to imagine replacing twenty million barrels per day of petroleum energy plus all the coal and natural gas used in the foregoing charts, with solar and wind as primary sources of energy and hydrogen as a means of energy storage. The huge challenge is to produce enough electricity to eventually charge 280+ million light EV’s (Electric Vehicles) plus our trucking fleet and jet aircraft. Net Zero carbon if attainable, will take numerous technological break-throughs. Yes, the researchers have prepared reports that renewable power and hydrogen storage can technically be achieved. My focus of this Blog will be to help explain the fundamentals of replacing traditional fuels with hydrogen and some basic facts on the properties of hydrogen. Because I have always used US Customary Units and the same for my friends, I will use US Customary units of British Thermal Unit (BTU), Cubic feet, Pounds, Gallons, etc. 

Hydrogen Energy and Comparisons to Traditional Forms of Energy

The fundamentals of Hydrogen as a form of energy. We should keep in mind, that although hydrogen is one of the most common elements on the planet, most of the hydrogen is combined with oxygen as H2O. Yes, two thirds of the planet is covered in oceans. The next most available and usable form of hydrogen is in common Hydrocarbon Fuels such as Methane CH, Gasoline, Jet Fuel and Diesel Fuel. The most hydrogen rich hydrocarbon fuel is methane with four molecules of hydrogen for every molecule of carbon. The other fossil fuels have much more carbon than hydrogen. The least hydrogen rich Fossil Fuel is coal and may be as little as 3-7% hydrogen most of the additional heating value in coal is carbon. This helps explain the reason why environmental extremists that believe in manmade global warming focus on coal power plants. A rough approximation of carbon emissions of a coal power plant, compared to a natural gas-fueled power plant is, the gas plant will emit about ½ the COas a coal plant of similar capacity. The primary reason for the reduction is the switching from coal to natural gas for electric power production since about 2012 that has drastically reduced America’s total carbon emissions.

Here is a comparison of the heating value and volume of natural gas (which is mostly methane) to hydrogen.

Methane CH              About 1050 Btu’s per std cubic foot               

Hydrogen H               About  345 Btu’s per standard cubic foot  

Hydrogen is the lightest element that exists. Thus, the volume of gaseous hydrogen requires about three times more volume per given heating content as methane. Later the impracticality of the low energy density of compressed hydrogen for transportation becomes a design challenge.

Lets take a Look at the Specifications of a Production Hydrogen Fuel Cell Powered Vehicle, The Toyota Mirai

The published spec’s on the 2021 Hydrogen Fuel Cell powered Toyota Mirai:

Three carbon-fiber-reinforced high-pressure tanks hold a total of 5.6 kg of hydrogen—hydrogen sells for $13 to $17 per kg—enough to give the Mirai a range of up to 400 miles between refueling. Similar to filling a car with gas, it takes about 5 minutes to fill the Mirai with hydrogen. The automaker estimates fuel economy at 74 MPGe for the XLE trim and 65 MPGe for the Limited trim, putting the XLE at the head of the pack for efficiency among its hydrogen-powered competitors. (MPGe stands for “miles per gallon equivalent” and is analogous to how far a car could travel on a gallon of gasoline. Hydrogen is sold by the kg.)

Hydrogen at a cost of $13/kg which is equivalent in energy as a gallon of gasoline, is about four times the cost of gasoline for a given amount of energy. A kg of hydrogen is roughly equivalent in energy content (Btu’s and Foot Pounds of work) to a gallon of gasoline. So, when a kg of hydrogen costs $13 that is the equivalent of $13/gallon of gasoline. Helping to balance that, is the higher efficiency of a Fuel Cell and electric motor combination which provides the example 74 MPGe. Which in all honesty, is about the same cost per mile as my Cadillac SRX which gets about 25 MPG on a trip. Thus, Hydrogen is three times the cost but is nearly equal in propulsion power per dollar. (That is, if you can find and buy hydrogen.) Check the “Car & Driver” Magazine article referenced here: https://www.caranddriver.com/features/a36003212/hydrogen-mirai-california-shortage/

In time, the distribution network should get better but the transition from petroleum based fueling to EV’s and hydrogen will take a lot of time to be accomplished without disrupting our Economy and our way of life. Let me put aside my personal love of the internal combustion engine and the beautiful sound of a piston powered race car. Let’s take a look at what hydrogen is and what it can do to provide the energy we need.

Hydrogen Properties

Chemical Symbol                                                                 H

Molecular weight                                                                   1

Commonly Found as water H2O, Molecular weight        18

Molecular weight of Oxygen     16                                              

Electric power to separate H & O from water/pound           17.7kWh/pound at 100% Efficiency

Typical commercial electrolyzer efficiency                  60-80%

At least 9 pounds of water are required to create                 1 pound of hydrogen

The 9 pounds of water to create 1 pound of water is a minimum. This just includes the feedstock of water required to create hydrogen by disassociation of the oxygen and hydrogen molecules. It does not include the cooling water for the conversion apparatus or electric power production.

Heating Value (HHV) of Hydrogen   61,000 Btu’s/Pound                                    

Heating Value (LHV) of Hydrogen    51,000 Btu’s/pound                                      

Explosive range in air at ambient temperature           4-76%

Expansion ratio from liquid to gas of Hydrogen                    848 X more vol. as a gas than liquid

Green Hydrogen Production

The “Perfect World Scenario” is to use enormous wind and solar farms to produce enough electric power to provide America’s Base load requirements and also have some extra capacity that can be utilized to power Electrolyzers for hydrogen fuel production. The land area needed for wind and solar power is covered by Donn Dears, Mark Mills and others. Suffice it to say, it would take a lot of Real-Estate. One estimation for California to be powered by 100% renewables would require a land mass equivalent to the entire state of South Carolina to do so.

My main points are: There are about 250 million light trucks and automobiles on our roads now. About  37% of our current energy is used to produce electricity. The other 63% of our energy is used for Industrial Production, Transportation and heating. It is impractical and ridiculous to believe that our industrial base and our economy can be converted in fifteen years to power 250 million vehicles, plus millions of heavy trucks, thousands of ships America’s jet aircraft fleet to renewable nergy. Perhaps someday, but not by 2035.

Dick Storm, July 6th, 2021

References:

  1. EIA Monthly June 24, 2021: https://www.eia.gov/totalenergy/data/monthly/
  2. Princeton University efforts to advise government on “Achieving Net Zero CO2 America”
  3. National Academies of Science report, Achieving Net Zero Carbon: https://www.nationalacademies.org/news/2021/02/new-report-charts-path-to-net-zero-carbon-emissions-by-2050-recommends-near-term-policies-to-ensure-fair-and-equitable-economic-transition-and-revitalization-of-manufacturing-industry
  4. Special Report on Hydrogen Fuel, by Donn Dears, Energy Expert: https://ddears.com/2021/06/01/special-report-on-hydrogen/
  5. “The Looming Energy Crisis, are Blackouts Inevitable?”, by Donn Dears, 2020
  6. Chemical Engineering Guidebook. A Compilation of articles on the topic of hydrogen Technologies, Handling & Developments, 2020 Edition, Published by, Access Intelligence.
  7. Mark Mills, The Manhatten Institute, “The Myth of The Great Energy Transition” https://www.manhattan-institute.org/the-myth-of-the-great-energy-transition
  8. Airbus Hydrogen Fueled Aircraft info: https://www.airbus.com/en/innovation/zero-emission/hydrogen/zeroe

Energy, Human development index and economic prosperity

Two Examples: America in the 20th Century and China in the 21st

I prepared for a presentation to USCB-OLLI on the history of Energy and Electricity. Along the way of preparing it hit me. Few professors of either history or engineering discuss the relationship of energy and Economic prosperity or for Developing Countries, the relationship of energy and an improving Human Development Index. My friends that are employed in the energy business know this. But, it also occurs to me that we are a small minority, perhaps only a few million out of 330 million American citizens. Most citizens do not really understand until a hurricane kills electric power or a pipeline shutdown causes gas lines. Only then does the average American appreciate the importance of energy to our way of life.

Here is my shot at helping to connect the dots of the importance of energy:

At the turn of the 20th century, coal fuel was important and remained our largest primary energy source until about the end of WWII. Then petroleum took off as the largest source of primary energy. Why? Of course, because of the popularity and convenience of automobile travel and of course, air travel too. Key point: Our economy grew exponentially as a result of abundant and reasonable cost energy. The chart of GDP per person was prepared by “Our World in Data”. Americans in 2017 had the highest standard of living of any country listed on the chart. A short answer would be Freedom, Capitalism and American policies. In my opinion, the one factor not given proper credit for, is abundant and reasonable cost energy. We reached energy independence by 2020 and America’s electricity costs are amongst the lowest in the world.

Together, reasonable cost energy and electricity fuels a thriving economy, jobs and manufacturing productivity. America’s leadership in the Industrial world is at risk, given the foolish and un-scientifically based policies coming from Washington regarding anti-Carbon and Green Energy.

America was once the most productive manufacturer in the world. From 1900 to about the year 2000, the U.S.A. was the world’s largest manufacturer. Especially for steel and aluminum. Then China was admitted to the World Trade Organization and through foreign investments, including U.S.A. based companies, built their manufacturing base. Now, according to Statista and other references, China is the world’s largest manufacturer.

Energy factored into the importance of America’s economic growth in the 20th Century. Likewise, energy is the pre-requisite for China’s growth in the 21st Century. China built more electric power production power plants in 20 years than America did in the preceding 150 years. Most of these are coal fueled and China now burns about 57% of teh world’s coal. Yes, more coal is consumed by China than all of the rest of the world’s countries combined.

The point is, energy powered not only an improving Human Development Index, but energy is required to power a growing industrial economy. It did so in America in the Century America led the world and energy is powering China’s economy at the beginning of the 21st Century. This is described on the chart below by mcKinsey & Company.

I have written my thoughts, (based on facts) some of the reasons why the Green New Deal is against the best interests of America. Let me stop here for now. The key point I wish to make is, Energy and Economic Prosperity are linked. Reasonable cost, abundant electricity and energy is a pre-requisite for our comfortable life styles as well as National Security. America has a treasure of energy within our borders. It is beyond foolish to not use it.

Ron Clutz has written in Science Matters, an excellent post on the relationship of energy and poverty and how the War on Carbon, better known as “Climate Policies” will harm the poor of the world. It is here: https://rclutz.com/2021/08/07/world-of-hurt-from-climate-policies-part-4/

Some will ask, “What about Climate Change”. Well the best 30 minute presentation I have seen to dispel manmade Climate Change is Professor William Happer’s talk at Hillsdale College.

To Watch the Video Proving there is No Climate Crisis, go to: 

How to think about Climate Change 

A talk at the National Leadership Symposium of Hillsdale College 

Phoenix, AZ, February 19, 2021 

By William Happer 

A key segment begins at minute 24 where the effects of CO2 are discussed. https://bit.ly/3zsXcS6

So, I ask, why are the Democrat Party politicians in Washington working hard to weaken America?

Dick Storm, June 22, 2021

Earth Day: Let’s Celebrate True Sustainability and a continuance of our high quality of life

Reasonable cost, abundant and efficient energy has improved the lives of billions of people all over the world. The relationship of energy use and Quality of life for humankind has been proven. But, you would not know it listening to Green extremist viewpoints. I do not need to elaborate on who some of them are.

I enjoyed a long career working in the electric power and primary metals industries over 50+ years. I traveled the world and have seen with my own two eyes the difference that energy can make to improve lives. Many of the Blessings we Americans take for granted, such as clean water, clean air, easy mobility to travel, food stores with full shelves of safe, fresh food are not enjoyed by billions of people on the planet. If you can imagine it, nearly a billion souls do not have access to electricity and refrigeration. So, here are my thoughts on energy and Earth Day. Computers are marvelous, this one allowed me to dig back to an Earth Day Ad I placed in the “Stanly News and Press” back in 2015. Things have not changed much since then. My six year old ad is below, published during the Obama Administration:

Some things do not change except this time, the Democrat’s control both Congress and the Whitehouse. In my opinion, the dangerous green and Socialistic policies they are promoting will not serve Americans very well. Nor will they do anything to improve Mother Earth.

I enjoy clean air, clean water and nature. I have seven wonderful Grandchildren, all of which I love and care about. Of course I want clean air and clean water too! The Democrat Party Leftists wish to harm America and make us subservient to China. I do not see that as positive for any soul on the planet.

For further reading of Pro-Science, Pro-American and Common Sense informative articles, I suggest the web sites below:

May God continue to Bless America with all of our many comforts, conveniences and yes, abundant and reliable energy. All Fuels are Important!

Dick Storm, April 22, 2021

  1. ACHS EARTH DAY ISSUE APRIL 22,2021: https://mail.google.com/mail/u/0/?tab=wm&ogbl#inbox/FMfcgxwLtZwlxPfwxXGrzhkcXfnGBzlZ

Energy and Some people in Energy who contributed to the rise of America

 Here are some Achievements that Made America Great. Much has been written lately on the “Rise of China”. I thought I would write a short history of the application of energy in America. This is a short history of America’s rise over the last 130 years and some of the pioneers that I wish to lift up as being major contributors to our high quality of life. Quality of life and energy use grew in direct proportion.

INTRODUCTION:

America remains a beacon for freedom and hope to many in the world. Being born and raised in America for me, was my greatest Blessing, perhaps equal to the Blessing of being raised by caring parents. Now as a retired senior citizen, I have time to read, study history and reflect on my good life and the advances that America accomplished in the last Century. 

The purpose of this document is to highlight some of the great inventions and achievements done by Americans during the last hundred and thirty years. I am hopeful that the next Generation of youth will read and contemplate these components of the Foundation of our Society. During these difficult times that our country is divided and the main stream Media, entertainment personalities and politicians seem to be more interested in cancelling history, I thought it is appropriate to highlight America’s progress as leader of the Free World. General Electric’s slogan of the 1960’s could be used to sum up what America showed the world, “We Bring Good Things to Life”.

Energy and Economic Prosperity is what I wish to discuss. However, there are, in my view, some important pre-requisites to the continued success of our nation:

Freedom, Basic Judeo-Christian values of the citizens, Law and Order, Protection of Private Property, Capitalism that rewards risk and innovation, a sound public education system including Colleges and Universities, a caring Philanthropic citizenry that with our Christian-Judeo heritage, care for others. You could say, this is a reminder of where we came from and some of the reasons why the U.S.A. became the world’s strongest and best country of the world.

My 50 entire year career involved energy use and electricity generation. As I reflect back on my life and my parents lives, I can not help relating the correlation of American ingenuity, creativity and the need to use energy to power the ever improving quality of life that we enjoy.

I should also add, over my life-time I have had the privilege and advantage of visiting dozens of countries around the world in both business and as a tourist. I have seen for myself, both Developed and Developing countries and the impact of available and reasonable cost energy. Reasonable cost, abundant energy makes a huge difference in the lives of any society. I have seen so myself.

Let’s review some notable inventions (and the need for energy to fuel them).

1859 Drake’s First Oil Well in Titusville, PA

Whale oil was used for illumination and hundreds of whales were slaughtered to provide fuel. The Drake oil well began a replacement source of energy. Oil refining to distill crude oil into different useful fractions of naphtha, gasoline, kerosene began after 1859. John D. Rockefeller founds Standard Oil Company in 1865 and ultimately becomes the world’s largest oil refiner.

Babcock & Wilcox the premier water tube, steam boiler manufacturer is founded in 1867 by the two Americans, Stephen Wilcox and George Babcock. B&W Boilers were widely applied to provide steam for Westinghouse and General Electric steam engines and steam turbines.

In the year 1900 kerosene lights were popular all across America, soon to be replaced. 

Edison begins the electrification of America at Pearl Street Station in NYC in 1882.

General Electric is founded in 1892. Production of Edison’s incandescent light bulb and the electricity distribution systems grew across the country.

Westinghouse Electric formed in 1886 and shortly thereafter invents the transformer which became critical for distributing Alternating Current electricity over long distances.

Although they were reliable, the early steam engines were huge, heavy devices that were not very efficient. Thus, nearly all companies in the electric equipment business seized the opportunity to develop the steam turbine as an alternative. In 1897, GE entered into an agreement with Charles Curtis, who directed turbine development work at GE until 1900, to exploit his patent (No. 566,969) for the Curtis steam turbine. In 1895, Westinghouse acquired rights to manufacture reaction turbines invented and patented in 1884 by the English inventor, Thomas Parsons. Allis-Chalmers also acquired rights to manufacture under Parsons` patents, so early machines of these two manufacturers were quite similar.

The Curtis and the Parsons turbine designs were based on different fundamental principles of fluid flow. The Curtis turbine was an impulse design, where the steam expands through nozzles so it reaches a high velocity. The high-velocity, low-pressure steam jet then impacts the blades of a spinning wheel. In a reaction turbine such as the Parsons design, the steam expands as it passes through both the fixed nozzles and the rotating blades. While the difference appears subtle, it affects the shape and size of the nozzles and blades. In most modern steam turbines the high-pressure stages are impulse blades. The steam pressure drops quickly through these stages, thus reducing the stress on the high pressure turbine casing. The many subsequent stages may be either impulse or reaction designs. 

The Internal Combustion Engine and Energy for Transportation

After 1900 the invention of the Internal Combustion Engine drove oil demand higher as more vehicles were manufactured.

This is the time when the inter-relationship of energy and economic prosperity becomes apparent.

At the turn of the Century, over 60% of Americans lived in Rural areas and worked on their farms. It took about 40% of the population to grow food for our nation1. Horses were the main motive power for farm power and transportation.

Willis Carrier7 invented air conditioning in 1902.  As a resident of South Carolina I often think of this marvelous invention and what it means for comfort during the summer heat and humidity.

Orville and Wilbur Wright begin the journey of American aviation industry 1903.

 Henry Ford invents the automotive Assembly Line about 1913. Tractors become a farm productivity factor about 1920. Henry Ford increases worker’s wages to $5.00 per day and begins the migration of rural families to the city.

Thomas Edison and George Westinghouse vigorously compete to electrify the nation. Serbian immigrant, Nickola Tesla invents the poly-phase motor and other inventions while working for Edison and Westinghouse.  Motors designed by Tesla and manufactured by Westinghouse power the manufacturing boom in America.

Low cost, abundant coal becomes the primary fuel for electric power generating plants across the U.S.A. 

Coal and native iron ore fuel the American Steel Industry. US Steel was founded in 1901. At the beginning of the 20th century, a number of businessmen were involved in the formation of United States Steel Corporation, including Andrew CarnegieElbert H. GaryCharles M. Schwab, and J.P. Morgan. Carnegie had founded Carnegie Steel Company.

The “Roaring ’20s” was a period of prosperity and expansiveness. The United States produced 40 percent of the world’s supply of iron and steel. 

In 1927 Juan Trippe, another American entrepreneur, forms Pan American Airways starting as mail service between Florida and Cuba. About 1931 Trippe and the Russian immigrant aeronautical engineer, Igor Sikorsky develop flying boats called the Pan Am Clipper’s to expand passenger travel across the Caribbean. Later, Trippe becomes a pioneer in purchasing commercial aircraft from Martin and Boeing. Pan American Airways expand to regular service all around the world.

During WWll, America enters and becomes the “Arsenal of Democracy” to defeat the Axis enemies. After WWII, America rebuilds Germany and Japan with the transfer of American expertise, trade secrets and manufacturing know how . Germany and Japan rise to become highly productive countries.

Hydraulic Fracturing is invented by Americans during the Civil War about 1862. Later developed about 1947 and combined with Directional Drilling by George Mitchell about 1999. Directional drilling combined with Fracking in 2017 propelled America to becoming the world’s number one producer of oil and natural gas.

Captain and eventually promoted to Admiral, Hyman G. Rickover invents a nuclear propulsion system for the US Navy. The first nuclear ship, the submarine USS Nautilus is launched in 1954, and traverses the North Pole under the ice in 1957. Later in the 1950’s, Rickover provides a gift of a means for economical and reliable nuclear power generation to all of mankind. President Eisenhower’s “Atoms for Peace” initiative promotes peaceful uses of atomic energy worldwide. The American companies, Westinghouse, Babcock & Wilcox, General Electric, Allis Chalmers, General Atomics and more all contribute to the building of commercial nuclear power plants around the world. France’s highly successful nuclear power generation began with the gift of the Westinghouse Pressurized Water Nuclear Steam System. The commercial nuclear steam system was perfected by Admiral Rickover for the Navy and later applied to the first commercial nuclear power plant at Shippingport near Pittsburgh, PA. After Shippingport as the expression goes, it is all history and the old nuclear plants in the U.S.A. built in the 1970’s and 1980’s still generate about 20% of America’s electricity. Here is a time line of Rickover’s productive life:

  • 1900 Jan 27th Born in Maków Mazowiecki, Kingdom of Poland.
  • 1922 Received B.S. from the United States Naval Academy.
  • 1929 Received M.S. in Electrical Engineering from Columbia University
  • 1929 to 1933 Served on two submarines for the Navy.
  • 1939 to 1945 Worked in the Bureau of Engineering (consolidated into the Bureau of Ships in 1940) in Washington, D.C.
  • 1946 Traveled to Oak Ridge.
  • 1949 to 1982 Served as Director of Naval Reactors.
  • 1954 The USS Nautilus, the first nuclear-powered submarine, is commissioned.
  • 1958 Shippingport Atomic Power Station, the first full-scale, commercialized pressurized water reactor, is commissioned.
  • 1982 Forced to retire from the United States Navy. (age 82!)
  • 1986 Jul 8th Died in Arlington, Virginia

Thank you Admiral Rickover, your gift to mankind of peaceful uses of nuclear power changed the world!

Energy and Economic Prosperity are Linked

The chart below which uses data from the World Bank and the United Nations reminds us of the importance of energy to support favorable living standards. Note that over 50% of the world’s population lives on a small percentage of the energy used per capita in America.

China’s Rise Powered by Fossil Fuels, for Comparison

In other sections of this Blog, I have written about the rise of China and how China has built more coal power generation capacity in twenty years than America did since Thomas Edison’s Pearl Street Station first began. That is right, China has built far more electricity generation in twenty years than that accomplished by the U.S.A. in 130 years. Here is a graph of the world’s largest coal consumers and as you can see, China is far ahead of all other countries of the world.

In closing, let me say, I am very thankful to be an American and to enjoy our high quality of life.

The first part of this document was to remind us of some of the fine American inventors, business people and entrepreneurs that built the industries that make our good lives possible.

Wishing you a Blessed and Happy Easter,

Dick Storm

March 31, 2021

References:

  1. U.S. Dept. of Agriculture and Census Report: https://www2.census.gov/prod2/decennial/documents/41667073v5p6ch4.pdf
  2. Henry Ford invents assembly line 1913: https://corporate.ford.com/articles/history/moving-assembly-line.html
  3. ASME Program to Honor Drake’s First Oil Well in the U.S.A. : https://www.asme.org/wwwasmeorg/media/resourcefiles/aboutasme/history/landmarks/40-drakeoilwell.pdf
  4. History of Oil Refining: https://www.britannica.com/technology/petroleum-refining
  5. John D. Rockefeller and Standard Oil Co. : https://www.history.com/topics/early-20th-century-us/john-d-rockefeller
  6. History of Steel Making in U.S.A. https://www.steel.org/about-aisi/history/
  7. Willis Carrier, inventor of Air Conditioning 1902: https://www.carrier.com/carrier/en/worldwide/about/willis-carrier/
  8. General Electric History: https://www.britannica.com/topic/General-Electric
  9. Westinghouse Electric History: https://www.bizjournals.com/pittsburgh/news/2017/03/29/timeline-westinghouse-electric-co.html
  10. Pan American Airways History: https://www.panam.org/about-pahf/paa-a-brief-history
  11. Babcock & Wilcox Boilers: https://www.babcock.com/about/history
  12. Our World in Data Fossil Fuels consumption since Industrial Revolution: https://ourworldindata.org/fossil-fuels
  13. McKinnsey and Company Energy and GDP: https://www.mckinsey.com/industries/electric-power-and-natural-gas/our-insights/the-decoupling-of-gdp-and-energy-growth-a-ceo-guide#
  14. World Energy Use and GDP relationship chart: https://www.eea.europa.eu/data-and-maps/figures/correlation-of-per-capita-energy
  15. NPR Economy and Energy explained: https://www.npr.org/sections/money/2013/04/10/176801719/two-centuries-of-energy-in-america-in-four-graphs
  16. Why Fossil Fuels are so hard to Quit, Brookings Institute: https://www.brookings.edu/essay/why-are-fossil-fuels-so-hard-to-quit/
  17. Shippingport Nuclear Plant, first commercial nuclear power generation plant 1958 as part of President Eisenhower’s “Atoms for Peace” initiative: https://en.wikipedia.org/wiki/Shippingport_Atomic_Power_Station
  18. Power Engineering Historical Report on Steam Turbines: https://www.power-eng.com/coal/steam-turbines-power-an-industry/#gref
  19. Charles Parsons, 1884 Steam Turbine inventor: https://www.britannica.com/technology/turbine/History-of-steam-turbine-technology
  20. History of Hydraulic Fracturing: https://www.aoghs.org/technology/hydraulic-fracturing/

Presidential Executive Order signed by Biden That will harm the U.S. Economy

March 2, 2021

Executive Order 13990 of January 20, 2021

Protecting Public Health and the Environment and Restoring Science To Tackle the Climate Crisis

Here is why I see this and other policy reversals by President Biden to be harmful to the best interests of America. The chart below is from the EIA website and it shows the total primary energy used during 2019. The total energy from traditional fuels is 89% which includes the 8% nuclear contribution. Economic prosperity and Energy parallel each other. That is, as improved economic activity progresses, so does energy consumption. Two cases in point are the USA energy and economy growth from 1900-2000 and also China’s astounding economic growth from 2000 to 2020. In both cases, energy and yes, mostly Fossil Fuels powered that economic growth.

So, when one looks at the EO below by President Biden to kill the Keystone XL Pipeline and other Fossil Fuel projects, what can he be thinking? Certainly not what is best for America? There are other EO’s which provide committees of Democrat political Hack’s to advise Biden on further attacks on American Industry and American Prosperity.

I will copy excerpts of the one Executive Order referring to the Keystone Pipeline below. This is a portion of the EO is copied from the Federal Register to make certain that I stated the exact language. Copied (a partial excerpt) below in Green Font:

“Sec. 5. Accounting for the Benefits of Reducing Climate Pollution.

(a) It is essential that all agencies capture the full costs of greenhouse gas emissionsas accurately as possible, including by taking global damages into account.

Doing so facilitates sound decision-making, recognizes the breadth of climatemte impacts, and supports the international leadership of the United States on climate issues. The ‘‘social cost of carbon’’ (SCC), ‘‘social cost of nitrous oxide’’ (SCN), and ‘‘social cost of methane’’ (SCM) are estimates of the monetized damages associated with incremental increases in greenhouse gas emissions. They are intended to include changes in net agricultural productivity, human health, property damage from increased flood risk,and the value of ecosystem services. An accurate social cost is essential for agencies to accurately determine the social benefits of reducing greenhouse gas emissions when conducting cost-benefit analyses of regulatory and other actions.

(b) There is hereby established an Interagency Working Group on the Social Cost of Greenhouse Gases (the ‘‘Working Group’’). The Chair of the Council of Economic Advisers, Director of OMB, and Director of the Office of Science and Technology Policy shall serve as Co-Chairs of the Working Group.

(i) Membership. The Working Group shall also include the following otherm officers, or their designees: the Secretary of the Treasury; the Secretarym of the Interior; the Secretary of Agriculture; the Secretary of Commerce; the Secretary of Health and Human Services; the Secretary of Transportation;mthe Secretary of Energy; the Chair of the Council on Environmentalm Quality; the Administrator of the Environmental Protection Agency; the Assistant to the President and National Climate Advisor; and the Assistantmto the President for Economic Policy and Director of the National Economic Council.

(ii) Mission and Work. The Working Group shall, as appropriate andconsistent with applicable law:

(A) publish an interim SCC, SCN, and SCM within 30 days of thedate of this order, which agencies shall use when monetizing the value of changes in greenhouse gas emissions resulting from regulations andother relevant agency actions until final values are published;

(B) publish a final SCC, SCN, and SCM by no later than January 2022;

(C) provide recommendations to the President, by no later than September

1, 2021, regarding areas of decision-making, budgeting, and procurement by the Federal Government where the SCC, SCN, and SCM should be applied;

(D) provide recommendations, by no later than June 1, 2022, regardinga process for reviewing, and, as appropriate, updating, the SCC, SCN,and SCM to ensure that these costs are based on the best available economics and science; and

(E) provide recommendations, to be published with the final SCC, SCN,and SCM under subparagraph (A) if feasible, and in any event by no later than June 1, 2022, to revise methodologies for calculating the SCC, SCN, and SCM, to the extent that current methodologies do not adequately take account of climate risk, environmental justice, and intergenerational equity.

(iii) Methodology. In carrying out its activities, the Working Group shall and Medicine as reported in Valuing Climate Damages: Updating Estimation of the Social Cost of Carbon Dioxide (2017) and other pertinentscientific literature; solicit public comment; engage with the public andstakeholders; seek the advice of ethics experts; and ensure that the SCC, SCN, and SCM reflect the interests of future generations in avoiding threatsposed by climate change.

Pipeline, L.P. a Presidential permit (the ‘‘Permit’’) to construct, connect,

Sec. 6. Revoking the March 2019 Permit for the Keystone XL Pipeline.

(a) On March 29, 2019, the President granted to TransCanada Keystone operate, and maintain pipeline facilities at the international border of theUnited States and Canada (the ‘‘Keystone XL pipeline’’), subject to expressconditions and potential revocation in the President’s sole discretion.ThePermit is hereby revoked in accordance with Article 1(1) of the Permit.

(b) In 2015, following an exhaustive review, the Department of Stateand the President determined that approving the proposed Keystone XLpipeline would not serve the U.S. national interest. That analysis, in addition to concluding that the significance of the proposed pipeline for ourenergy security and economy is limited, stressed that the United States must prioritize the development of a clean energy economy, which will in turn create good jobs. The analysis further concluded that approval of the proposedpipeline would undermine U.S. climate leadership by undercuttingthe credibility and influence of the United States in urging other countriesto take ambitious climate action.

(c) Climate change has had a growing effect on the U.S. economy, withclimate-related costs increasing over the last 4 years. Extreme weather eventsand other climate-related effects have harmed the health, safety, and securityof the American people and have increased the urgency for combattingclimate change and accelerating the transition toward a clean energy economy.The world must be put on a sustainable climate pathway to protectAmericans and the domestic economy from harmful climate impacts, and to create well-paying union jobs as part of the climate solution.

(d) The Keystone XL pipeline disserves the U.S. national interest. TheUnited States and the world face a climate crisis. That crisis must bemet with action on a scale and at a speed commensurate with the needto avoid setting the world on a dangerous, potentially catastrophic, climatetrajectory. At home, we will combat the crisis with an ambitious planto build back better, designed to both reduce harmful emissions and creategood clean-energy jobs. Our domestic efforts must go hand in hand withU.S. diplomatic engagement. Because most greenhouse gas emissions originatebeyond our borders, such engagement is more necessary and urgentthan ever. The United States must be in a position to exercise vigorousclimate leadership in order to achieve a significant increase in global climateaction and put the world on a sustainable climate pathway. Leaving the

Keystone XL pipeline permit in place would not be consistent with myAdministration’s economic and climate imperatives.”

I have three main concerns:

  1. This will do nothing to change the climate and in fact, many well respected scientists believe the Climate Change that is occurring is mostly from natural causes, not Anthropogenic Greenhouse gases.
  2. America’s Economy is fueled by energy and of the approximately 100 Quadrillion Btu’s of energy we use each year, more than 85% is provided by traditional forms of energy including natural gas, oil, coal and nuclear.
  3. This EO plus others are anti-American in my viewpoint because they harm the best interests of America for fueling our economy as well as for National Security and Global Competitiveness.

Here are a few references of why I do not believe that manmade carbon emissions are the primary driver of Climate Change. The Greenhouse Gas Theory is correct but the 400-500 ppm of CO2 is less than 0.05% of the atmosphere. Nitrogen is 78%, Oxygen 20.9% and other gases about 1.1%. Scientific references of Climate Scientists do not agree with those political allies of the current President. Here are nine excellent references and web sites:

  1. Dr. Roy Spencer (NASA)  Blog on “Manmade vs. Natural Climate Change”: https://www.drroyspencer.com/global-warming-natural-or-manmade/
  2. Spencer also: http://bit.ly/2N4fmpf
  3. Dr. Judith Curry Blog (Retired GA Tech Professor)“Climate, etc”: https://judithcurry.com/?s=Curry
  4. Dr. John Christy (on Roy Spencer website)  http://www.drroyspencer.com/latest-global-temperatures/
  5. Dr. S. Fred Singer Book, “HOT TALK COLD SCIENCE”, “Global Warming’s Unfinished Debate”
  6. Donn Dears Blog on Temperature Records, Facts March 2, 2021: https://ddears.com/2021/03/02/temperature-records/
  7. Tony Heller Presentation on Real Climate Science:  Interesting facts of unreported todasy, 1930’s winters https://bit.ly/2LrkLXf
  8. Real Climate Science: https://realclimatescience.com/2019/01/2018-one-of-the-least-extreme-weather-years-on-record/
  9. From Dr. George Holliday’s Environmental Engineering Newsletter, Feb. 21, 2021 edition:

 1…ROAD TO CLIMATE NEUTRALITY 

Posted on February 8, 2021 by curryja

by Judith Curry 

Spatial Requirements of Wind/Solar and Nuclear Energy and Their Respective Costs 

“In addition to the energy sector, the climate debate also needs a transition. From ideology and wishful thinking, to facts, figures and rationality.” 

An important document was published last week, a collaborative instigated by two members of the European Parliament – one from the Netherlands and the other from Czechoslovakia. One of the editors on the resulting report is Lucas Bergkamp, who has written several guest posts at Climate Etc. 

The study is now available for download on the website http://www.roadtoclimateneutrality.eu. 

This document provides a critical reality check on the rush to replace fossil fuels with renewable energy. 

Press Release 

Climate study advises EU to embark on a “Nuclear Renaissance” program 

A new study on EU climate policy finds that it is practically impossible to generate sufficient energy with wind and solar energy as there is not enough available land to cover all electricity demand. The study, titled ’Road to EU Climate Neutrality by 2050’ advises the EU to embark on a “Nuclear Renaissance” programme in trying to achieve its climate objectives. 

The EU has endorsed the ambitious objective of achieving climate neutrality (i.e. net zero greenhouse gas carbon emissions) by 2050. An energy transition away from fossil fuels is necessary to achieve this objective. The ECR and the Renew group of the European Parliament have commissioned an independent study into the spatial requirements of wind/solar versus nuclear energy and their respective costs. A team of experts came to the conclusion that it is practically impossible to provide enough energy with renewables. 

The study includes a case study done for two EU member states: The Netherlands, a country along the North Sea with abundant wind, and the Czech Republic, a landlocked country with no access to sea and a geographical more challenging landscape. In realistic scenarios, there is not enough land to meet all power demand if the Czech Republic and The Netherlands were to rely solely or predominantly on wind and solar power. 

The study, initiated by Dutch MEP Rob Roos and Czech MEP Ondřej Knotek and peer-reviewed in part by, among other respected scientists, Nobel Prize-winning economist William Nordhaus, finds that nuclear energy is also more cost-effective than renewables. Even if taken into account major efficiency improvements in solar and wind farms, nuclear energy will remain the cheaper option in 2050. In this comparison, the enormous costs for adapting the electricity grid, such as connecting wind turbines at sea or solar parks on land, are not even included. That price tag is also invariably lower for nuclear energy. 

“We found it remarkable that – in transitioning away from fossil fuels – the EU made a policy decision in favour of renewable energy without considering the relative pros and cons of all carbon-neutral technologies”, both MEPs stated. 

Mr Roos: “Nuclear energy is always available, cheaper and saves the landscape. Moreover, further research into, for example, the thorium molten salt reactor offers enormous opportunities for our export position. Let’s invest our tax money in that. ” 

At the moment, sun and wind energy are being pushed and nuclear energy is being held back. The study contains several policy recommendations for the European Commission to change its approach. 

Mr Knotek: “The EU is well invited to create a technology-neutral level playing field for decarbonized power generation technologies. To this end, the EU should adopt a ‘Nuclear Renaissance’ program that places nuclear energy on equal footing with renewable energy. The EU policies today are discriminative when it comes to nuclear energy. It’s time for all policy makers to live up to the EU principle of technological neutrality” 

The study also concluded that EU 2050 climate neutrality, if achieved, will likely cause only a very small decrease in the average global atmospheric temperature increase, estimated at between 0.05°C and 0.15°C in 2100, and no more than between 0.02°C and 0.06°C in 2050, assuming no carbon leakage occurs. Electricity-generating technologies therefore should be evaluated for the degree to which they constitute ‘no regrets’ solutions. 

Excerpts from Executive Summary 

This report presents a summary of the results of a study1 that examines three issues that are key to the EU climate neutrality’s ambition: 

i. The effect of EU climate neutrality on the average global atmospheric temperature by 2050 and 2100; 

ii. The spatial (land and sea) requirements for wind and solar energy versus nuclear energy in the Czech Republic and The Netherlands; and 

iii. The cost of wind/solar energy and of nuclear energy for these two countries. 

Of course, it would have been preferable had the European Commission itself done a comprehensive cost/benefit analysis of 

alternative policy options available to pursue the EU’s climate neutrality objective. The fact that no such analysis has been conducted, despite the European Commission’s ‘Better Regulation,’ highlights the 

strong political forces and sense of urgency behind EU climate policy-making.5 

In light of the spatial and economic consequences of renewable energy relative to nuclear energy, the EU is well advised to consider a “Nuclear Renaissance” program. Under this program, the EU would create a level playing field for all electricity generation technologies. 

Key Takeaways: 

The EU’s 2050 climate neutrality strategy involves a high risk of ineffectiveness. The anticipated energy transition, however, can hedge against this risk by deploying ‘no regrets’ solutions that are resistant to climate-related ineffectiveness. Nuclear power is such a solution. 

In addition, with respect to both spatial requirements (area of land required) and costs of electricity, nuclear power offers substantial advantages over renewable power (any combination of wind and solar). The cost advantage of nuclear power increases once system costs are added to the equation, and increases further with higher penetration rates of wind and solar. 

These advantages have been recognized in the Czech Republic, but not (yet) by policy makers at the EU level and in The Netherlands. 

I close with the strong opinion that the Politically Correct, “War on Carbon” is a product of the Washington DC Swamp and it will continue to create harm to America.

There has been an email circulating for the last eight years or so entitled something like, “535 vs. 330 million”. The point is, the House of Representatives (435) plus the Senate (100) is a small club like group that create policies that impact all 330 million Americans. Of course, rulings or policies of President Biden and the Supreme Court can also impact all of us. Then, in my opinion, these 545 individuals, including Biden and SCOTUS, must be living in a Bubble completely devoid of interest in doing what is best for the 330 million.

Dick Storm

March 2, 2021

Texas and Coal Power 6,000+ MW’s of Coal plant Capacity is missed!

Introduction:

My first assignment to Texas was as a young B&W Results Engineer. I was participating as one of the Results engineers to perform acceptance tests of a large (500 MW class) natural gas fueled boiler at the P.H. Robinson Plant near Houston. That was about 1968. After that involvement I watched with great interest as Texas built dozens of 500-750 MW natural gas and oil fueled plants all across Texas. Built by Foster-Wheeler, Combustion-Engineering and Babcock & Wilcox. Then came the Arab Oil Embargo in 1973 and Texas responded to this true energy crisis with an incredibly successful fuel change to power production changing from oil and gas to Texas and Wyoming coal. The huge build out of coal plants went from the late 1970’s till the mid 1980’s and I was impressed. I had the pleasure of working at many of the coal plants operated by various Texas Utility Companies and what impressed me most was the “Can Do” attitude of Texans. Then about 1978 I became very involved as a Field Engineer to help solve combustion and power generation challenges with ALCOA’s massive Rockdale, Texas Lignite Fueled Power Plant. Also in the mid 1980’s involvement with acceptance testing of the 450 MW Gibbons Creek Coal Plant near College Station.

Why am I writing this? It is because I am perplexed after watching for decades how Texans were so practical and innovative, they became enamored with Renewable Wind and Solar Power to a fault. I was not surprised that California had such foolish policies but found it odd that practical Texas would fall into the trap of too much dependence on unreliable, non dispatchable renewables.

In the 1970’s Texas rallied to successfully change from oil and gas fuel to coal. In 2021-2022 I see Texas rallying again to overcome the problem of over-dependence on renewables.

The Good Old Days of Coal Power and Aluminum Production in Rockdale

Here is how coal power in Texas helped to build some of the most productive aluminum manufacturing in North America. A major contributor to the local economy and manufacturer of critical metals for America at the same time providing over 1600 jobs. A story to document the relationship of reasonable cost energy and economic prosperity.

The following is from the Milam County Archives, 1974:

On November 24, 1952, something strange happened in the small, agriculturally-oriented Central Texas town of Rockdale. A visitor, seemingly from a different world, changed the living habits of its people along with the general tempo and appearance of its community. 

The courting days of the 1950’s has now, nearly 22 years later, turned into a love affair unmatched in many communities between industry and townspeople. 

It began innocently enough. The Korean War was raging on and government needed aluminum to make airplanes. Aluminum Company of America needed a new facility to meet the demand. Rockdale, with its large lignite reserves, was the apple in Alcoa’s eye. 

Thousands of acres of the “Cinderella fuel” nestled beneath the earth’s crust gave rise late in 1951 to the establishment of the aluminum industry in Milam County. Aluminum production demands electric power to break down ore, shipped in from South America, to form the lightweight, corrosion-free metal. 

Demand for the metal by government and this abundance of the electrical energy- producing fuel triggered boom-like industrialization when Alcoa’s multi-million dollar Rockdale Works raced into production only 13 months after groundbreaking. 

Tipping the giant vat to cast the first aluminum ingot were the plant’s first boss (now Alcoa board chairman and chief executive officer) John D. Harper and smelting division manager R. T. Whitzel of Pittsburgh corporate headquarters.

Today, Rockdale Works is Aluminum Company of America’s largest worldwide metal producer with eight potlines and the capacity for turning out 280,000 tons annually or 1.5 million pounds per 24-hour, continuous operation day. 

The original four-potline plant was expanded by two more lines in 1956 and the Central Texas smelter became Alcoa’s largest in 1969 with the addition of the seventh and eighth lines. For the first time, Alcoa began producing more aluminum in Texas than in any other state. Rockdale Works and Point Comfort Operations down on the Gulf Coast have a joint capacity for making 455,000 tons annually. 

Rockdale Works has one of the world’s biggest carbon electrode-making facilities and a diversified ingot plant which converts molten aluminum into extrusion, sheet and remelt ingot. The latter produces everything from a 50-pound to a 22,000-pound product. 

A couple of fabricating facilities further enhanced the company’s local investment in the 1960’s. An atomized aluminum powder unit was built in 1966 and has been expanded twice. It’s now the biggest aluminum powder producer in the U. S. Then came a redraw rod facility in 1968 which spews out “raw material” for Alcoa’s electrical conductor-or wire-fabricating plants, primarily its nearby Marshall (Texas) Works. 

The Rockdale story is like many across the Developed World. Reasonable cost and abundant energy is used to fuel a manufacturing facility with the end result of not only manufacturing vital materials but also contributing to employment, funding the local tax base and infra-structure and more. Energy and Economic prosperity go hand in hand. Now, the four power generating units at Sandow Station are shut down. The Rockdale Plant is for sale and aluminum is no longer manufactured here. It was a great run from 1952 till about 2008 when the Chinese took over the aluminum smelting market.

https://www.bizjournals.com/pittsburgh/news/2017/12/22/alcoa-to-close-texas-site-divest-italian-smelter.html

Recent Shutdown of 6,453+ MW of Coal Capacity

Including the Sandow Plant which was adjacent to the ALCOA Rockdale Plant, there were five other robust, reliable coal plants shutdown. These are:

Sandow 1252 MW, Oklaunion 650 MW, Monticello 1,980 MW, J.T. Deely 932 MW, Big Brown 1,186 MW, TMPA Gibbons Creek 453 MW.

Perhaps the renewable wind and solar power capacity made some folks feel good when it was purchased and installed. I am sure it made the environmental extremists happy to see these coal plants gone. However, the people in the great state of Texas sure could have used the reliable electricity that could have been produced from these plants, had they not been prematurely shut down.

Hayden Ludwig published this short video on the Capital Research web site on more sinister reasons of America’s foolish Green Energy policies: https://capitalresearch.org/article/how-china-designed-american-environmental-policy/

It personally saddens me to see the loss of the aluminum manufacturing in Rockdale which essentially was given up to Chinese aluminum smelting capacity. It saddens me also to see the unneccessary suffering of the people of Texas. The environmental extremists may be happy to have successfully hoodwinked the politicians on the evils of carbon. Perhaps now is the time to account for the costs in the loss of American jobs, economic prosperity, the powering of heat pumps, Refineries and Businesses and often overlooked, contributions to the local schools and government infrastructure & tax base.

Dick Storm

February 19, 2021

All Fuels are important! A review of the Reality of Competitive Electricity Generation and the supply of needed Transportation fuels

The President has re-engaged the Obama Administration “War on Carbon” and signed executive orders to kill pipelines, restrict drilling and production of oil and gas on Federal lands and to rejoin the Paris Climate Agreement. If not rescinded, this will cripple American economic growth and prosperity. For decades I have promoted policies of “ALL FUELS are IMPORTANT” so that America can remain a world leader, become energy independent and be competitive in manufacturing. Long story short, the Four E’s have been important to me for many years. The four E’s are: Energy, Environmental Protection, Education and Economic Prosperity.

America depends on 88% conventional fuels to power our high quality of life, our manufacturing and is important for National Security. The 88% is not a wild exaggeration, I have posts in other articles on this Blog that support it as being a fact. Yes, one in ten units of energy are from conventional fuels. Attempting to Kill conventional fuels is worse than dumb policy.

Yet, the Leftist Democrat politicians, the main stream news, entertainment personalities, TV and movies all lead the American public to believe that most of our electricity is generated or could be, from renewable power and soon. This is wrong.

I thought it might be useful to show where our electric power comes from when we need it today. A case in point is the PJM Interconnection which provides electricity generation control (like the FAA provides Air Traffic Controls, PJM provides electrical Dispatch controls for most of the northeastern U.S.A. from New Jersey going west to Chicago. Today is a cold day in Philadelphia and there is not a lot of wind and at 0500 AM zero solar. So, where is the power being generated? Here is a real time chart which was available on the PJM.com website. This shows generation by fuel. Note that about a third each is nuclear, coal and natural gas. Out of 104,430 MW’s being generated only 3,342 MWs are from Renewables. This is 3.2% of the 104,430 MW’s being used (needed) this morning.

Feb. 10, 2021 Generation mix by fuels from pjs.com website

Here is a screen shot from a wsj video on the rise of Renewable Power Generation. Usually, the wsj is a factual news organization. I must admit, it is true that 90% of the NEW Generation in 2020 was Renewables, but still this is only a small percentage of the total (about 3.7 % of 1,000GW of total generation capacity). As the above data from PJM shows, 3.2% by renewables, the EIA data for the entire year 2020 was about 3.8% total energy from renewables.

Here is a picture of the Alaska Pipeline. I show this because it is useful to illustrate the amount of energy America depends on each day. About 20 million barrels per day is what America uses in oil. That is used mostly for vehicle transportation, Jet Fuel and industrial output. The Alyeska pipeline passed about 2.2 million barrles per day on it’s most productive year, 1988. So, picture ten pipelines like this to represent the U.S.A.’s oil use. The Keystone Pipleine is rated at 830,000 barrels per day or less than half of the flow in one 48″ diameter Alaska pipeline.

Just as a reminder, America uses about 100.9 Quadrillion Btu’s of total energy each year. This is utilized as shown below on the chart:

Each of us use about 300-330 million Btu’s per year on average. Whether it is coal, natural gas, nuclear, jet fuel, gasoline, Diesel, hydroelectric, Biomass, wind or solar. We depend on this much energy for our life styles, transportation, comfort, cooking, heating, convenience, manufacturing, commerce, mining, manufacturing and National Defense. Think about the importance of energy in your life.

When the President issues Executive Orders to work toward stopping coal plants, killing pipelines, stopping Hydraulic Fracturing for natural gas production, shutting down oil production and stopping use of all Fossil Fuels, it is simply not possible in the short term. Maybe not possible in decades to do without Fossil Fuels. My friend Donn Dears wrote on his Blog recently about the use of coal and fossil fuels for the production of steel and concrete. Together steel and concrete, according to Mr. Dears represented about 12% of all carbon dioxide emissions.

The Democrats and Green Extremists are, whether they understand it or not, working against the best interests of America. They are harming our hard fought struggle to become energy independent. (I understand in November 2020 America was a net exporter of oil for the first time in decades) If we shut down U.S.A. production of energy fuels, then it is making us vulnerable to supply disruptions. I am old enough to remember the Arab Oil Embargo’s of 1973 and 1980. We do not want to return to dependence of volatile supplies of vital fuels or minerals. Dependence on vital minerals such as Lithium, Rare Earth minerals and other ores is a topic for another day.

Another important point. If the Democrats want to save the planet, the best people to produce energy is Americans. We have standards, regulations and practices that have worked well. I submit, look at our stellar record of safety for nuclear and coal plants. The long life of the Alaska pipeline. If sources in America are off limits then the fossil fuels will be imported from other countries that do not have safeguards as effective and proven as ours. How does that improve the environment?

Back to electricity. These were the six top producers of America’s electricity in 2019: Not a bad balance. (data from the EIA)

  1. Natural Gas Fueled Plants         38.4% of USA total
  2. Pulverized Coal Power Plants    23.4% of U.S.A. Total                                              
  3. Nuclear Power Plants                       19.6% of USA total
  4. Hydroelectric generation               7% of USA total
  5. Wind Turbines                                       7.1% of USA total
  6. Solar Power                                             1.7% of USA total

Of course protection of the environment is important. Also important is National Defense, homeland Domestic manufacturing (to keep jobs here), Economic Prosperity, keeping our high quality of life and a fair world trade balance. The four E’s which I think are all very important and should be balanced for truly sustainable living well: Energy, Environmental Protection, Economic Prosperity and Education.

The fourth “E” Education on Energy Matters has not been very well mastered by the President and Democrat politicians.

Thus, my conclusion that

ALL FUELS are IMPORTANT!

Dick Storm

US war on carbon accomplishes two things

  1. Strengthens China and China’s influence in the world
  2. Weakens America

I was just reading in the morning wsj that another pipeline (in addition to Keystone) has been shut down between Canada and the US. This one operated by Enbridge was a new pipeline to replace a 67 year old existing pipeline with newer, safer construction.

This action is apparently by the Governor of Michigan. But, she has similar (D) views on the War on Carbon as Biden and the rest of the Democrat Party.

Biden’s Executive Order to rejoin the Paris Climate Agreement is anti-American, just as President Trump said it was. The assault on carbon based fuels in the year 2021 is moving fast to further disadvantage or cripple America’s manufacturing might. At the same time, much of the world manufacturing (and economic prosperity that could have fueled America’s economy) is shifting this prosperity to China and Russia. It doesn’t seem to matter to these US politicians that 88% of our total energy comes from conventional sources. By conventional I mean both Fossil and Nuclear energy. Yes, 88% of our energy. The current admistration wishes to crush fossil fuels and is doing little to support nuclear. America had just reached Energy Independence and in the name of “Green Religion”. (What else can you call it?) Biden (and all of the Democrat’s I can think of) wishes to self inflict severe economic harm to American and Canadian industries. What are Biden and the Democrats thinking?

Meanwhile, China is designing, manufacturing, lending and building coal power plants all over the Planet in the Developing Countries of the world. Why? They are seizing the opportunity to show how they can help lift people out of poverty better than the U.S.A. can. Quite honestly, the “Belt and Roads Initiative” is in fact, lifting many out of poverty. Heading into Communism isn’t such a great idea but when folks are living in squalor with no clean water to drink, no job and little electricity, being controlled by the CCP is far down their worry list.

Now, let’s just suppose two American companies like Babcock and Wilcox, a 154 year old magnificent US Manufacturer and General-Electric another world class manufacturer, want to build a new coal power plant in one of Africa’s countries. In my early days of working for B&W, I remember US Foreign Aid was done by exporting American manufactured power plants and more. Great American companies like B&W, Westinghouse, Combustion-Engineering, Foster-Wheeler, Riley Stoker and more. Great memories for me of the 1960’s, It seems the Chinese took notes on our successful policies and are now applying the U.S.A.’s 1960’s model of USAID to their best interests. China calls it the “Belt and Roads Initiative” (BRI). It was win-win in the 1960’s for the U.S.A.. American jobs were provided to design and manufacture the equipment and the Developing Countries were able to improve living conditions and their economy. France began it’s path to excellent nuclear power generation starting with President Eisenhower’s “Atoms for Peace” initiative and the exporting of “Westinghouse Pressurized Water Reactor Nuclear Power Plants” Then, France went on to build their own.

So, China is now replacing America in the global arena of lifting poor countries out of poverty. Why? For now, read the absurd World Bank Policy on lending for new power plants:

The statement below in green font is from the “World Bank” web page:

Energy is at the heart of development.  Energy makes possible the investments, innovations and new industries that are the engines of jobs, inclusive growth and shared prosperity for entire economies. Universal access to affordable, reliable and sustainable and modern energy – Sustainable Development Goal (SDG) 7 — is essential to reach other SDGs and is at the center of efforts to tackle climate change. The World Bank is committed to helping countries reach SDG7, which is central to delivering on the World Bank’s primary mandate: ending poverty and boosting shared prosperity. 

Today, 789 million people live without electricity and hundreds of millions more live with insufficient or unreliable access to it.  Nearly 3 billion people cook or heat their homes with polluting fuels like wood or other biomass, resulting in indoor and outdoor air pollution that cause widespread health impacts.

While the gaps are daunting, significant progress is being made in many areas. The global energy landscape is witnessing a major transformation and renewable energy is playing an increasingly vital role in helping countries develop modern, secure energy systems.  Lower costs for clean energy are helping with this transition, while disruptive technologies like smart grids, smart meters and geospatial data systems have upturned energy planning.

New large-scale approaches that combine grid and off-grid electrification have also contributed to impressive gains in energy access in many countries. In others, mini-grids are showing promise in closing the access gap.  At the same time, solar home systems are increasing in efficiency as they decrease in cost – making them affordable in South Asia and Sub-Saharan Africa, which are regions that account for the most significant gaps in energy access. 

World Bank website Jan. 29, 2021: https://www.worldbank.org/en/topic/energy/overview

China is building thousands of coal plants around the world. Yes, meanwhile, while Biden’s Administration, Democrat Governors and Congress wage their war on carbon, China is helping to lift many countries of the world out of Energy Poverty. “Power Engineering International” magazine has estimated that 2,500 new coal plants will be built in Africa over the next ten years. China already produces over 50% of the world’s steel. Much of that steel production will be used to produce boiler tubing, piping, structural steel and state of the art steam turbines and generators. Not up to US Standards for now, but they are going to get a lot of practice. Meanwhile, America struggles to keep our share of Global manufacturing capacity. China has surpassed our manufacturing capacity. The war on carbon harms poor people struggling to improve their living conditions, it harms American workers and the War on Carbon fuels the rise of China.

That is why I have always advocated Common Sense Energy Policies that include ALL FORMS OF POWER GENERATION are important. Including solar and wind when practical. Let us not forget the 88% that we depend on now.

Dick Storm

Power Engineering International (PEI) Fossil Fuels bring Hope to Africa: https://www.powerengineeringint.com/world-regions/africa/fossil-fuels-to-dominate-africas-energy-mix-this-decade-report/

Japan Times: China Alone in Funding New Coal Plants in Africa:

https://www.japantimes.co.jp/news/2020/05/07/asia-pacific/china-alone-africa-dirty-coal/

Sumitomo Mitsui and Mizuho to end lending for new coal-fired plants

https://www.japantimes.co.jp/news/2020/04/16/business/smfg-mizuho-end-lending-coal-plants/

Chinese cash funds African coal plant building despite environmental concerns: South China Morning Post

https://www.scmp.com/news/china/diplomacy/article/3110554/chinese-cash-funds-african-coal-plant-building-despite

Believer in Freedom to use of Energy for sustainable high quality lives