The United Nation’s Highest Priority In November 2021 to Save The Planet Was COP-26. Which Is More Important , Peace in the World, The Paris Climate Agreement or Avoiding World Famine and Improving the Quality of Life For All of the People of the World, Including Ukraine?
By Dick Storm
Introduction
Horrible crimes against humanity are being committed in the Russia-Ukraine war. Innocent people are being murdered, homes demolished by military bombardment and artillery, world food production slowed(3,4,5) and what are the leaders of the world concerned about? Manmade Climate Change, the most successful scientific hoax in the history of the world. Three world leaders could improve world peace and start the correction of the mess the world is in today if they would change the priorities of the UN. Who am I referring to: Joe Biden, Justin Trudeau and the United Nations Secretary General, António Guterres.
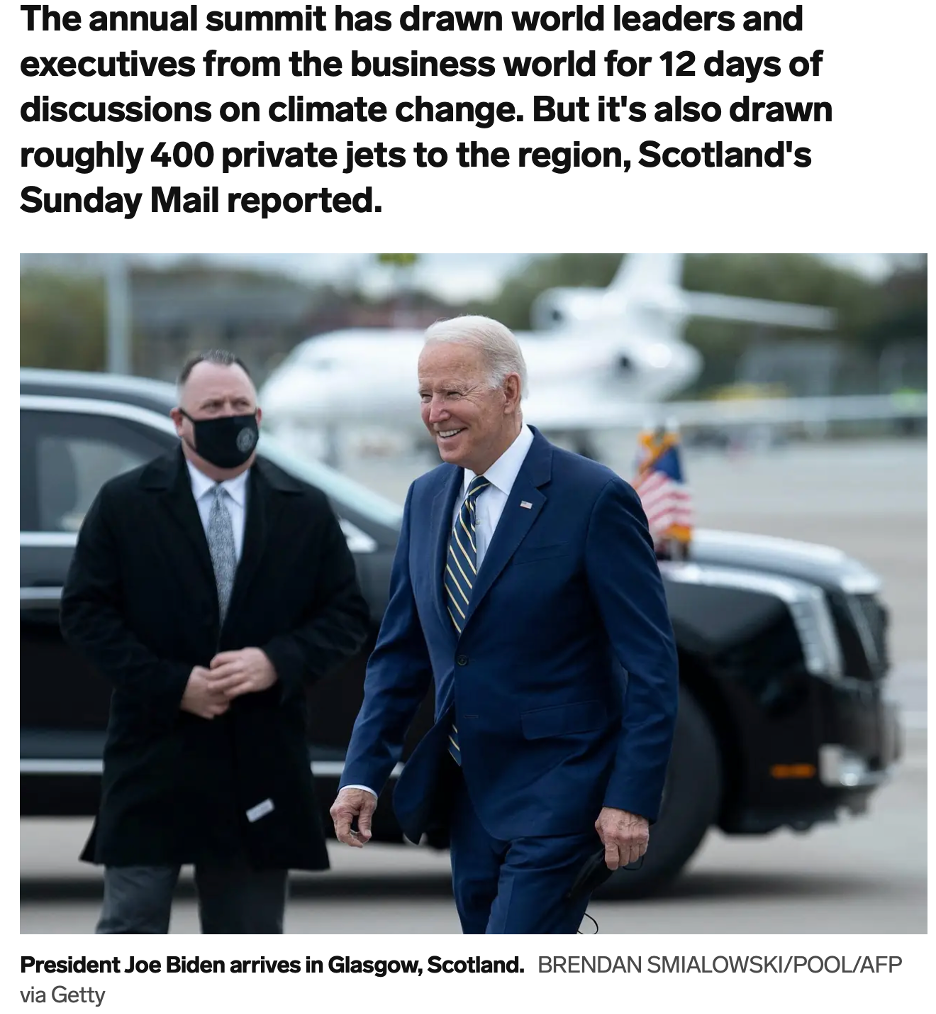
Remember the UN priorities in November 2021? If not, here is a review of what these three leaders considered the most sinister problem the people of the world would face in the future. Flashback to Scotland, November 2021:
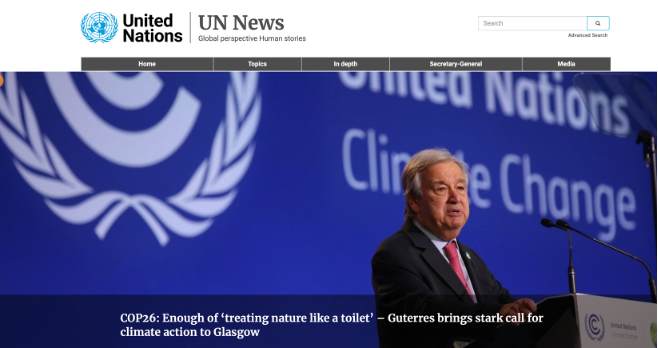

What is The Purpose of the United Nations and The Paris Agreement? World Peace? Protection of the Environment?….or One World Government to Control The People of The World?
As the world is on the threshold of nuclear war with a world food crisis likely next winter from reduced fertilizer availability and massive unproductive farmland in a war zone, these three leaders and many other sycophants have the Paris Agreement for Climate Change Policies as their top agenda, instead of the best interests of their constituents, world peace and improving the human development index of the people of the world.
I feel strongly that the top priority of these leaders and the U.N. is not concern for the planet that drives them. It is politics and control of the world’s citizens. In short, power over people. For example, the UN Secretary General’s background is copied below. This is from his Bio on the UN web page, From Mr. Guterres Curriculum vitae: “For many years Mr. Guterres was active in the Socialist International, a worldwide organization of social democratic political parties.”
Let me digress and quote the past president of the Czech Republic on the “Climate Zealots” such as Guterres, Biden, Kerry, Gore, Trudeau and many more.
Vaclav Klaus is Past President of The Czech Republic and grew up under Communism then had to wrestle with policies by the “Greens” of Europe. An Economist by training. His words, from about 2007…..“Global Warming is a false myth and every serious person and scientist says so. It is not fair to refer to the U.N. panel. The IPCC is not a scientific institution: it’s a political body, a sort of non-government organization of green flavor. It’s neither a forum of neutral scientists nor a balanced group of scientists. These people are polititicized scientists who have arrive there with a one-sided opinion and a one-sided argument”(49)
Justin Trudeau also could help guide the United Nations to a truly serious priority, but according to Peter Schweizer’s recent book, “Red Handed”, Trudeau also ranks political power above world peace. See page 187 describing the Trudeau family and links to China: Justin Trudeau is quoted in 2013: When asked which country he admired the most replied “There is a level of admiration I actually have for China….because their basic dictatorship is allowing them to turn their economy around on a dime and say, ‘we need to go greenest, fastest—we need to invest in solar’ I mean, there is flexibility that I know Stephen Harper (the Canadian PM at the time) must dream dream about having a dictatorship that he can do everything he wanted, and I find that quite interesting”
Avoiding Famine
It should be blatently obvious that ranking peace and the world food supply should be more important than the Paris Climate Agreement which is based on a scientific hoax anyway. Ukraine alone supplied about 12% of the global wheat before the war, and was the biggest producer of sunflower oil. About two-thirds of the country’s wheat exports had already been delivered before the invasion, but the rest is now blocked, and farmers may be unable to continue with spring planting, or take in grain harvests in the summer. A headline in the “Times of Israel” reads, “Israel scrambles for solutions as Ukraine war chokes off egg, wheat imports”Industry figures predict egg shortage and sky-high wheat prices just in time for Passover holiday. The prospect for the world later this year is shortages of food across the globe. (3,4,5, 30)

Energy impacts Fertilizer too! Ukraine and Russia are also major producers of fertilizer, prices for which had already leapt under high energy prices – and the war is sending energy prices higher still, with further impacts on agricultural production costs.
Fertilizer costs in the U.S. have also tripled this year. Partly because of Biden’s energy policies and exacerbated by the Russian invasion of Ukraine. The impact of energy on food availability goes beyond higher cost Diesel fuel for shipping transportation fuel in the supply chain. Fertilizer and farmland in areas of conflict are a huge problem. (2,3,4,9,10)
Perhaps better kept as a separate subject to write on, but most people are not aware that between 30 to 40% of the U.S. corn crop is used to produce Ethanol for a gasoline additive that lowers the energy equivalent of gasoline and reduces auto mileage. Suffice it to say, energy and environmental policies that promote burning food for fuel also affects the world food supply.(16,17)
How is Energy Linked to World Peace?
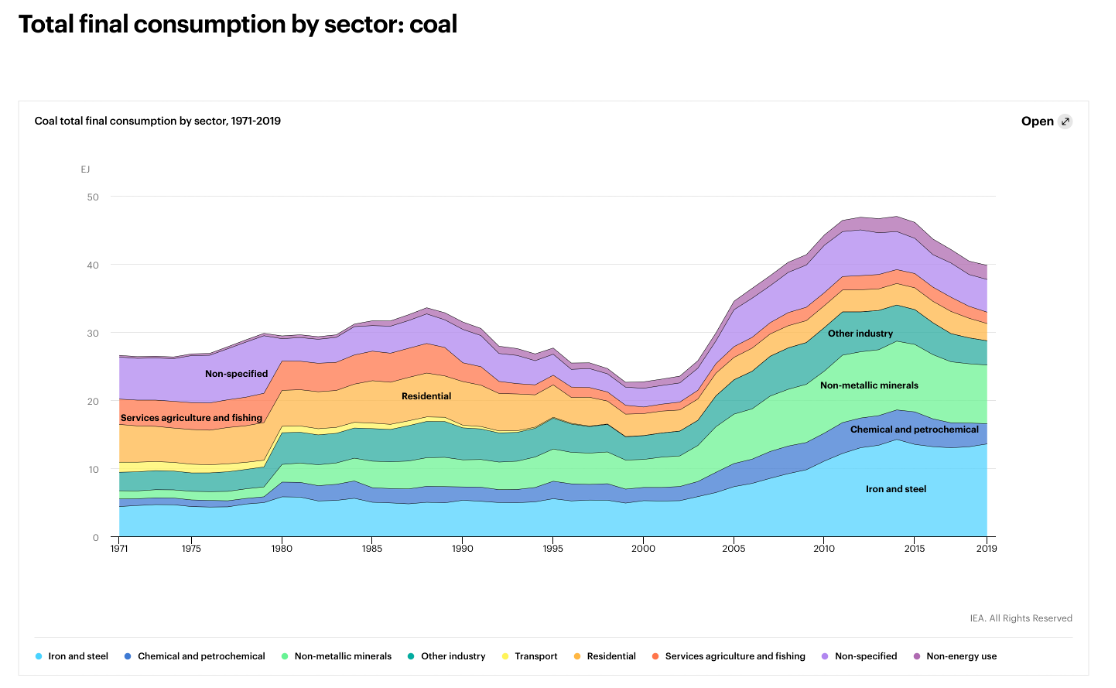
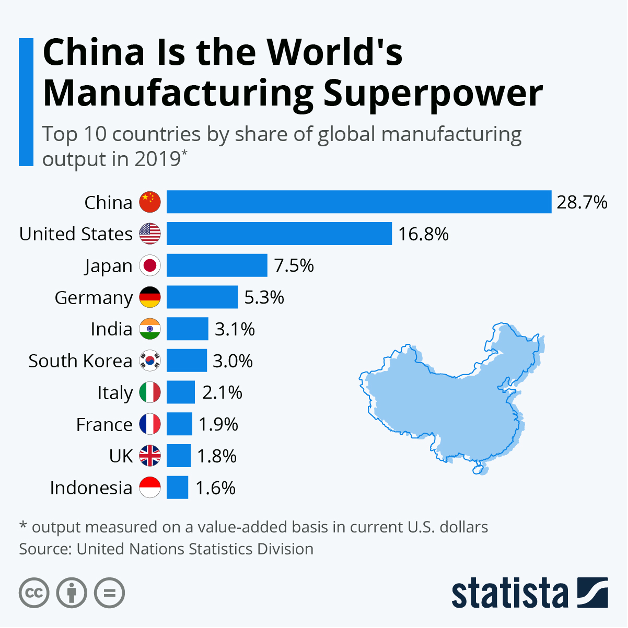
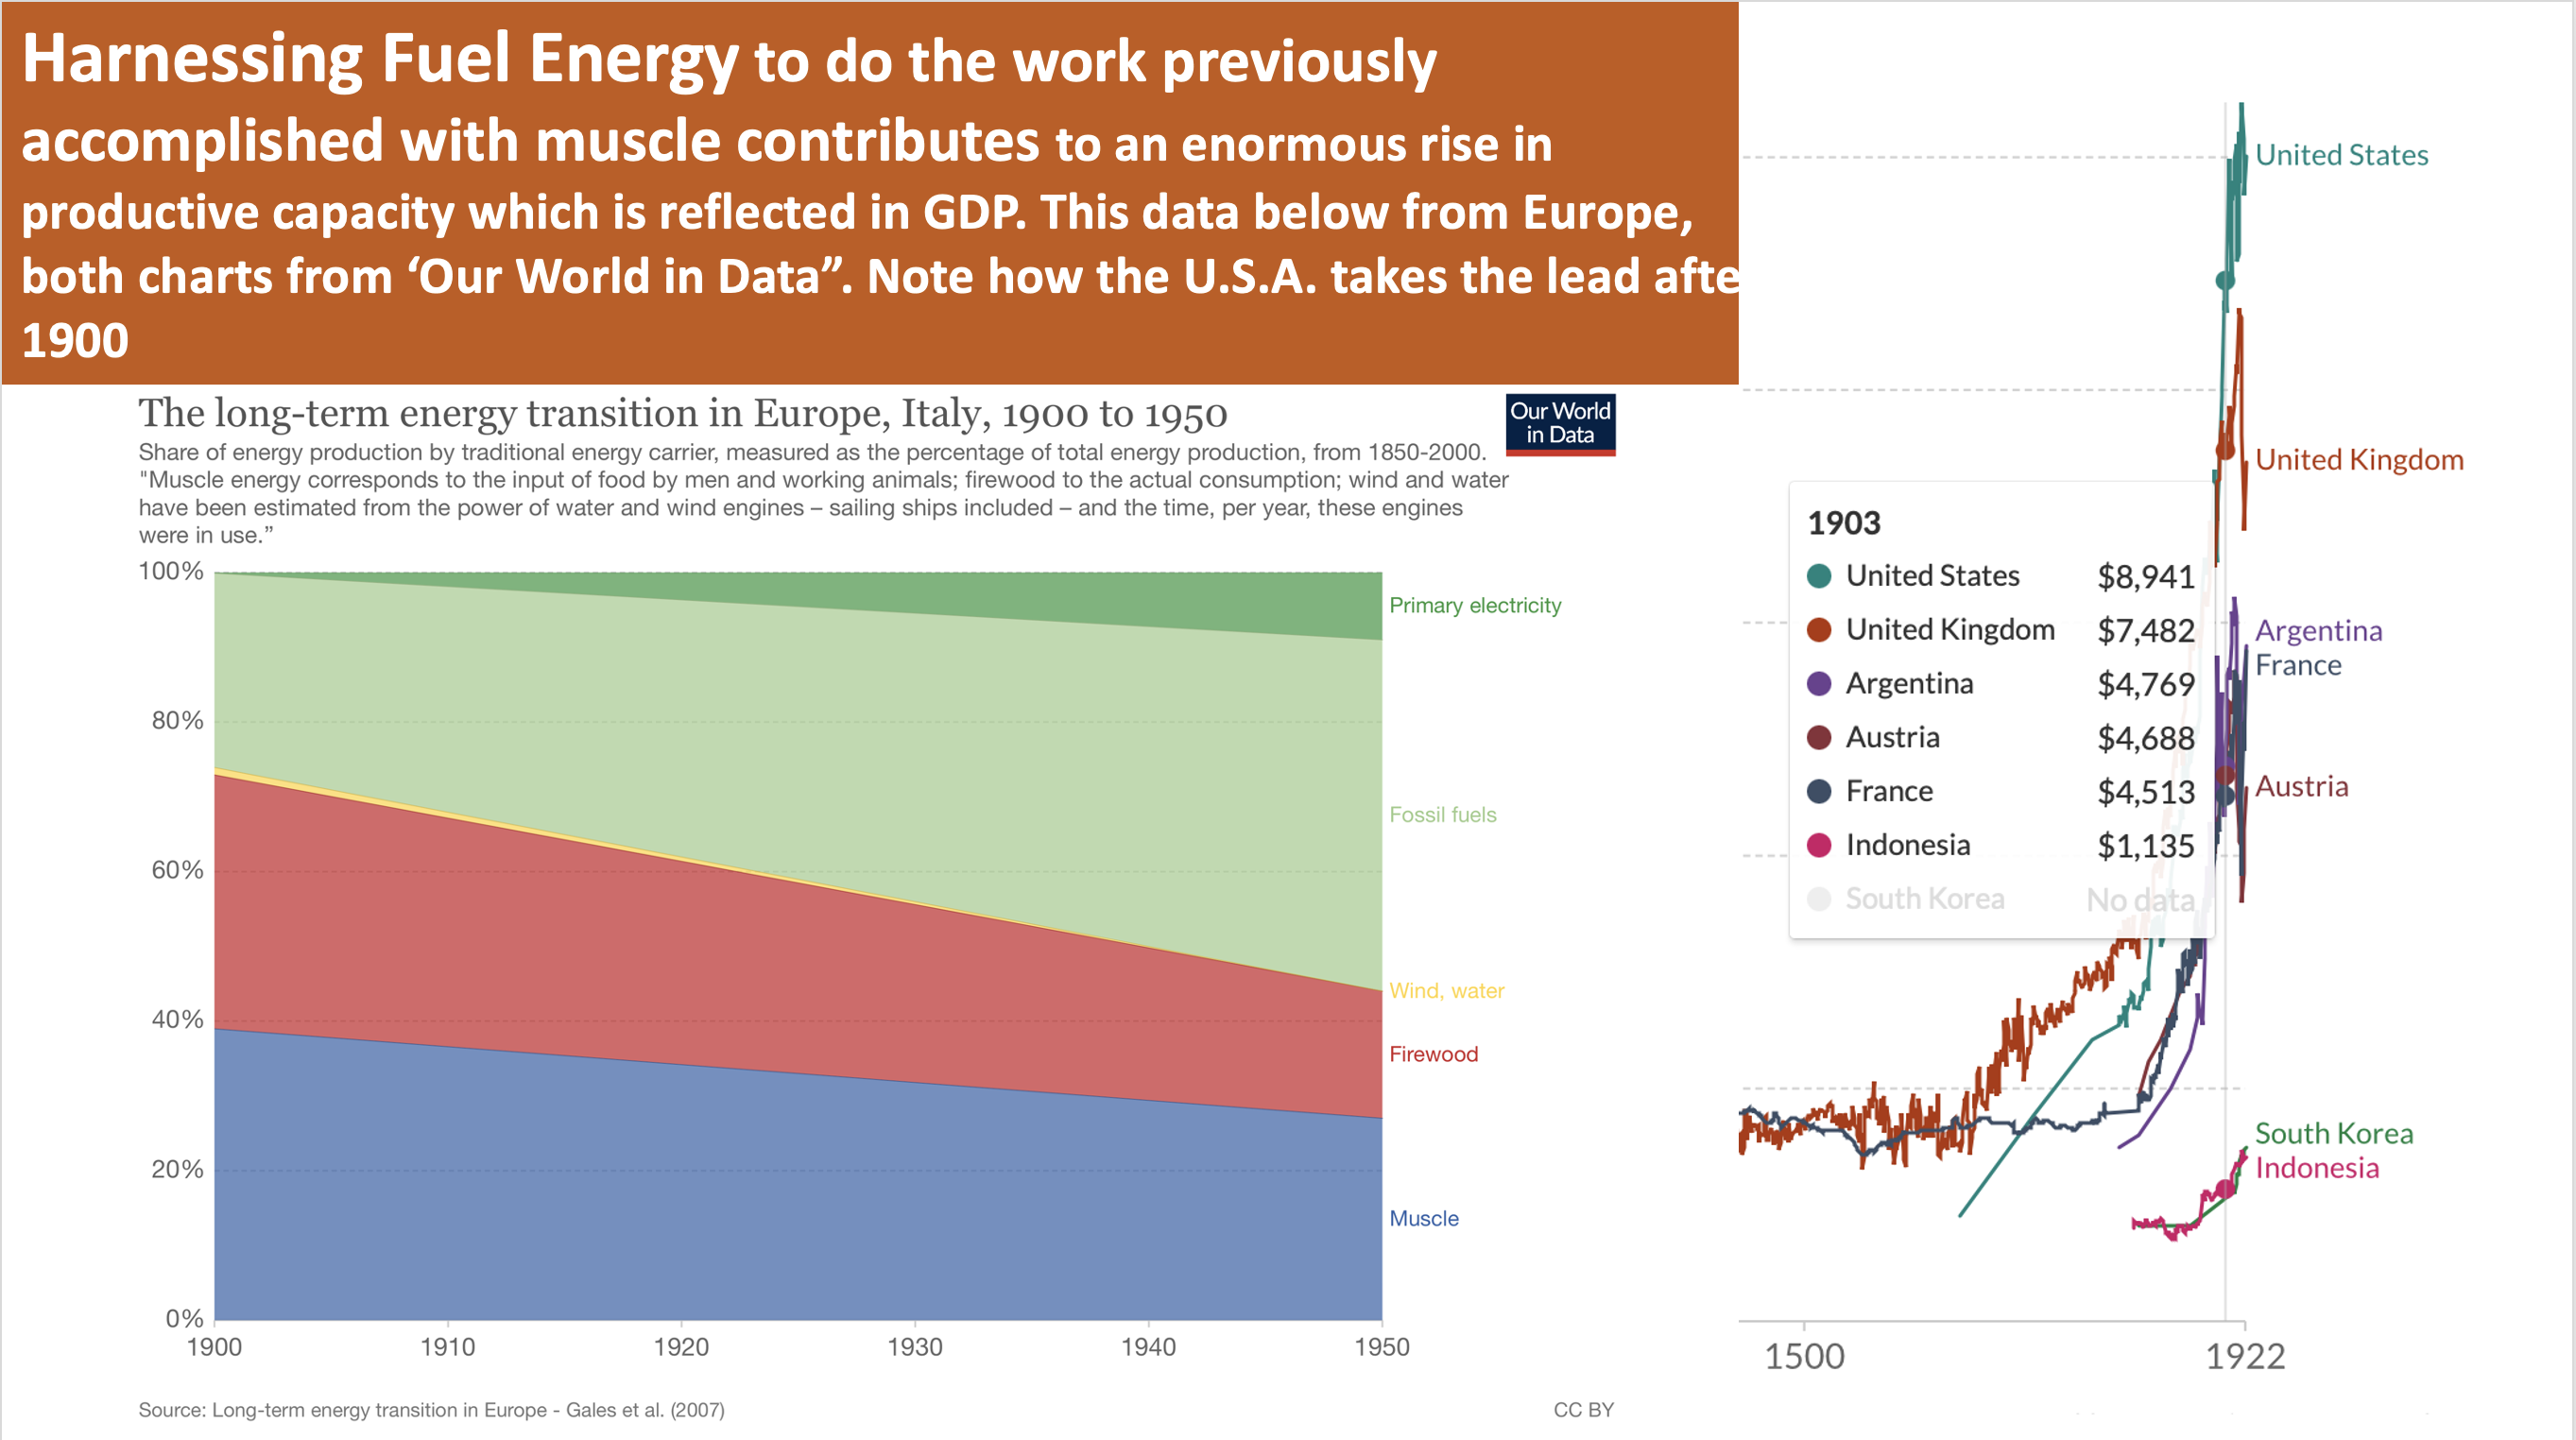
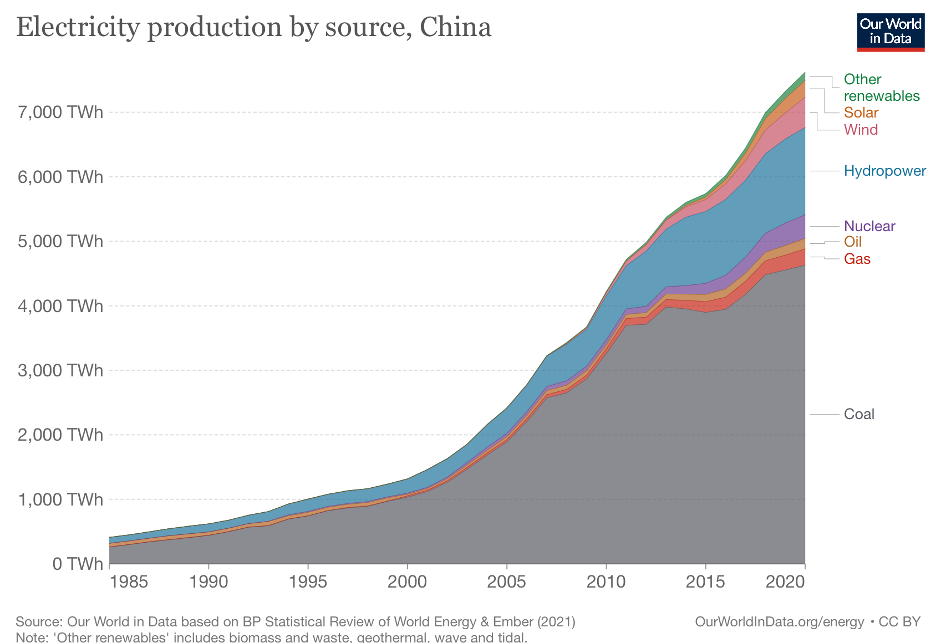
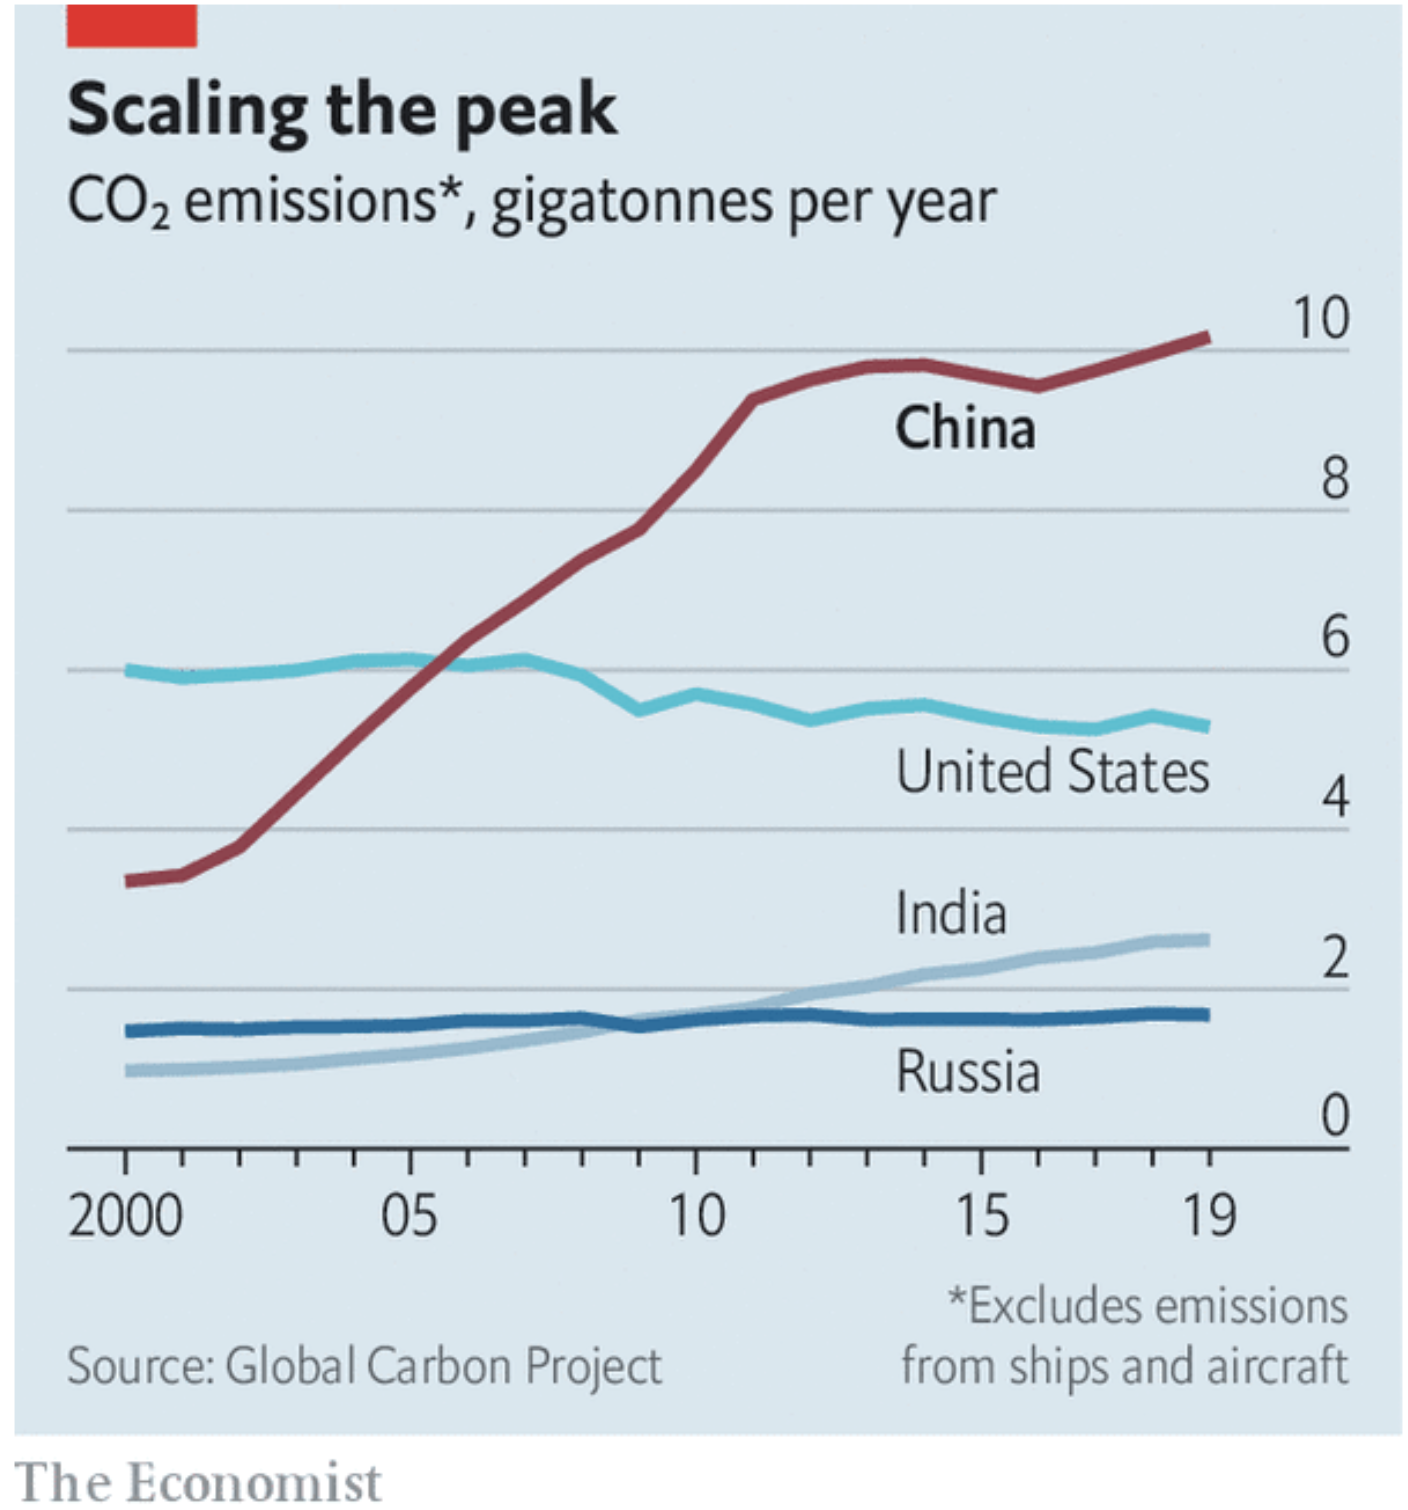
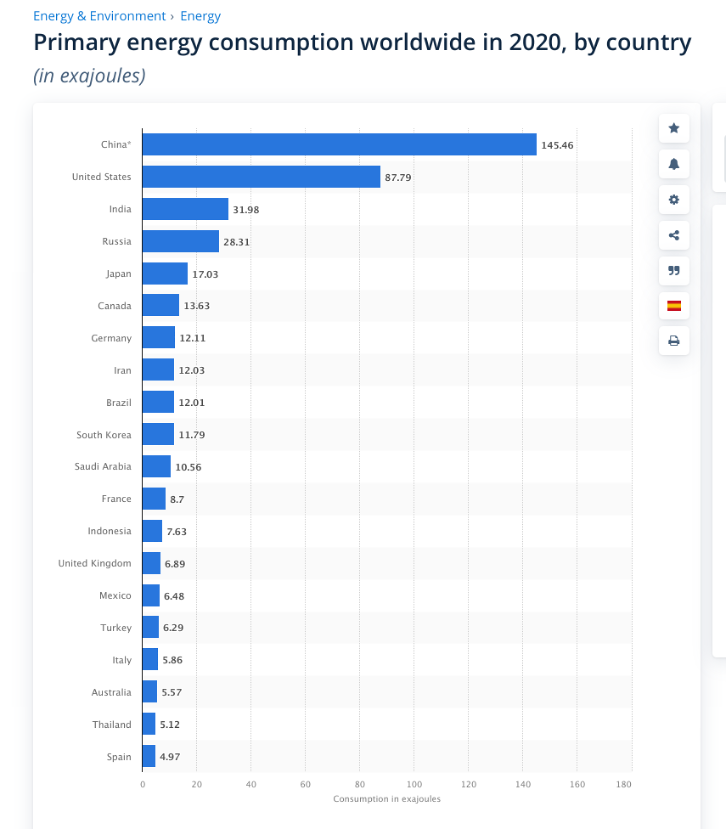
I began this essay on the priorities of the leaders of the world and the priorities they saw as top priority in November 2021. Well, if you think the Mainstream Media has been duped and indoctrinated then you are not alone. While the world’s media attention was on the War on Carbon, very serious problems were brewing and under-reported. Kindly take a look at the six charts below: 1. Total primary energy of the world, 2. Coal Consumption by Region, 3. CO2 Emissions of the World, 4. Total Energy by Source for China and 5. Total End Use of Coal Fuel for Products and 6. China, The World’s Superpower of Manufacturing.
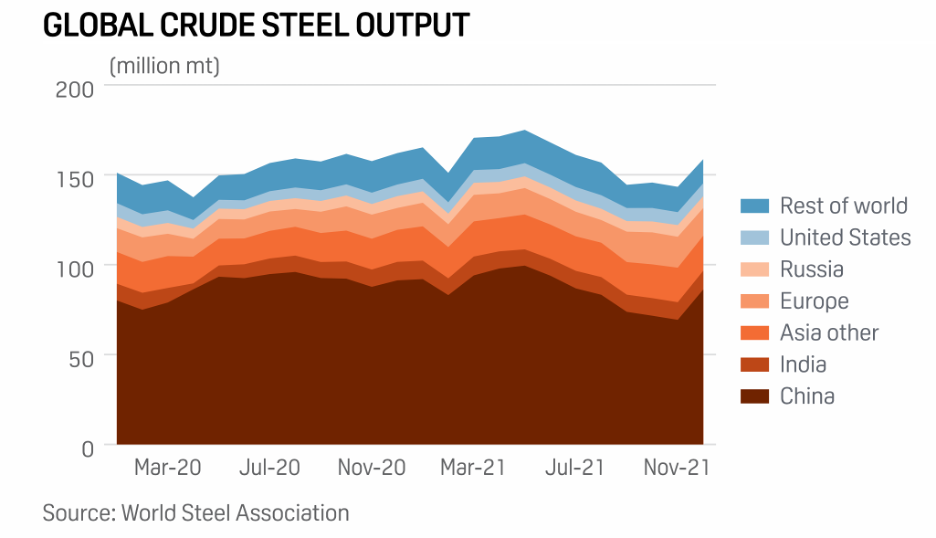
Over 50% of the world’s Fossil Fuel energy is being used by China to manufacture over 50% of the world’s steel, aluminum and just about every other product needed by the free world. These are easily verifiable facts reported by Our World in Data, IEA.org, the United Nations, EIA and Statista. Energy and Economic Prosperity are inextricably related.
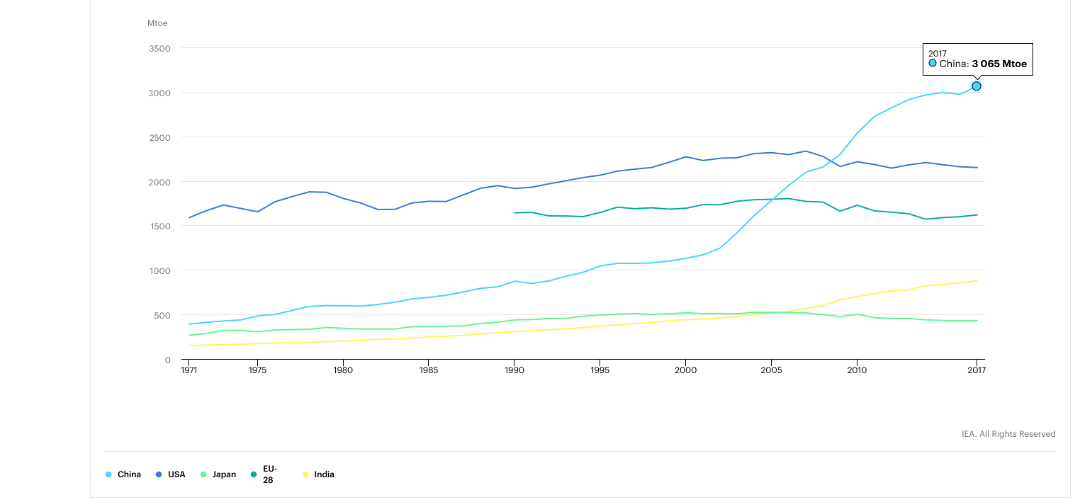


So what is driving the recent rapid increase in world CO2 emissions? According to the IEA, it’s mainly China:
The rebound of global CO2 emissions above pre-pandemic levels has largely been driven by China. . . . China’s CO2 emissions increased by 750 Mt over the two-year period between 2019 and 2021. China was the only major economy to experience economic growth in both 2020 and 2021. The emissions increase in China more than offset the aggregate decline in the rest of the world of 570 Mt between 2019 and 2021. . . . With rapid GDP growth and additional electrification of energy services, electricity demand in China grew by 10% in 2021, faster than economic growth at 8.4%. The increase in demand of almost 700 TWh was the largest ever experienced in China. With demand growth outstripping the increase of low emissions supply, coal was called on to fill 56% of the rise in electricity demand.(47)
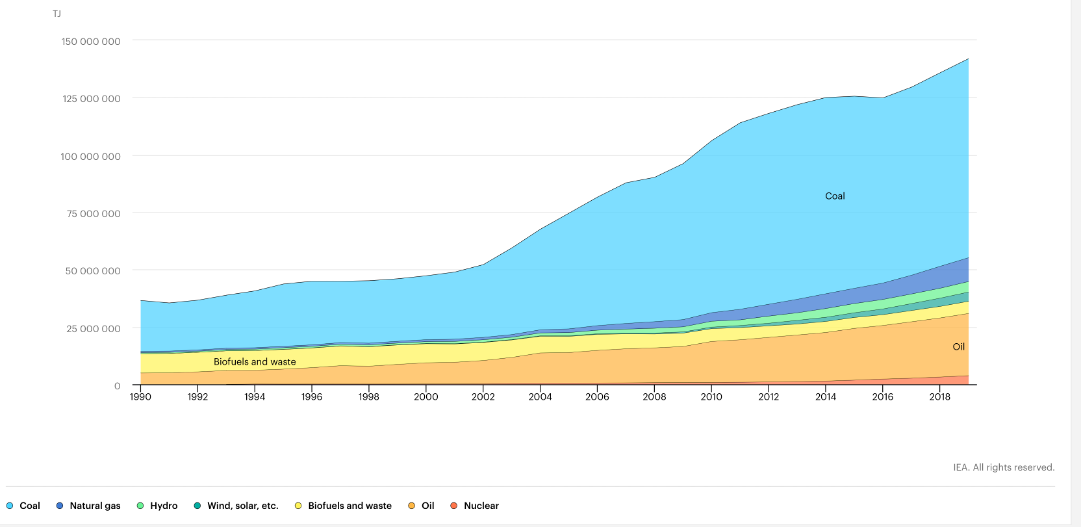
Total Energy Supply (TES) By Source, People’s Republic of China, 1990-2019
“The South China Morning Post” reported April 1, 2022, quoting “China’s Zhang Jianhua, chief of the National Energy Administration: “It signed an agreement to be supplied with 100 million metric tonnes of Russian crude oil over the next 10 years and a 30-year gas supply contract.
The world’s second largest economy suffered a nationwide energy crunch in September of last year amid local decarbonisation and energy saving campaigns, which has forced policymakers to adjust energy policies.
In the 14th five-year energy plan for 2021-25 released last week, Beijing said it would set annual crude output at around 200 million metric tonnes and lift natural gas output to more than 230 billion cubic metres from 205.3 billion cubic metres.
Coal and thermal power will remain the bedrock of China’s energy security strategy, Zhang wrote in the article.” (31)
The above is a direct quote from the SCMP, except the bold and underlining of the last line which was by me.
A recent post in WUWT stated, “China Continues To Laugh At Western “Green Energy” Foolishness”(47)
Why? The graphs above show China’s energy sources and growth in consumption. Economic prosperity is powered by Energy and China has used a lot of energy to become the world’s largest manufacturer.
Russia is the World’s Gas Station, China is the World’s Largest Manufacturer, Still think the UN Has it Right with the War on Carbon as their Top Priority?

China continues to power their mammoth manufacturing might with coal plants. We should remember our history, do you remember the term “The Arsenal of Democracy” when America provided the remarkable production of airplanes, tanks, guns, ships, arms and materiel to help the Allies win WWll? Some say “History Repeats”…..and if we switch to current events, Russia and China are very cozy with each other at this horrible time for Ukraine.
My point is that energy is a pre-requisite for economic prosperity. China gets it. China, Environmental Extremists, Socialists and Russia have duped the UN and the world leaders into believing the planet is imperiled by 0.041% carbon dioxide that is in the atmosphere. Meanwhile, China burns over half of the world’s coal to power their industries. Russia remains the world’s gas station and holds Europe hostage to Russia’s gas (and more) while the Green’s of Germany shut down safe, proven, reliable and reasonable production cost coal and nuclear power plants, making them beholden to Russian energy. This is nuts.
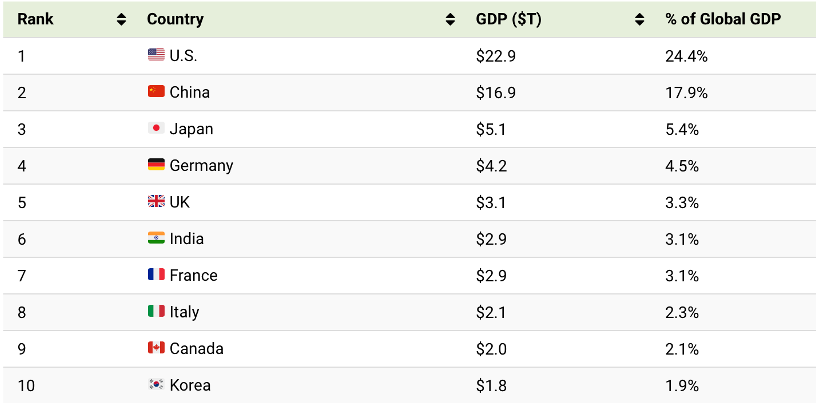
China has risen from a “Developing Country” in 2000 to the second largest economy in the world. They not only manufacture much of the steel, aluminum, rare earth minerals for batteries, solar panels and wind turbine components, they also manufacture much of the Pharmaceuticals used in the world and in the U.S. Have you tried to purchase a made in U.S.A. Drug lately? This brings me to banking. As a small businessman about thirty years ago, I remember how important banks were to sustain our business. To provide business loans for expansion, cover payroll until the invoice for products or services was paid and for conducting commerce in other countries. Banks and the size of banks is one metric to use to judge a country’s economic prosperity. China seems to me, to be pretty slick in their approach to dominating the world. They quietly support Russia and other rogue nations while they focus on producing products, acquiring world natural resources and taking over the world by using the weaknesses of Democracy & Capitalism to exploit their Financial muscle. Let’s take a look at China’s financial muscle. To be perfectly honest, the ranking of the world banks surprised me and I thought I kept up with world business news.
China and Banking
China now has five of the world’s ten largest Banks. Yes, being the world’s largest manufacturer has it’s advantages. It creates wealth which can then be converted into International Influence. The China “One Belt, One Road” or “Belt and Roads Initiative” is an example that is playing out around the world. Also, I am told by a financial expert, China holds about 4% of the U.S. Treasury debt.
A lot of people who have not run a business do not understand the need for working Capital. When a company cannot get loans to cover everyday costs or to finance future improvements they go out of business. We might ask some questions regarding the ESG Movement and Regulations that are pending with regard to discouraging or demonizing investments in fossil fuels (and suppliers to fossil fuel producers) by US investors. Is there a sinister, foreign influence side to the ESG movement and Federal Regulations? Here is the list of the top ten banks of the world. Yes, five of the top ten are Chinese.

My point is, manufacturing requires lots of energy. Especially primary metals and heavy manufacturing. As seen from the graphs above, China has grown enormously in manufacturing capacity since they entered the WTO in 2001. To put it in perspective, China built more electric generation capacity in twenty years than the U.S. did since the days of Thomas Edison and George Westinghouse 100+ years ago.
Getting back to finance, did you catch the small news item last week? As it is related to energy, Saudi Arabia is considering acceptance of the Chinese Yuan for oil and China will be pushing to use other currency than the USD as they continue to grow their economy. (50)
Let’s Review the Sources of the Dependable, Dispatchable and in 2020, Reasonable Cost Energy that We Depend On
If you take what you see in the newspapers and on TV seriously, you would think that we only have a little way to go to convert our economy to zero carbon. This is not true!
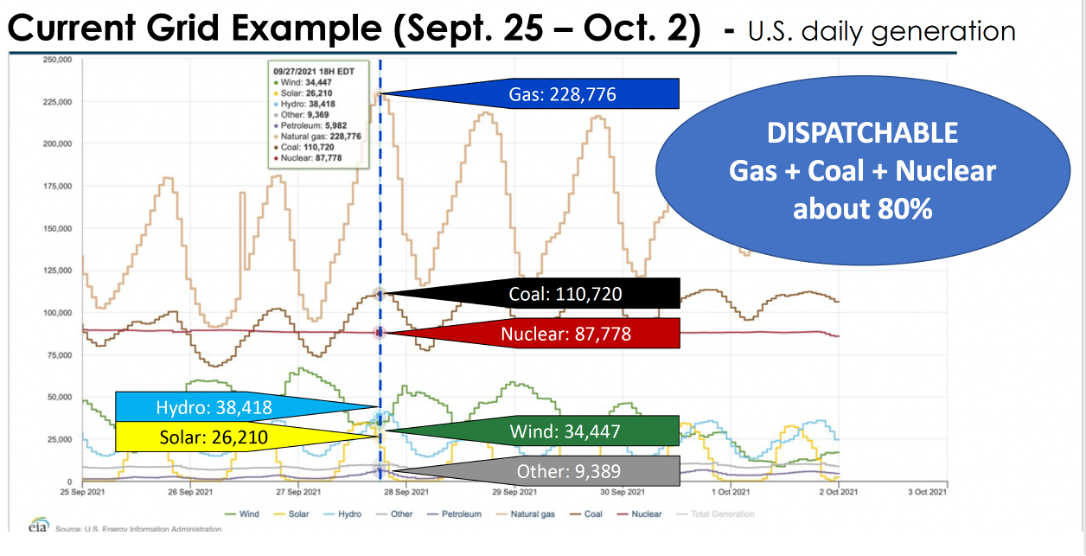
I cite the example of a usually conservative Newspaper, the Wall Street Journal. This is a screen shot of a video they had last year which was based on facts, but at the same time misleading the public on the success of “Green Energy”.

Yes, the 90% of “NEW GENERATION” in 2020 was Renewable, but the true useful energy production was less than 4% of the total energy provided to the U.S.A.
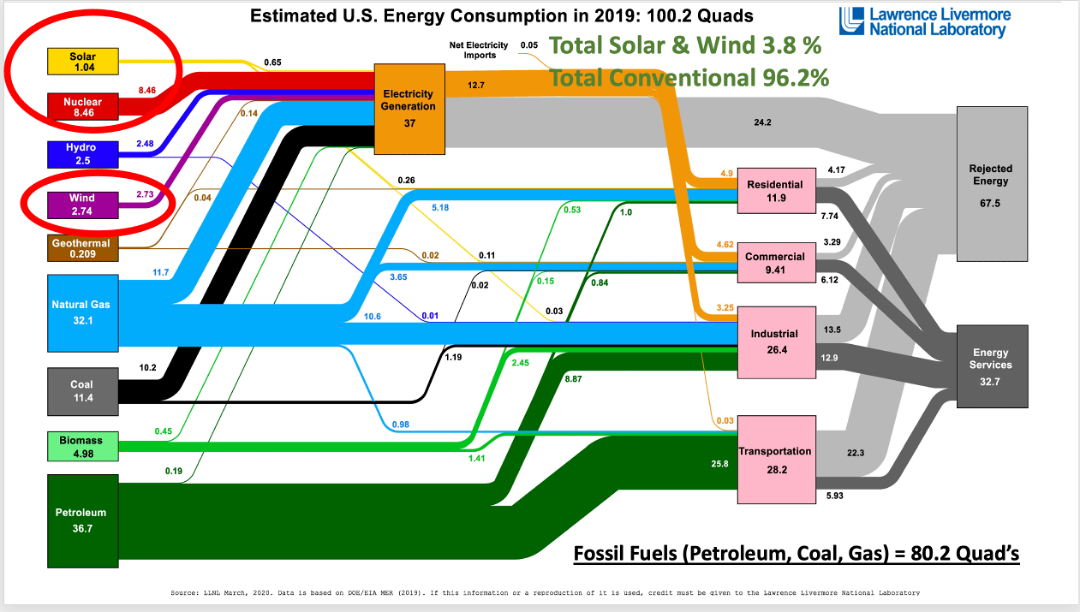
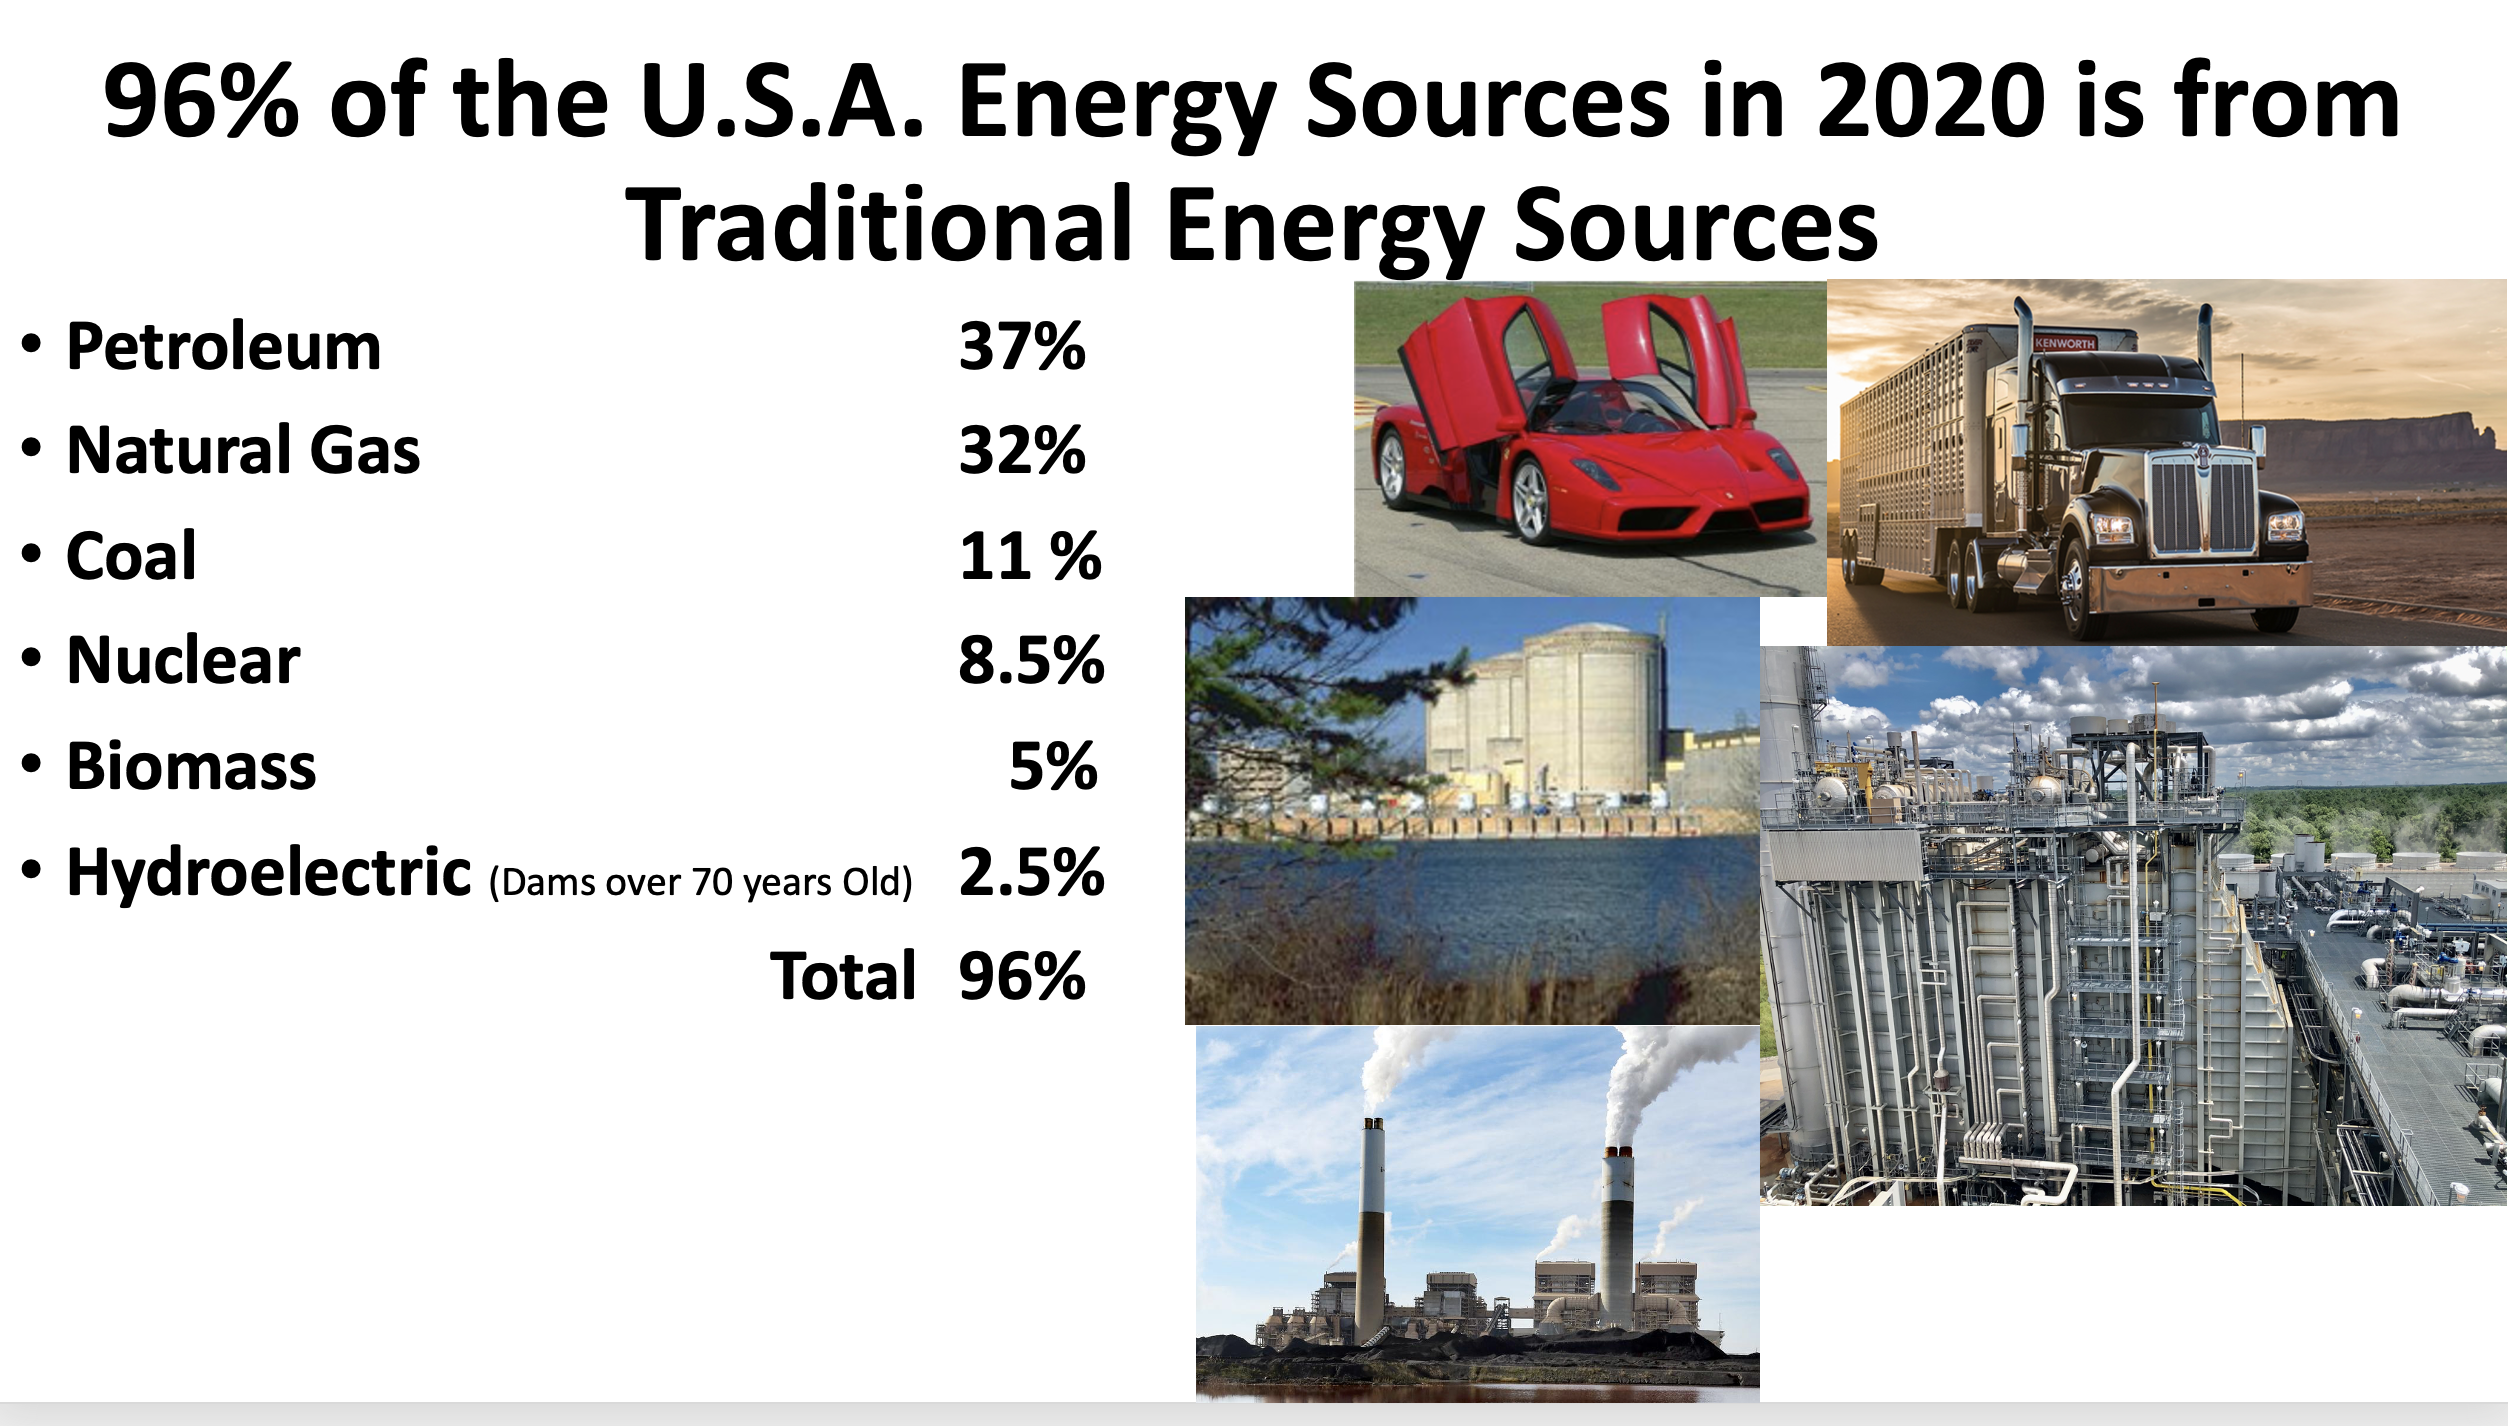
This is a reminder, over 90% of America’s energy is provided by conventional fuels such as oil, natural gas, coal, nuclear, waste to energy, biomass and old hydroelectric power stations. The Lawrence Livermore Labs Sankey Diagram, in my opinion, is the best single illustration to show true energy flows from the sources to end use. It is copied below for the year 2019. This is simply the true facts of where we obtain our energy:
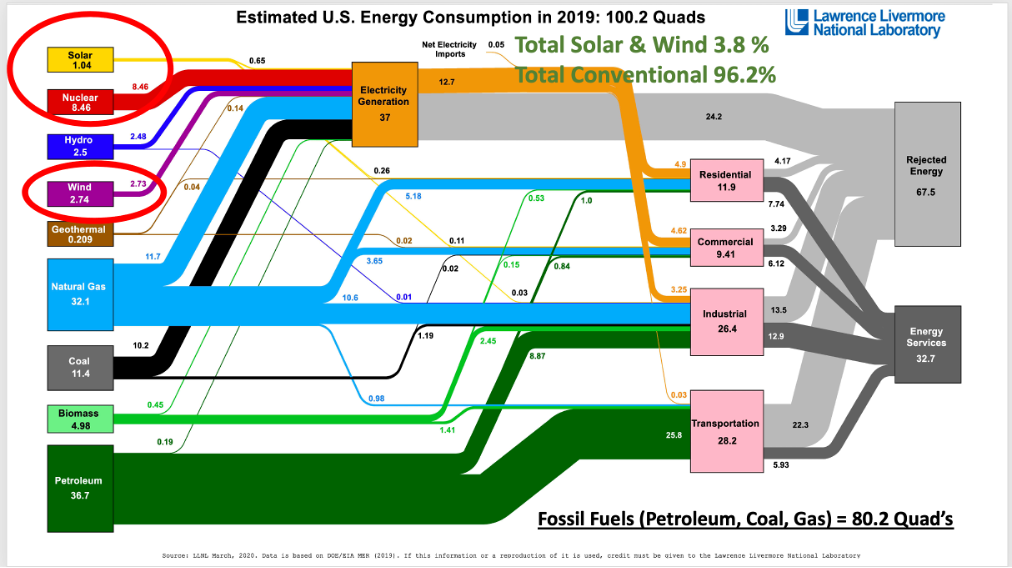
America has been using right at 100 Quadrillion Btu’s of energy for decades. The next chart below, shows the historical energy use from 1950-2019. This is a useful chart to consider the transfer of energy from fossil fuels to electric vehicles. Notice that only 3.78% of our Total Energy was provided by solar and wind in 2019. Now imagine the futility of replacing the 37% of our Total Energy now provided by petroleum, with EV’s. The Government Net Zero Carbon plans to replace not only the petroleum but also Natural Gas and Nuclear. The Total Energy supplied by Petroleum is about 37%, Gas 32%, Coal 11.4% and Nuclear 8.5%. These “Conventional sources of energy total 88.9%. Replacing this energy with renewables by 2030 or even 2050 will require an enormous technological breakthrough. The government should not promote policies based on miracles.
To keep our same freedom and high quality of life, it requires each of us 331 million Americans to utilize an average of about a million Btu’s in energy each day. Averages are often misleading, consider the millions of Btu’s used by the world elitists that traveled to Scotland for COP-26. My understanding is that there were over 400 private jets and that the fuel used for these delegates exceeded the total petrol used by Scotland for an entire year. That should provide a clue regarding the sincere interest of the participants in the UN Climate talks to save the planet. It is reasonable for each of us living in the Developed World to continue using our allotment of about a million Btu’s of energy each day.

My Suggestion, On How to Fix this Energy, World Peace and Food Supply Mess
The War of Carbon in my viewpoint is contributing to International conflicts and harming world peace. If Joe Biden would rescind most of his Executive orders including drilling on Federal Lands, Building the Keystone Pipeline and scrapping the Paris Climate Agreement, it would, in my opinion, contribute to world peace and much more. (1,2,3,5,13)
The Biden administration is testing new depths of mind-blowing political dysfunction, by begging OPEC for more oil, while at the same time maintaining their attack on the US domestic oil industry. (28) Speaking of attacks on the energy producers that we depend on…..
ESG, One of America’s Self Inflicted Roadblocks for a Sane Energy Policy
The (ESG) movement is harming U.S. productive capacity of conventional fuels that are needed. (See above Sankey Diagram to show what we need) These actions are pushed by environmental groups, by government and by big business. (33, 34, 35, 36, 37, 38, 39, 40) These ESG punitive actions have been ramped up, such as Biden’s “Whole Government Approach to Climate Control Policies” with involvement of the Securities and Exchange Commission, the EPA, IRS Tax policies and more.
Meanwhile, NGO’s also are attacking US Energy producers. Does this look to you like it could be coordinated with America’s world competitors or enemies? It does to me. Check reference #44 entitled, “What Divestment From Russia Means for Activism Against Fossil Fuels” then the sub title: “It’s time to scale up fossil fuels divestment”(44). When 80% of the energy we depend on is from oil, gas & coal, does this seem like a Patriotic and good action? Not in my book. Another excellent reference on the good that Fossil Fuels do to keep America strong and to improve the quality of life for all of the people of the world. The publication by Liberty Oilfield Services is entitled “Bettering Human Lives, 2020 ESG Report”(45)
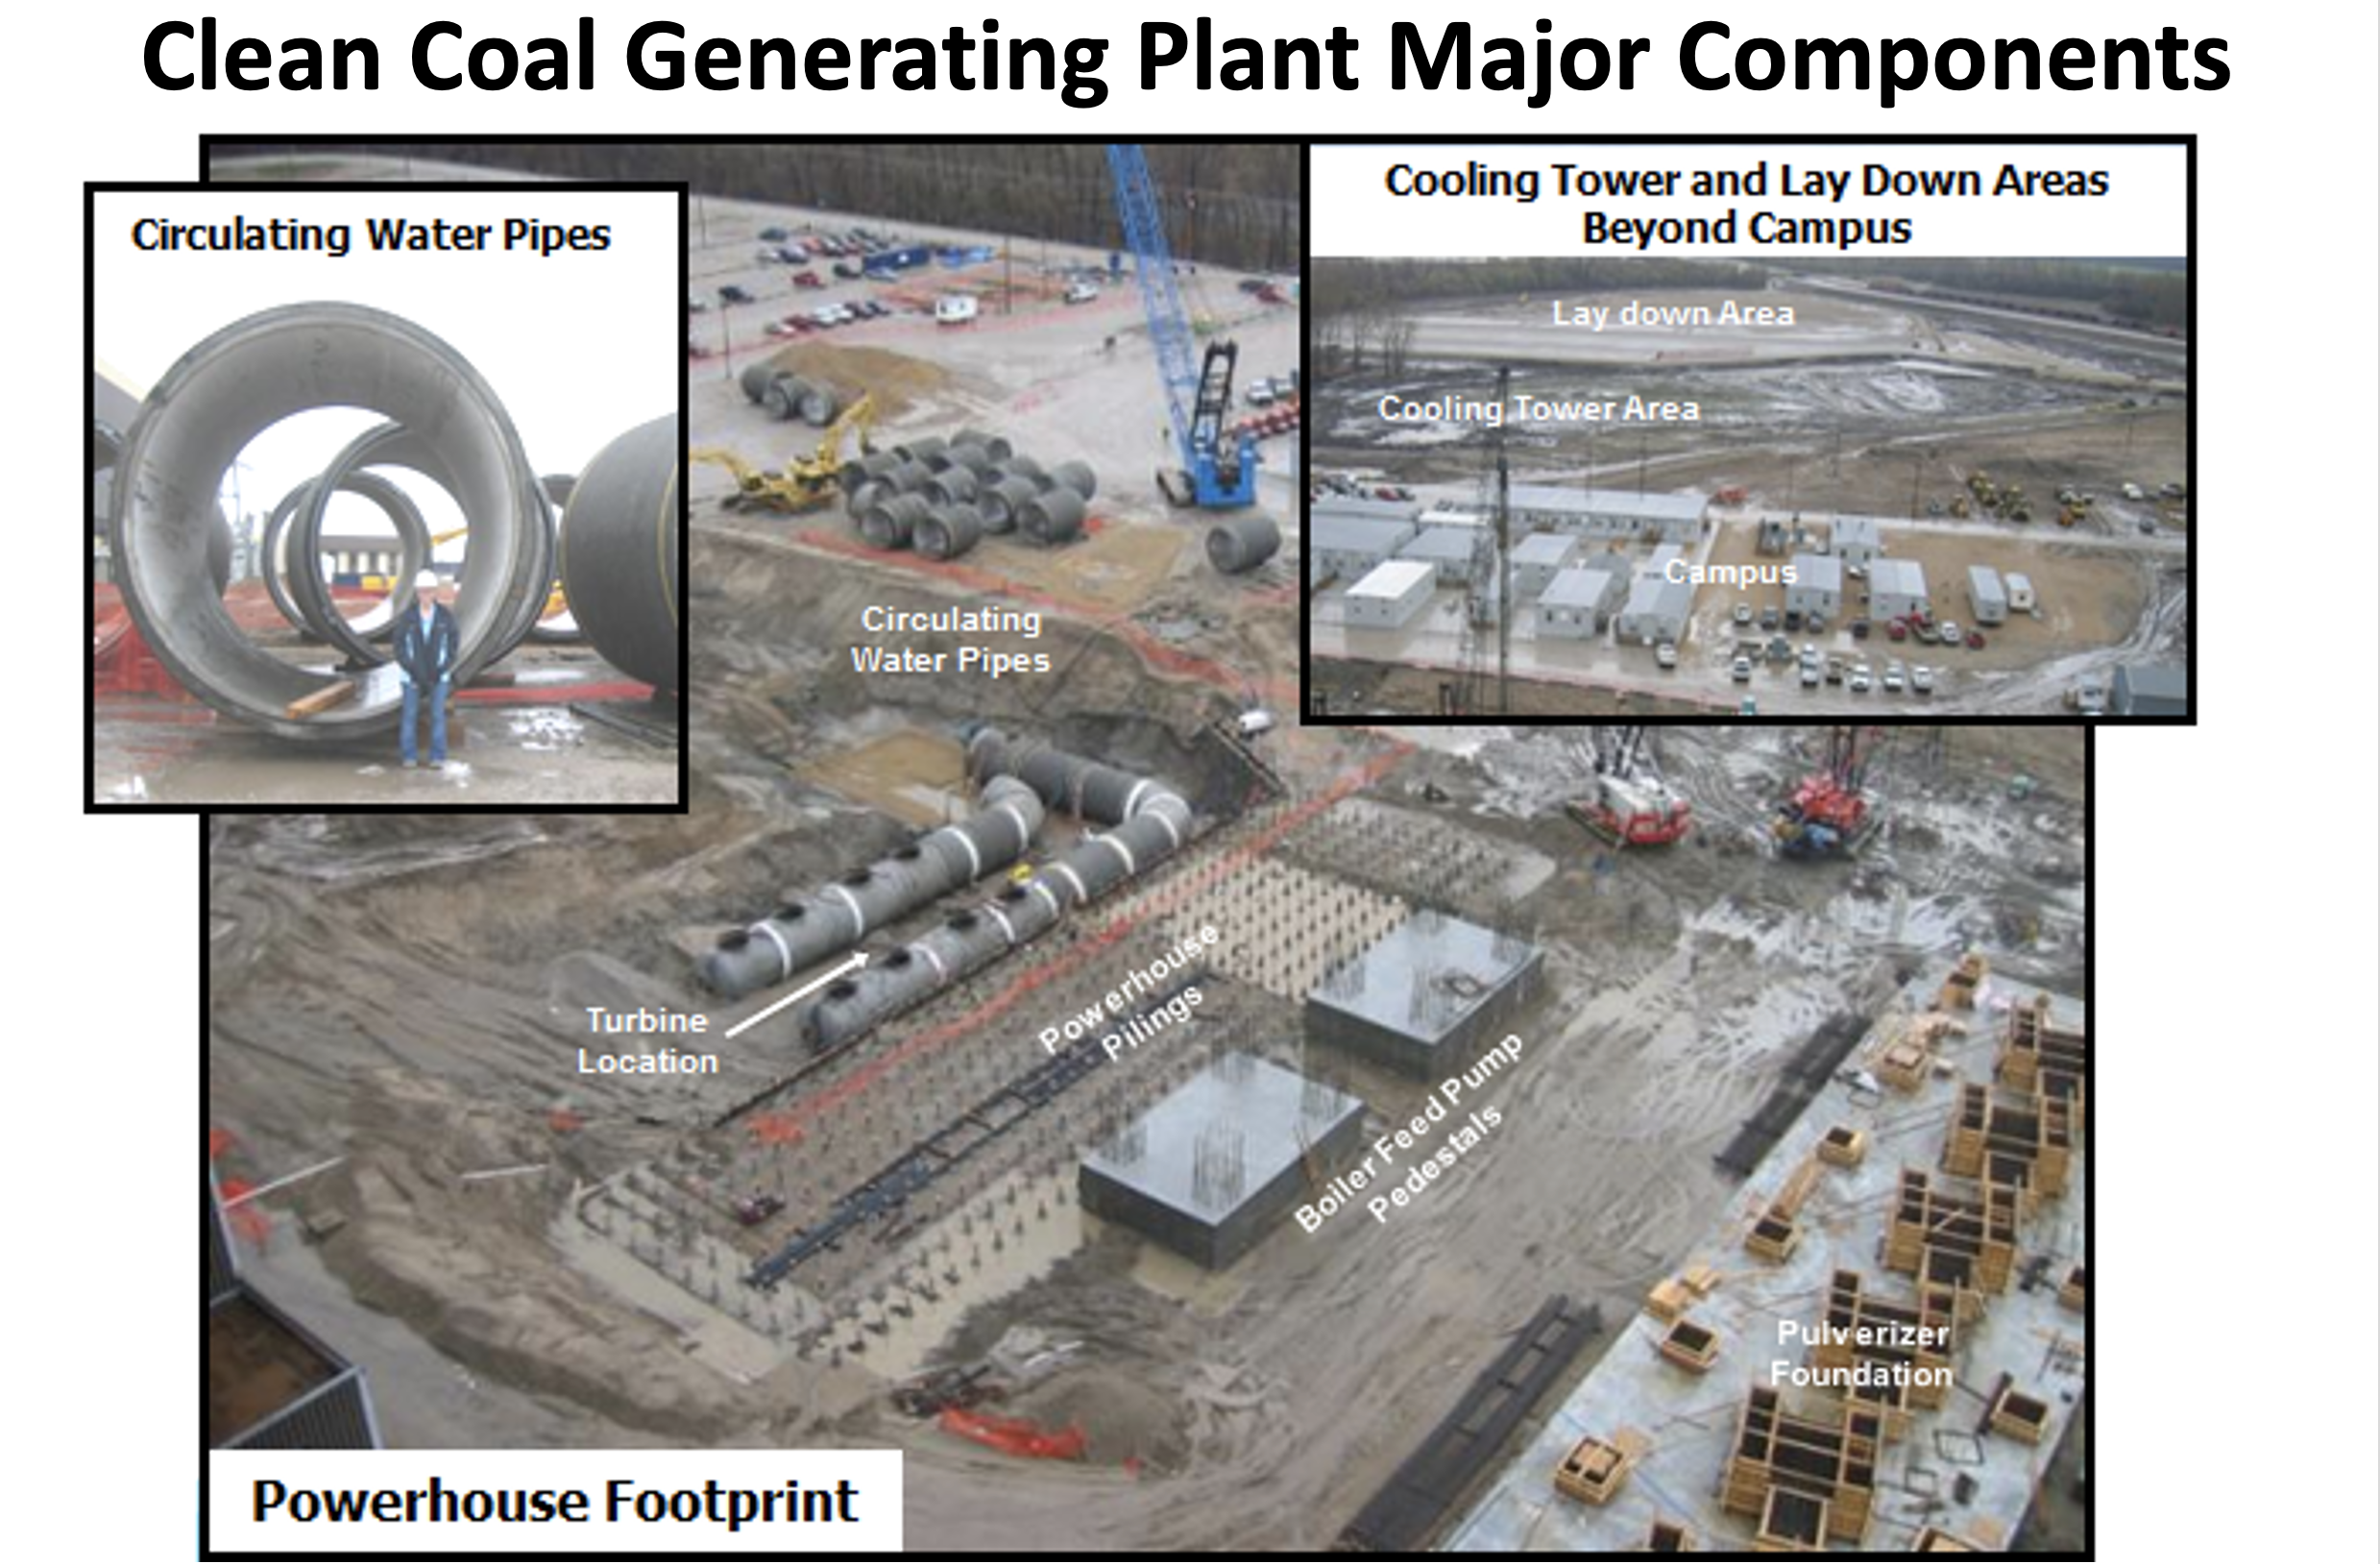
It could be argued, that keeping America energy independent and the Free World less dependent on rogue nations is important for national security. Look at the mess Europe is in now with their dependence on Putin’s Russian natural gas. The Greens helped push Europe toward Green Energy and they are working hard here in the US too. The environmental extremists were successful in stopping all major new coal plants from being constructed in the US since about 2012. The last major Utility scale clean coal plants I am aware of are Turk in Arkansas and Longview in West Virginia. Even then to obtain operating permits, the environmental extremists were paid off in settlements. These settlements were millions of dollars.(46) Quite honestly, it is extortion which was enabled by the US government. How does this make America stronger and more energy independent?
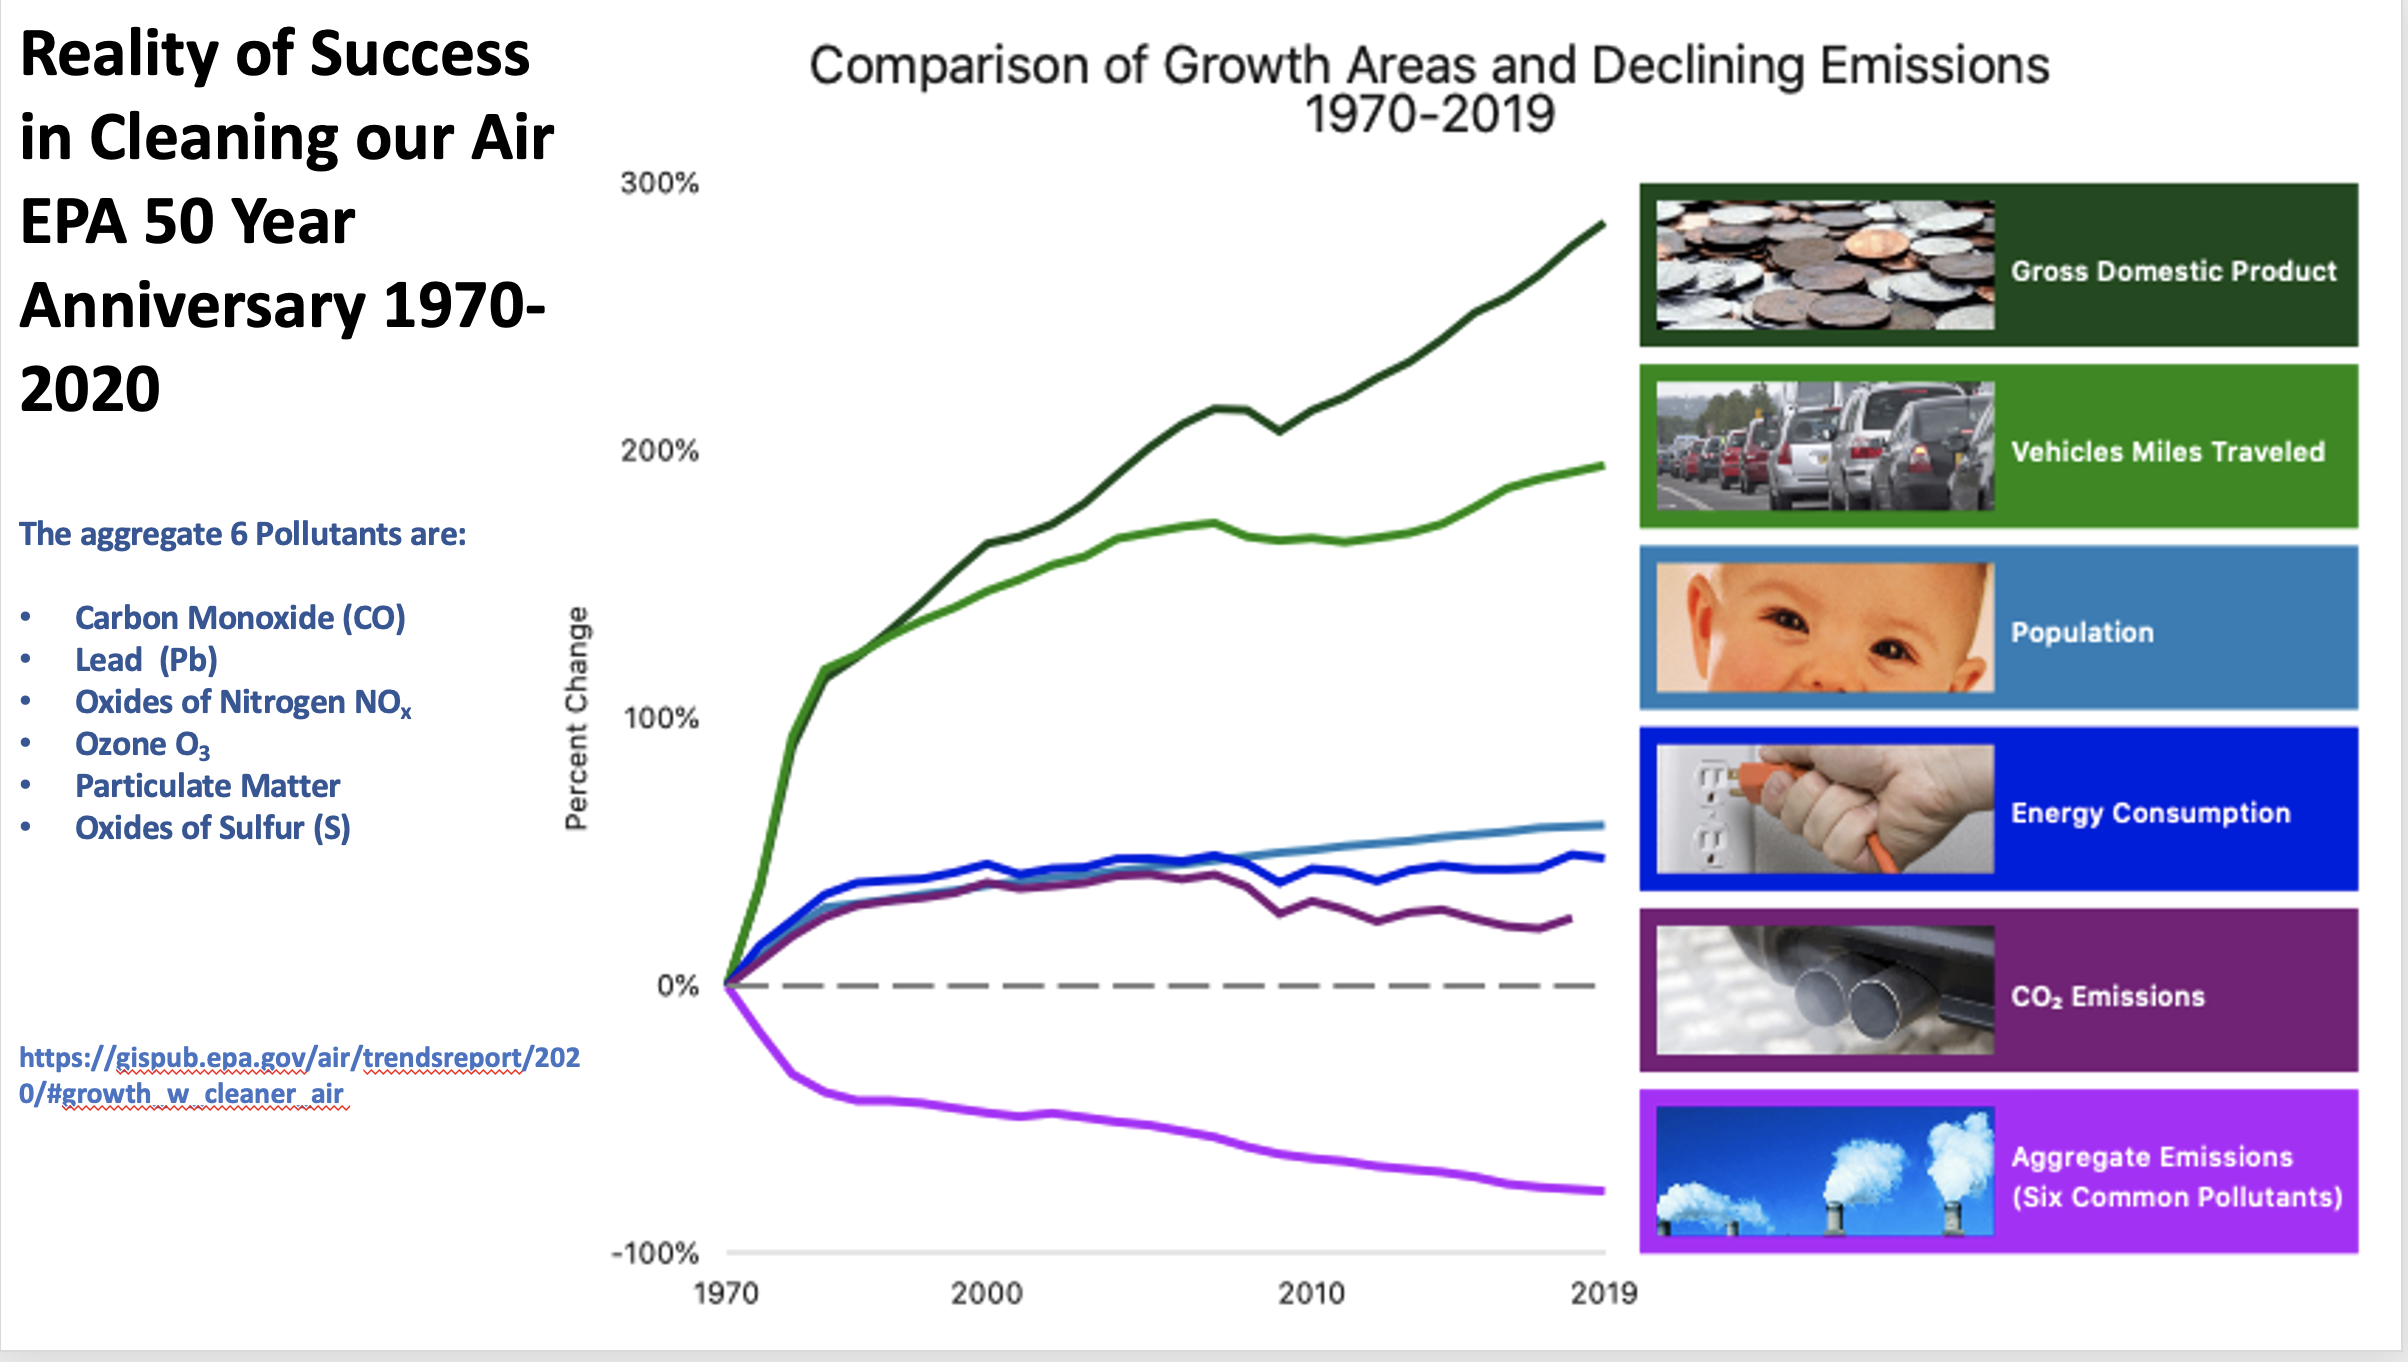
How About Clean Air?
Before Biden’s Executive orders to push America toward intermittent green energy, our air was and remains amongst the cleanest in the world. The EPA Graphic copied below shows the trends of cleaner air from 1970-2020. This is regarding the six major pollutants that are a real threat to health. I just like everyone else enjoy and appreciate clean air and clean water. I also like my freedom and the American life style that I have enjoyed all of my life.

From my personal experiences of traveling around the world, I can honestly say America’s air is as clean or cleaner than most other countries that I have visited either on business or pleasure. Note the EPA chart above does show the increases in population and GDP from 1970 to 2019, as the six aggregate named pollutants were steadily reduced. There does come to be a point of diminishing returns on air pollution controls just like most other problems. That is, unless you are a Bureaucrat and wish to keep making more and more and stricter yet Regulations. That is the case, in my opinion of the restrictions on CO2 and the Net Zero Carbon and Extreme Green policies. These Regulations and Executive Orders are harmful for American competitiveness and harmful for Peace and Prosperity of the world.
Conclusions
- The Net-Zero Carbon Climate Policies are contributing to turmoil in the world by weakening America and NATO Allies. The Paris Agreement for working toward Net Zero Carbon is politically driven, not by concern to save the planet.
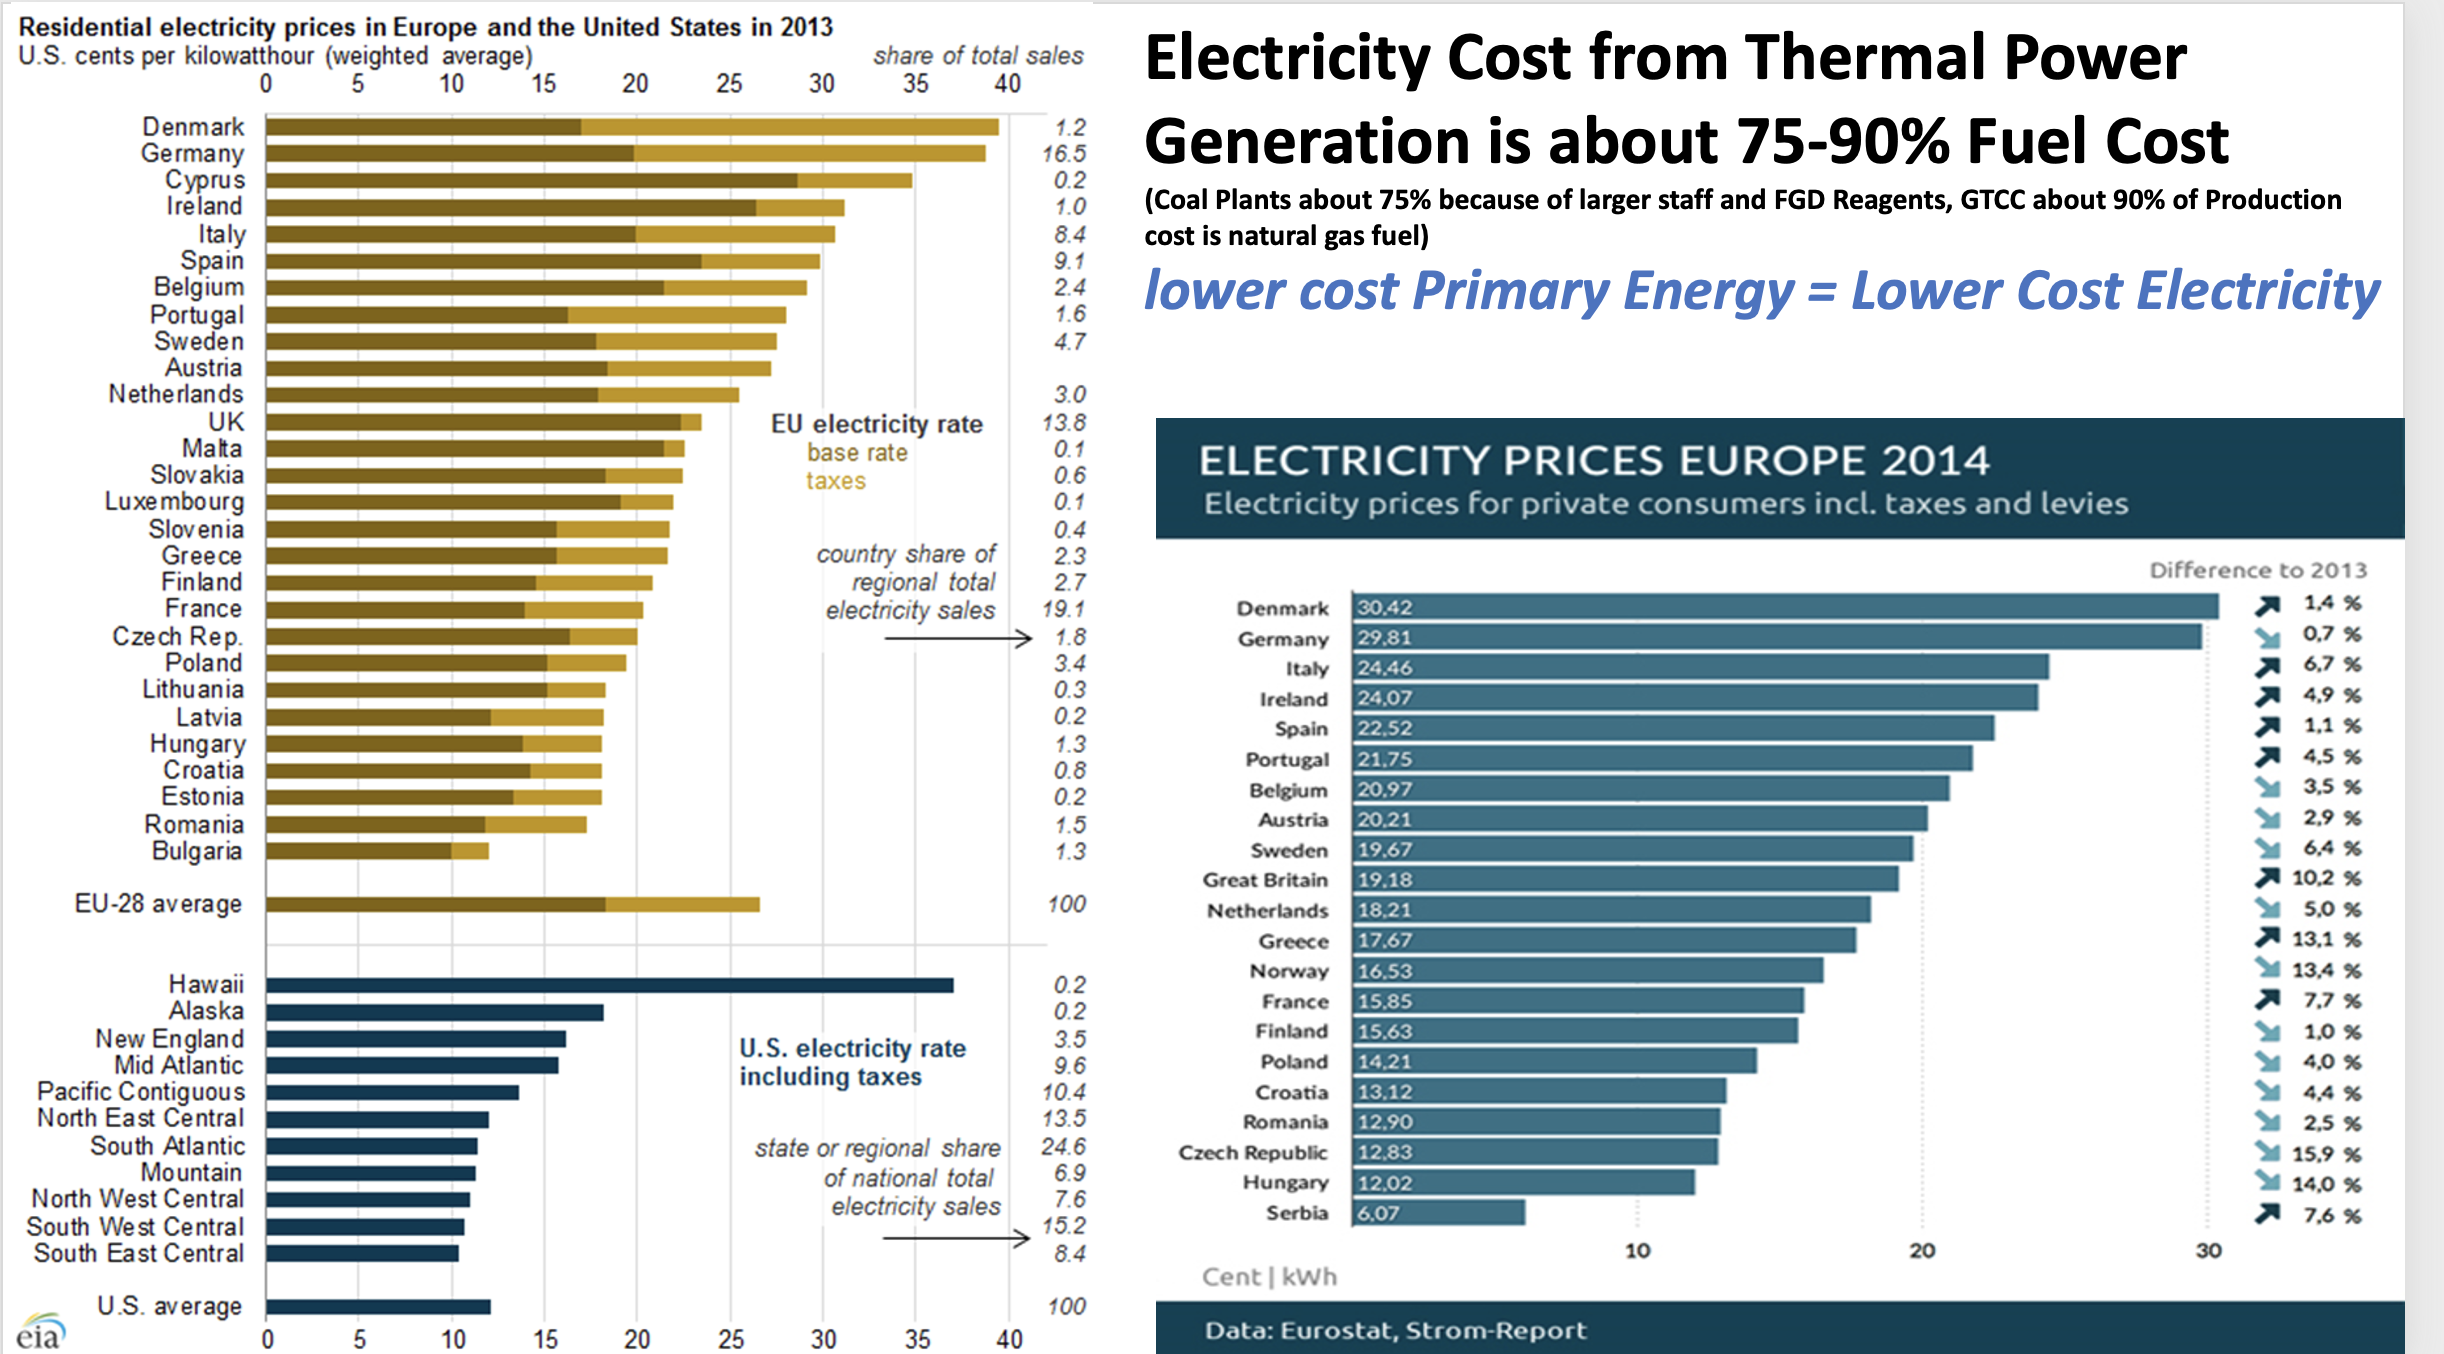
- The Green Energy Movement in Europe should be an example for the U.S. to learn from. They have had extreme cost escalations and, in some cases, rolling blackouts.
- Conventional Fuels of Natural Gas, Coal, Oil, Nuclear, Hydroelectric and Biomass provide over 90% of our energy. Ramping up Renewable solar and wind from about 4% to 100% is unrealistic and impossible to achieve without technological breakthroughs.
- The ESG Movement (Environmental Social and Governance) is Discouraging needed investments in oil and gas production as well as harming most all Energy Producers. Check references 33 through 39 for more details.
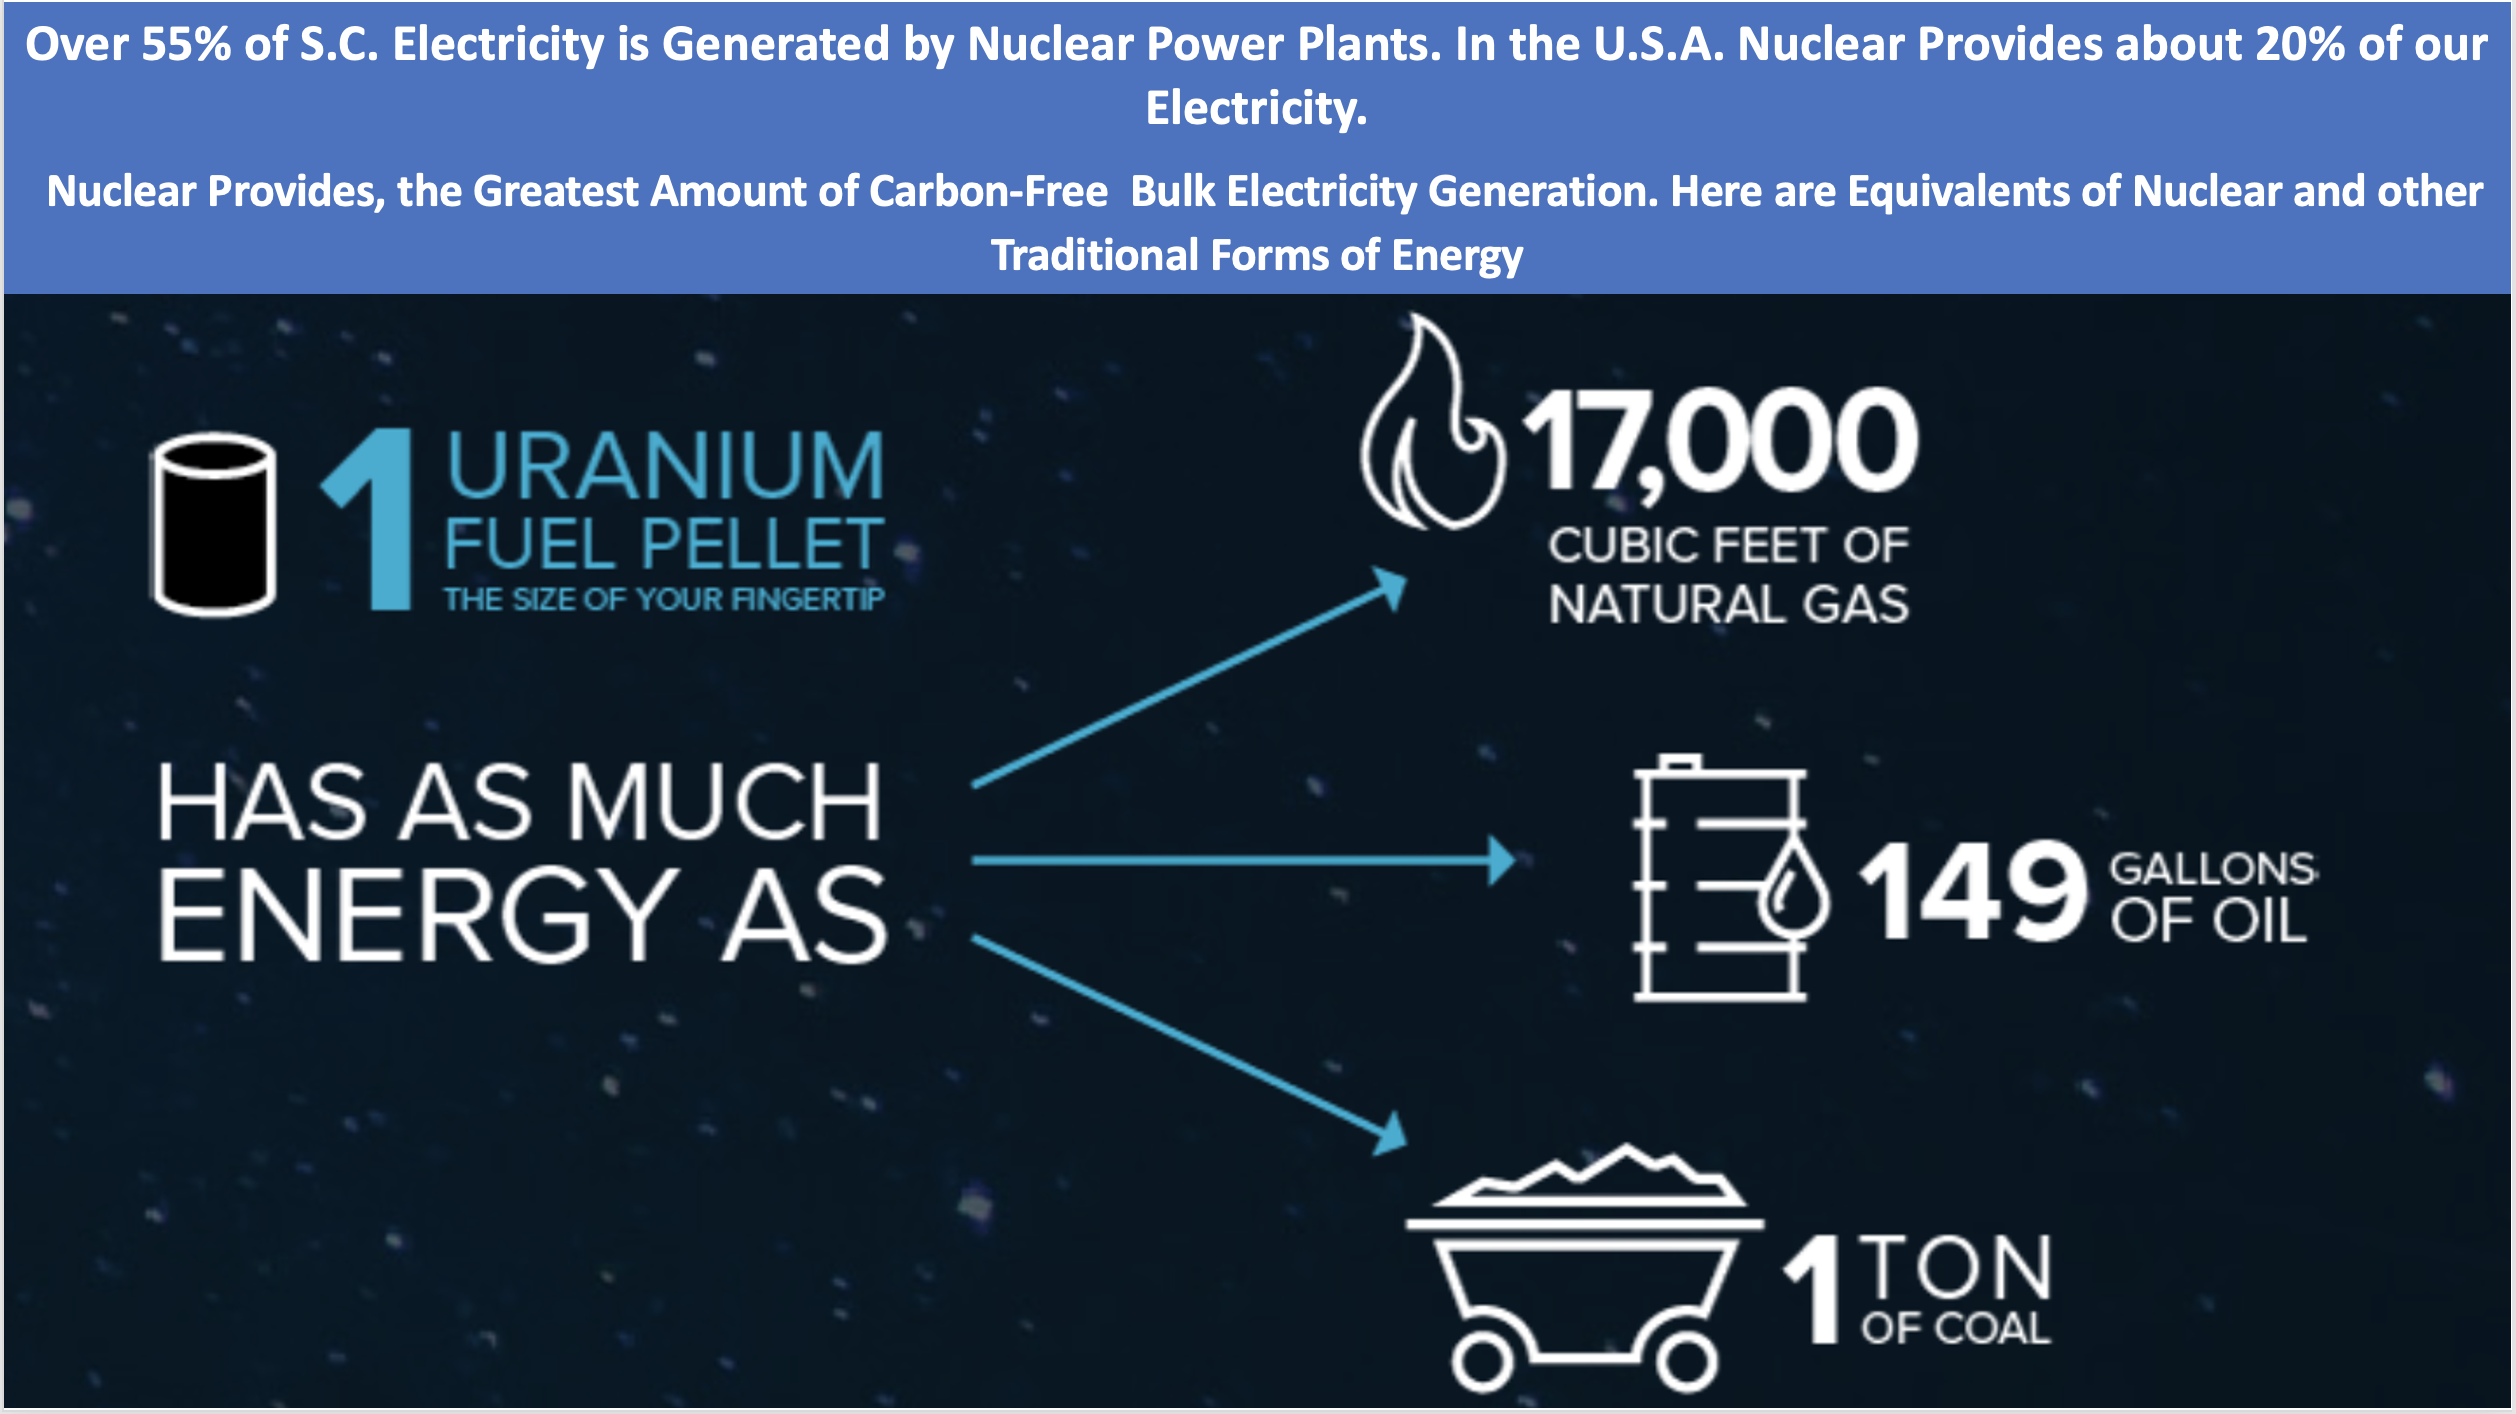
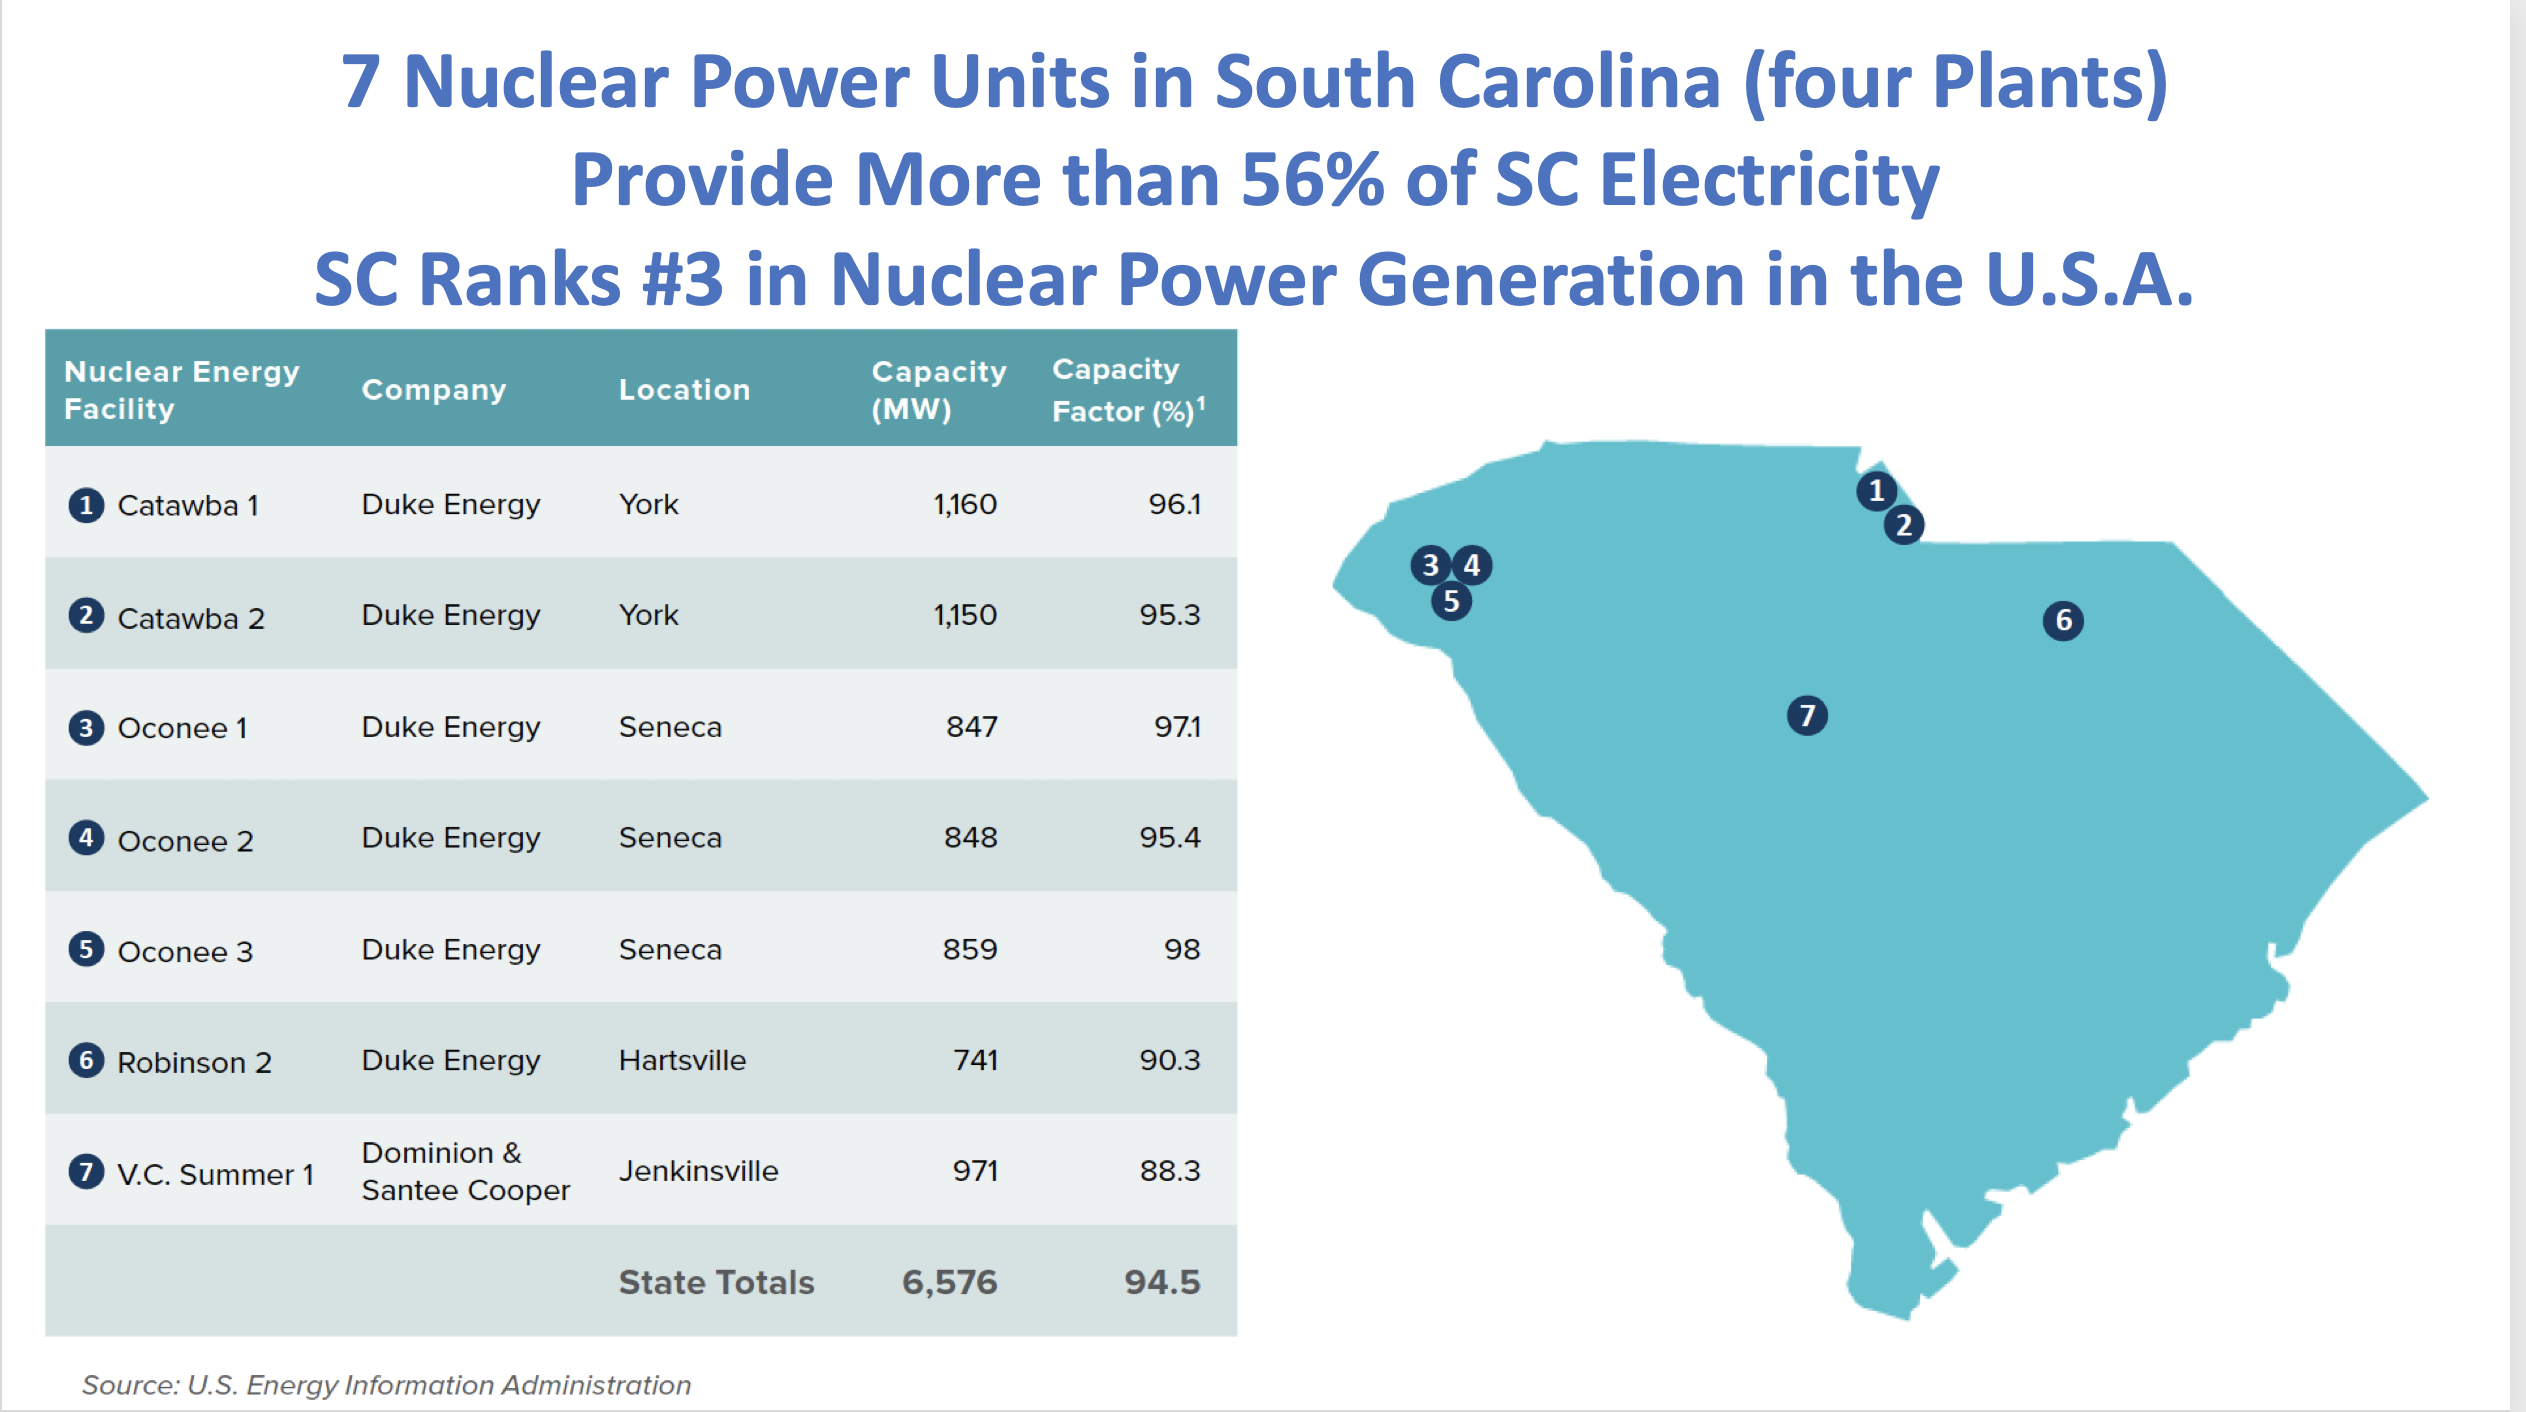
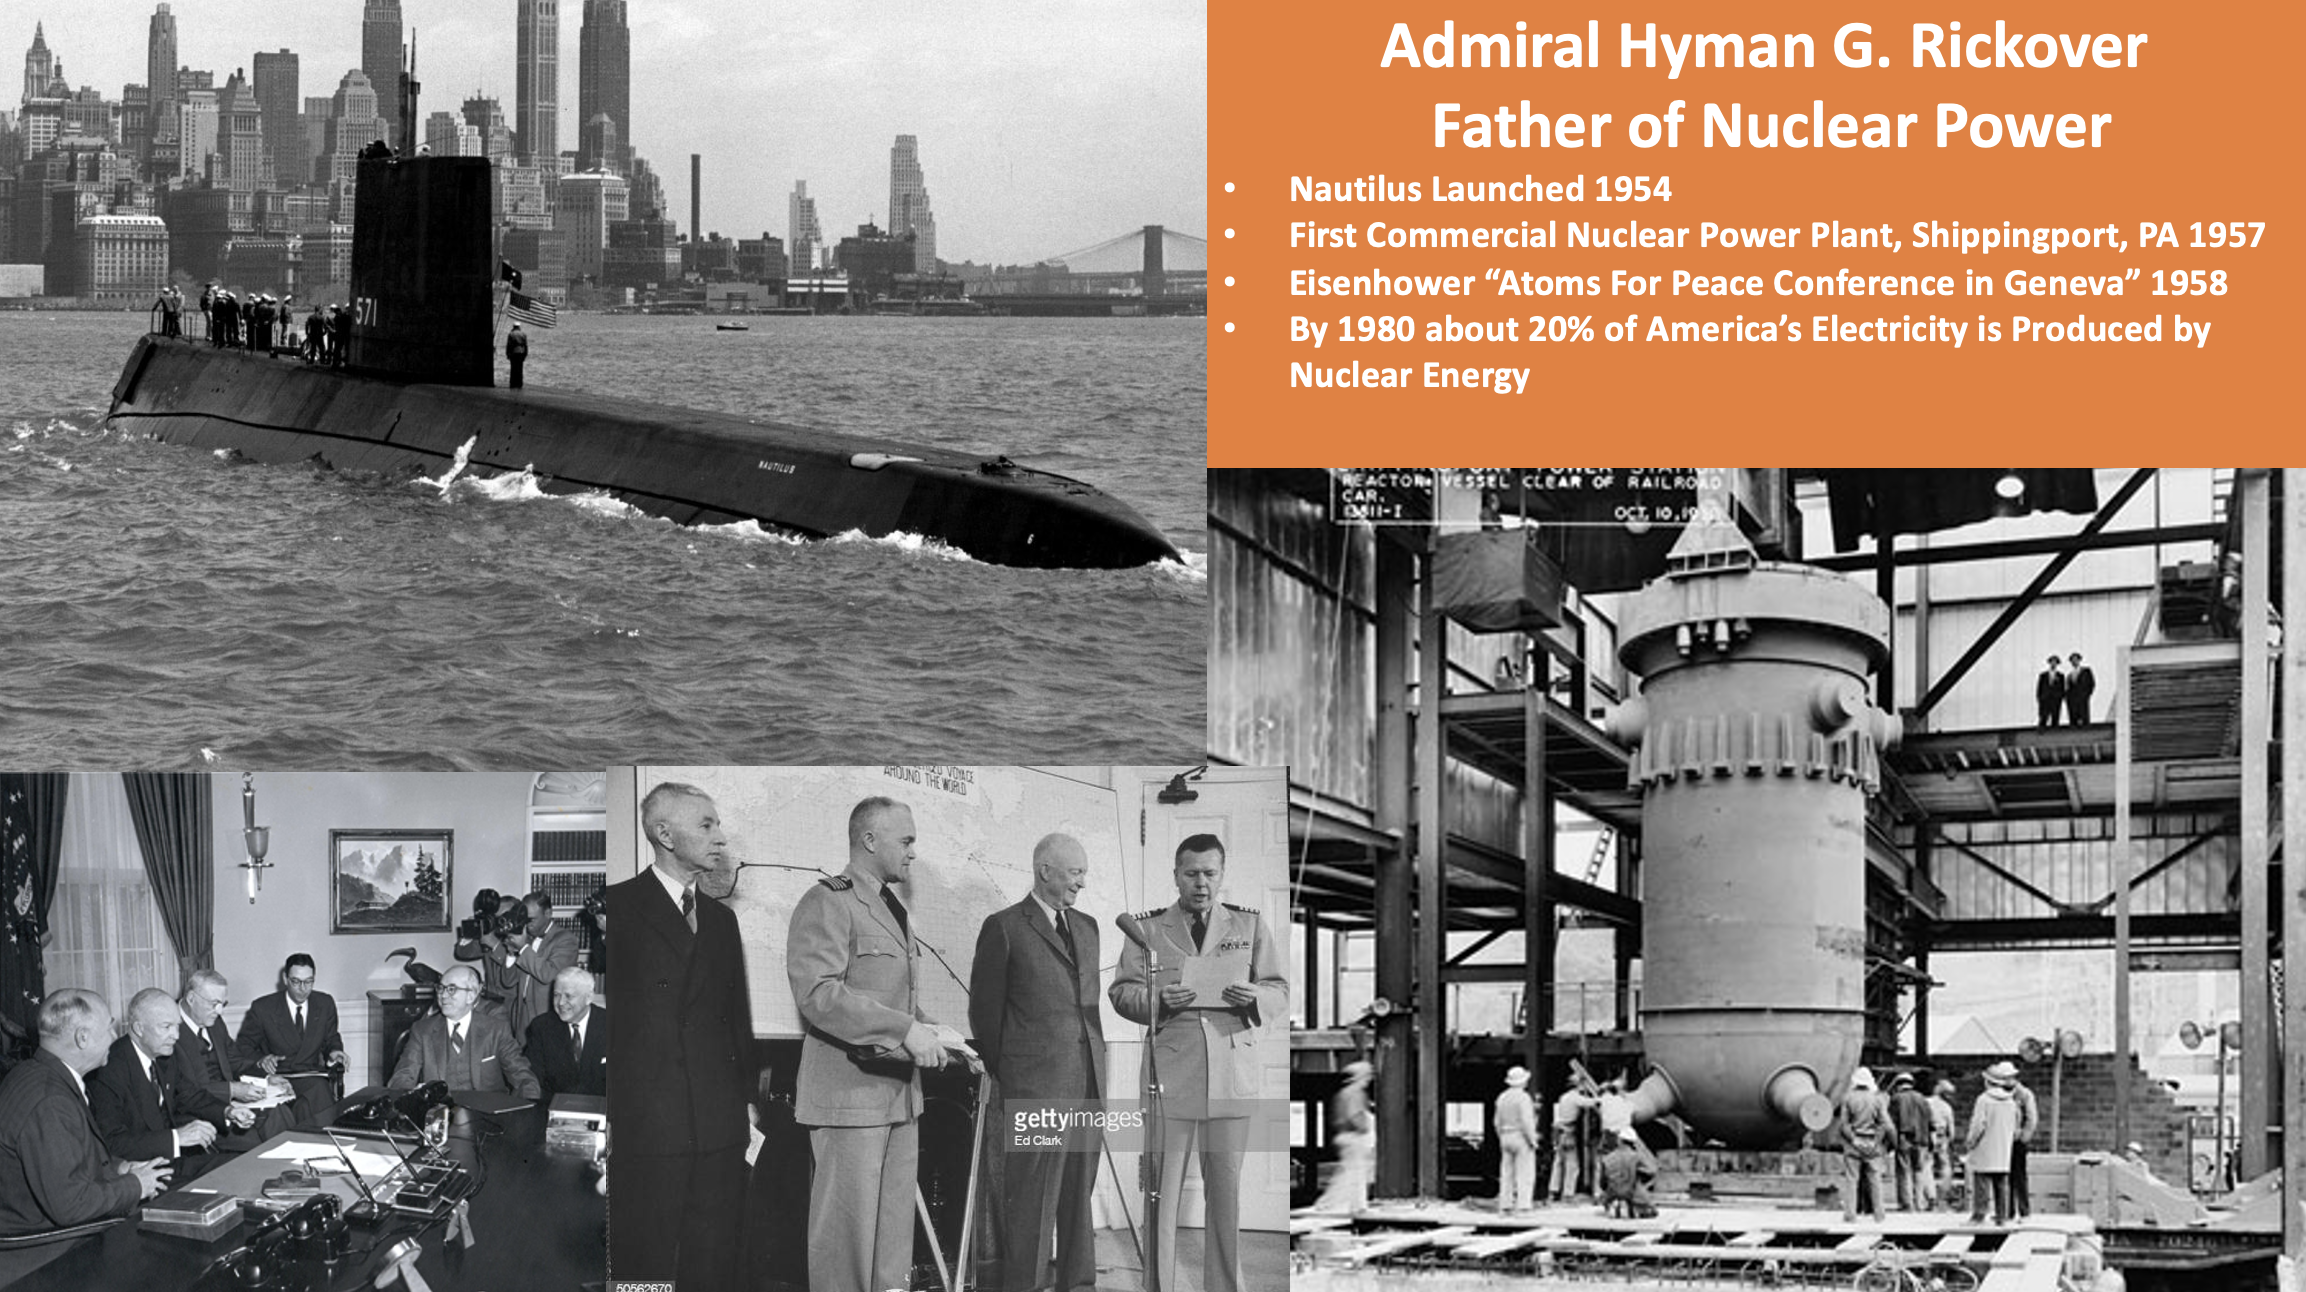
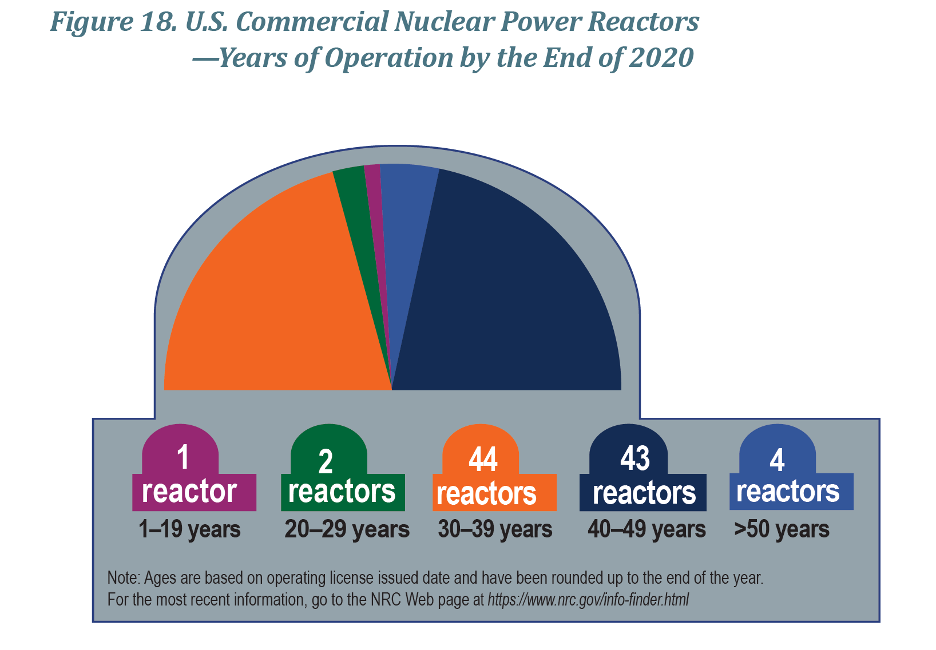
- If Net Zero Carbon was really needed or important, then the Government would encourage the building of more nuclear power plants. Hundreds of them as most of the about 20% of our electricity and over 50% of our carbon free electricity is produced by nuclear now. Most of these nuclear plants were started up in the 1970’s and 1980’s. (41, 42, 43)
- World Peace and Prosperity could be better achieved if the world leaders were to focus on the true problems of the world, rather than a war on carbon.
The foregoing are selected facts and data to support my claim that if President Biden were to rescind his 2021 Executive orders and roll back EPA, Dept of the Interior and other Government Regulations to those in effect when he took office, America could begin a recovery of correcting inflation, supply chain issues, increased food production for the world, improved economic growth & Prosperity and even leading the world to peace.
Respectfully submitted,
Dick Storm, April 5, 2022
References and Resources for Further Reading to Support My Conclusions:
- Joe Biden Executive Orders List From January 20, 2021: https://www.marketwatch.com/story/all-of-president-bidens-key-executive-orders-in-one-chart-2021-01-21
- Peace Through Strength & Free Markets are what built America, Phil Gramm and Mike Solon, March 2, 2022: https://www.wsj.com/articles/peace-through-strength-economic-freedom-open-trade-china-ccp-economy-america-competes-act-antitrust-biden-11646154226?cx_testId=3&cx_testVariant=cx_130&cx_artPos=7&mod=WTRN#cxrecs_s
- World Food Supply Insecurity, WSJ: https://www.wsj.com/articles/ukraine-war-stokes-insecurity-in-the-worlds-food-supply-11647343035?mod=Searchresults_pos20&page=1
- Fertilizer Prices Worldwide are increasing, WSJ: https://www.wsj.com/articles/ukraine-war-hits-worlds-farmers-as-russia-cuts-fertilizer-supplies-hurting-brazil-11646487815?mod=article_inline
- Surging Fertilizer Prices Push Farmers to shift Planting Plans, Raise Prices : https://www.wsj.com/articles/surging-fertilizer-costs-push-farmers-to-shift-planting-plans-raise-prices-11639580768?mod=itp_wsj&mod=djemITP_h
- IEA Energy Profile of China: https://www.iea.org/countries/china
- Germany’s Energiewiende description by World Nuclear Association. : https://world-nuclear.org/information-library/energy-and-the-environment/energiewende.aspx
- German Magazine Der Spiegel article on the importance of coal in Nov. 2021: https://www.spiegel.de/international/business/troubling-addiction-the-world-is-failing-to-phase-out-coal-a-6d2007de-8196-4466-aaca-8b6a2714ec78
- World Food Crisis Likely due to Russia-Ukraine War, The Guardian, March 14, 2022: https://www.theguardian.com/world/2022/mar/14/ukraine-invasion-worldwide-food-crisis-warns-un
- Eleven-year-old article on the importance of Ukraine Grain, the Guardian: https://www.theguardian.com/world/2010/jul/20/ukraine-grain-farming-exports
- Top Banks in the world, lexis Nexis: https://risk.lexisnexis.com/insights-resources/article/bank-rankings-top-banks-in-the-world
- Saudi Arabia considers payment for oil with Yuan, Bloomberg, March 15, 2022: https://www.bloomberg.com/news/articles/2022-03-15/yuan-surges-after-report-on-saudis-accepting-currency-for-oil
- Biden’s Plan to starve Americans of Fossil Fuels, Paul Driessen, CFACT: https://www.cfact.org/2022/03/27/bidens-plan-to-starve-america-of-fossil-fuels/
- “Greenpeace Environmentalism in Europe, Allowed Putin to Invade Ukraine”, CFACT: https://www.cfact.org/2022/03/09/greenpeace-environmentalism-allowed-putin-to-invade-ukraine/
- Competitive Enterprise Institute, Background on the Clean Power Plan: https://cei.org/clean-power-plan/
- Scientific American, Rethinking our Corn to Ethanol Policy: https://www.scientificamerican.com/article/time-to-rethink-corn/
- Corn for Ethanol, Univ. of Nebraska: https://cropwatch.unl.edu/bioenergy/corn
- Why your Electric Costs are Surging and likely to go higher, March 15, 2022: https://www.wsj.com/articles/why-your-electric-bill-is-soaringand-likely-to-go-higher-11647250380?mod=hp_featst_pos4
- Germany’s Nuclear Surrender Opinion, Dec. 24, 2021: (See last reference #51 below)
- Factories close in UK due to High Energy Costs, WSJ: https://www.wsj.com/articles/surging-energy-prices-close-u-k-factories-another-bottleneck-in-a-world-full-of-them-11631792586?mod=Searchresults_pos5&page=1
- Behind the rise of U.S. Solar, Built with a Mountain of Chinese Coal WSJ: https://www.wsj.com/articles/behind-the-rise-of-u-s-solar-power-a-mountain-of-chinese-coal-11627734770?mod=Searchresults_pos18&page=9
- If Renewables are so Cheap, then Why is Germany’s Electricity so Expensive? American Experiment : https://www.americanexperiment.org/if-renewables-are-so-cheap-why-is-germanys-electricity-so-expensive/
- United Nations News, November 2021, COP-26: https://news.un.org/en/news/topic/climate-change
- United Nations, News regarding “World Peace and Sustainability” March 22, 2022: https://news.un.org/en/story/2022/03/1115272
- Scottish News, “Private Jets of Climate Elites Blast More CO2 to Travel to COP-26 than 1600 Scots Pump Out in a Year”: https://www.dailyrecord.co.uk/news/scottish-news/private-jets-flying-cop26-blast-25338840
- Donn Dears articles on the true facts and Common Sense of the Importance of Energy, including “How Europe Dithers” while the Russians prepared for war: https://ddears.com/donns-articles/
- WUWT Blog, “Arab Nations Respond to Global Energy Demand for Energy Security”, April 3, 2022: https://wattsupwiththat.com/2022/04/02/whos-talking-climate-change-now-arab-states-respond-to-global-demand-for-energy-security/
- Biden Suspends Oil and Gas Leases to Protect the World from Climate Change, WUWT January 2021: https://wattsupwiththat.com/2021/01/21/biden-suspends-federal-oil-and-gas-permits-because-climate-change/
- Toronto Sun, “Oh the Hypocrisy of Climate Change”: https://torontosun.com/news/world/oh-the-hypocrisy-private-jets-pack-scotlands-climate-conference
- Times of Israel, “Israeli’s Scramble For Food” : https://www.google.com/url?q=https://toi.by/nwkDto&source=gmail&ust=1649072066572000&usg=AOvVaw1zxNxuPXllU7WBiaJoMgyM
- South China Morning Post, Energy News regarding Russia-Ukraine War, April1, 2022: https://www.scmp.com/economy/china-economy/article/3172764/china-vows-bolster-energy-security-ukraine-war-stokes-period
- IEA, Total Primary Energy Use for World 1971-2017: https://www.iea.org/data-and-statistics/charts/total-primary-energy-supply-for-the-eu-and-selected-countries-1971-2017 ESG and Climate Related Financial News to Cripple U.S. Conventional Fuels Production:
- BANK OF AMERICA CEO, Nov. 9, 2021: https://www.wsj.com/articles/why-financing-the-multi-trillion-dollar-transition-to-net-zero-isnt-that-hard-11636018200
- Who is Driving “Climate Funds”: https://www.wsj.com/articles/climate-funds-whos-driving-growing-demand-11637165424?mod=latest_headlines
- WSJ Citi Bank to eliminate some Clients that are not “Green” enough, Dec. 7, 2021:
- https://www.wsj.com/articles/citigroups-jane-fraser-expects-to-shed-some-clients-for-climate-purposes-11638912251?mod=business_minor_pos15
- WSJ Finance ESG Conflict of Interests, Jan 29, 2022: https://www.wsj.com/articles/wall-streets-green-push-exposes-new-conflicts-of-interest-11643452202?cx_testId=3&cx_testVariant=cx_5&cx_artPos=0&mod=WTRN#cxrecs_s
- ESG Investing Nov. 18, 2021: https://www.wsj.com/articles/climate-and-environment-focused-funds-dominate-esg-11637092844
- SEC Requirements for Climate Change Disclosure March 21, 2022: https://www.wsj.com/articles/sec-to-float-mandatory-disclosure-of-climate-change-risks-emissions-11647874814?mod=djemalertNEWS
- Blackrock Climate Policies to Make Money Jan. 7, 2022: https://www.wsj.com/articles/larry-fink-wants-to-save-the-world-and-make-money-doing-it-11641484864?mod=itp_wsj&mod=djemITP_h
- Small Modular Reactors, WSJ, Aug. 2021 : https://www.wsj.com/articles/utilities-eye-mini-nuclear-reactors-as-climate-concerns-grow-11627905600?mod=article_inline
- WSJ Saturday Essay on the Future of Nuclear Power in a Carbon-Free World: https://www.wsj.com/articles/is-nuclear-power-part-of-the-climate-solution-11641571176
- World Nuclear Association, Nuclear Power Facts: https://world-nuclear.org/information-library/country-profiles/countries-t-z/usa-nuclear-power-policy.aspx
- An interesting post by the Sierra Club, entitled, “What Divestment from Russia Means for Activism Against Fossil Fuels From Russia” March 22, 2022: https://www.sierraclub.org/sierra/what-divestment-russia-means-for-activism-against-fossil-fuels
- Liberty Oilfield Services, 2020 ESG Report, “Bettering Human Lives”: https://www.libertyfrac.com/bettering-human-lives-2020-esg-report/
- Settlement of John Turk Power Plant with Environmental groups, Arkansas Times, 2011: https://arktimes.com/arkansas-blog/2011/12/22/sierra-club-audubon-settle-with-swepco-on-turk-power-plant and https://www.aep.com/news/releases/read/1235/AEP-
- China Continues To Laugh At Western “Green Energy” Foolishness, April 2, Manhatten Contrarian: https://wattsupwiththat.com/2022/04/03/china-continues-to-laugh-at-western-green-energy-foolishness/
- China’s Energy Dream, Patricia Adams, GWPF: https://www.thegwpf.org/content/uploads/2021/12/Adams-Chinas-Energy-Dream.pdf
- Vaclav Klaus Book, “Blue Planet in Green Shackles”, published in English in 2007 by Competitive Enterprise Institute
- Saudi Arabia considers acceptance of Yuan for Oil payments, WSJ March 15, 2022: https://www.wsj.com/articles/saudi-arabia-considers-accepting-yuan-instead-of-dollars-for-chinese-oil-sales-11647351541

51. Germany’s Nuclear Surrender:


