This is copied from the Tennessee Star Tribue Newspaper Opinion page, Nov. 11 2021. Full credit is given to the author, Mr. John Windschill. Thanks also is given to my friend Don Spellman for forwarding to me. I thought this is well researched and well written. As for myself, I believe Climate Change is mostly from natural forces, but if a reduced carbon society is desired and our quality of life and freedom is to be continued, then nuclear power must be included along with all other fuels.
The perceived dangers are overestimated.
By John Windschill

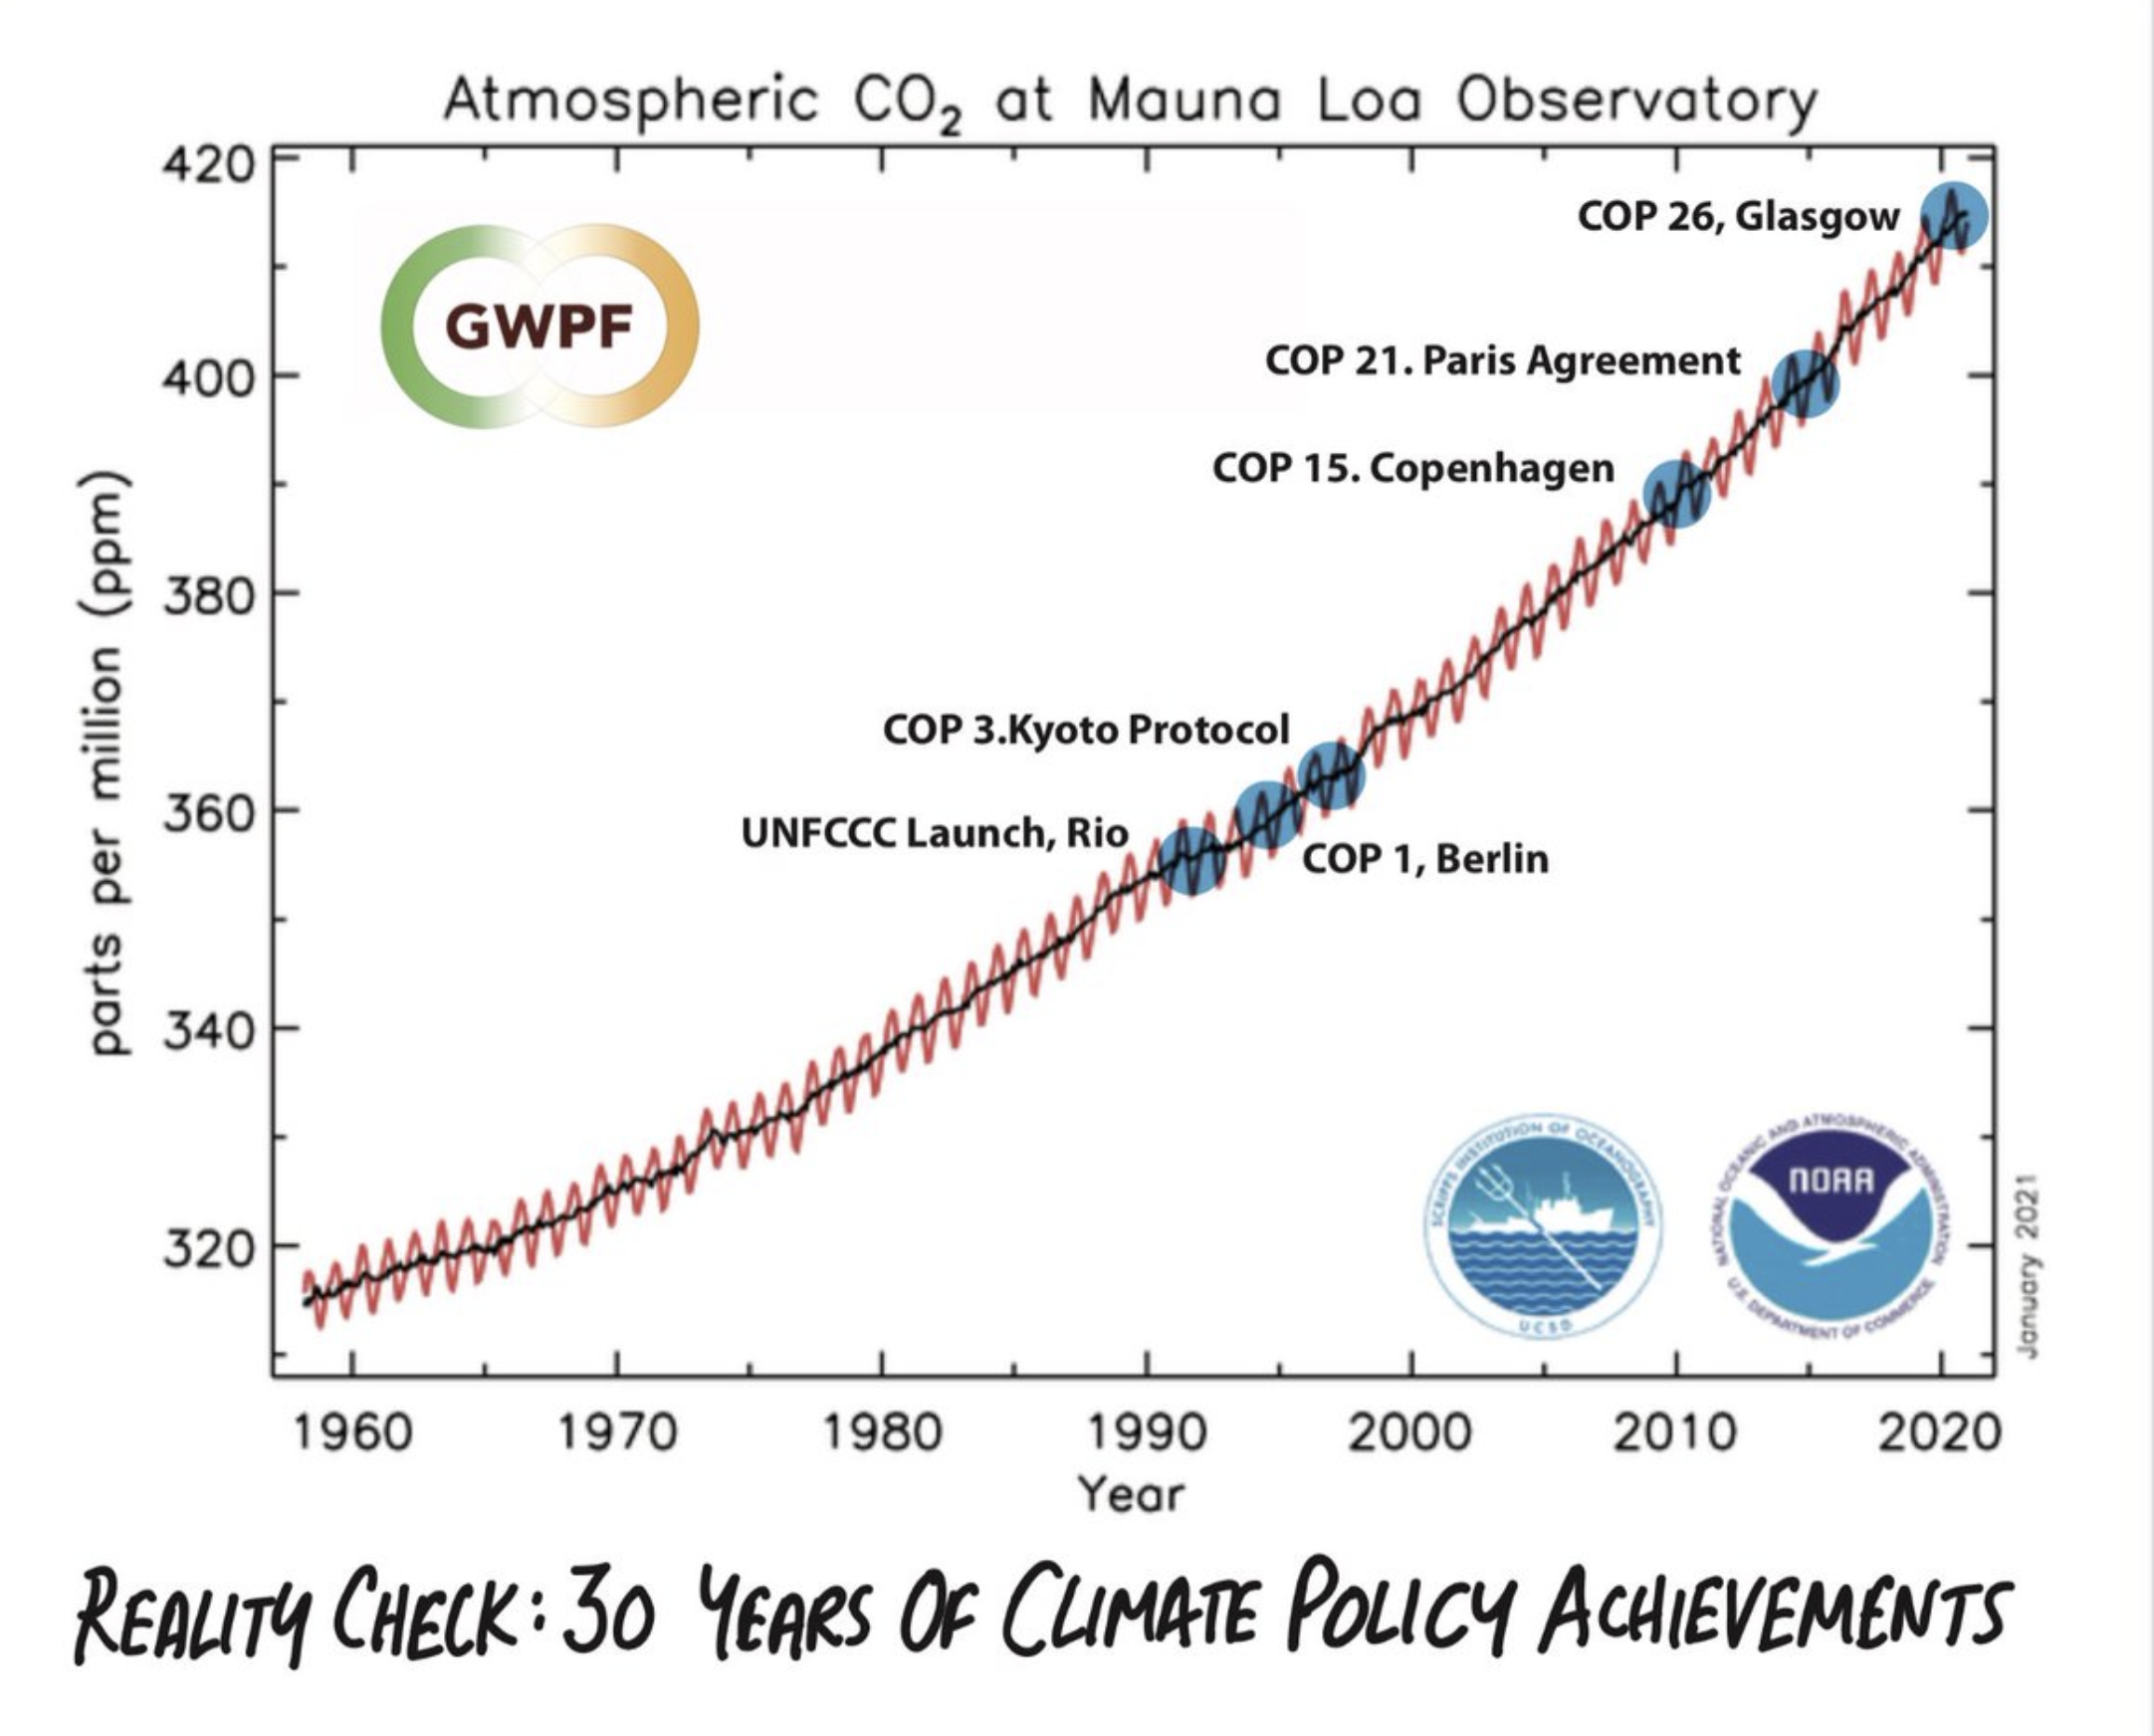
A summer of destructive flooding, fires and drought across the planet, coupled with a sobering update from the United Nations climate panel, indicates that we are likely not making adequate progress addressing climate change. And our climate change ambivalence is especially obvious when it comes to nuclear power.
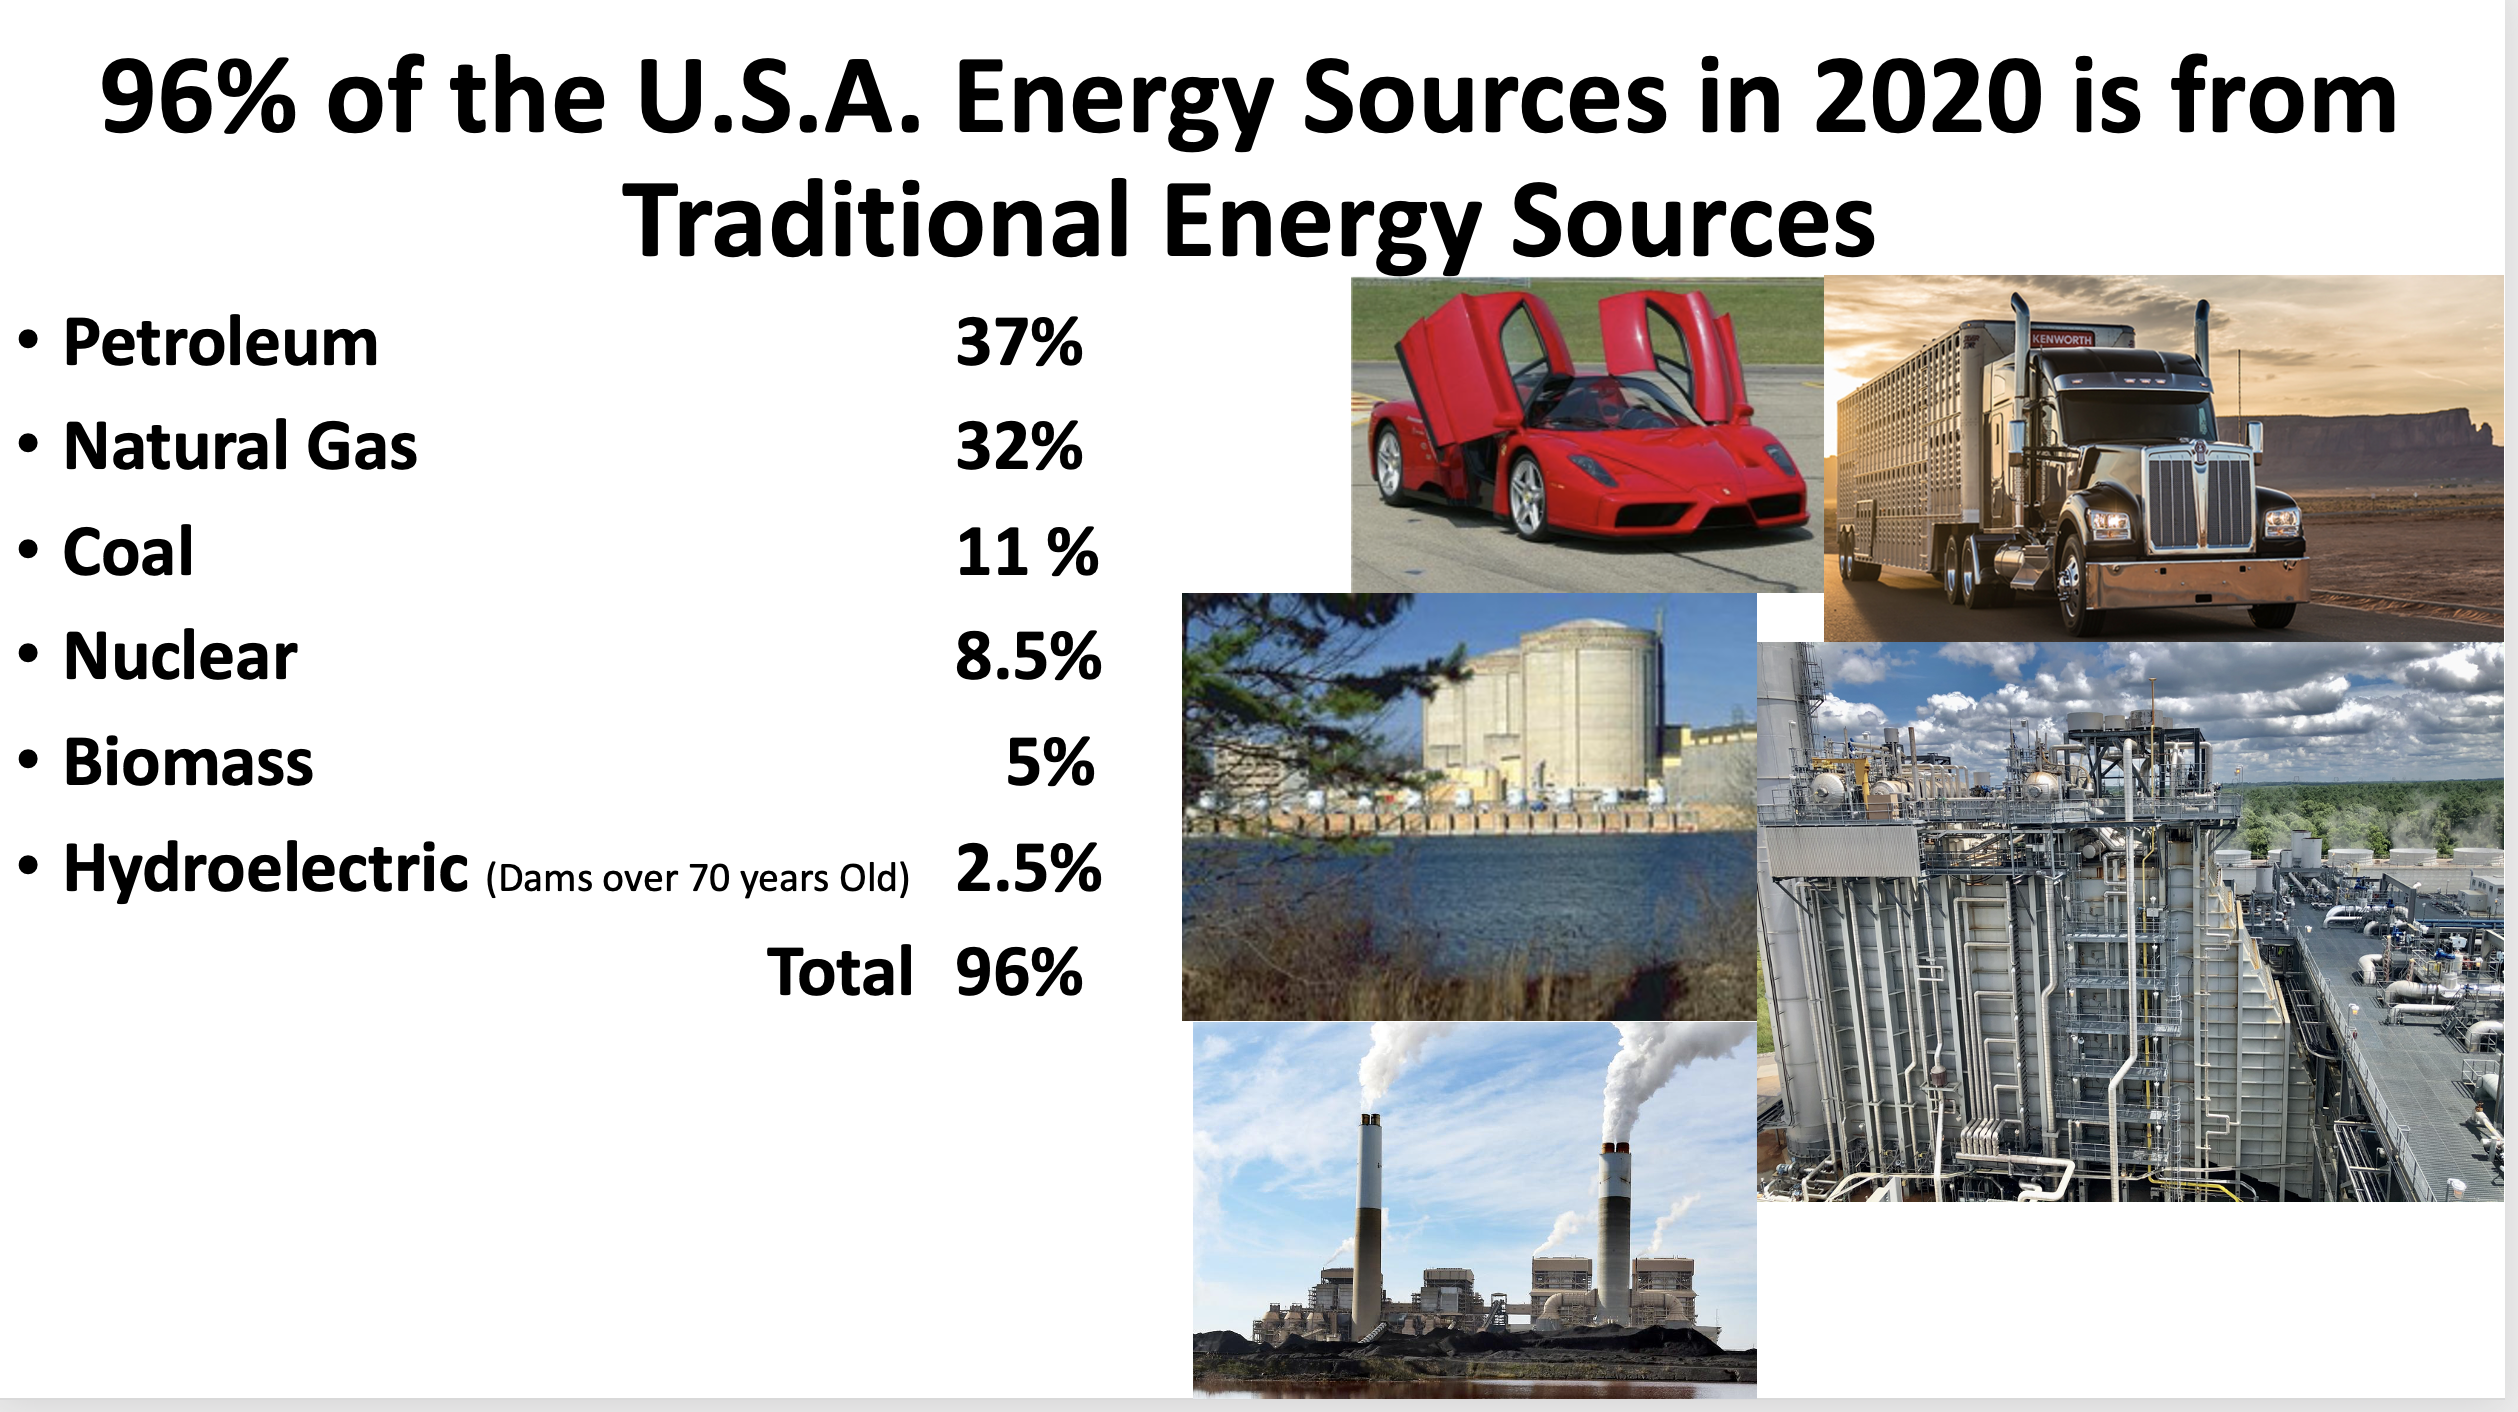
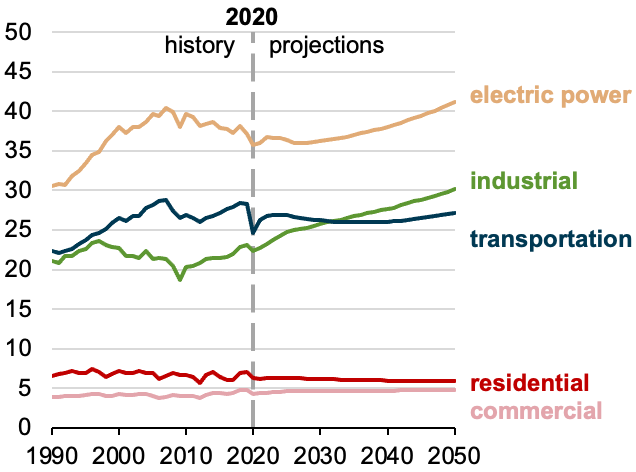
Despite nuclear power having potential to greatly reduce the fossil-fuel emissions that are responsible for about 70% of U.S. transportation- and electricity-related carbon emissions, and despite nuclear power being among the safest means of electricity production we have (as reported in Forbes, the Lancet and the Journal of Cleaner Production), many well-run nuclear plants are being retired.
In the last eight years, 11 nuclear reactors were retired in the U.S. This year four more are scheduled for permanent closure. These plants collectively represent 14,700 megawatts of electrical supply — enough electricity for 10 million people.
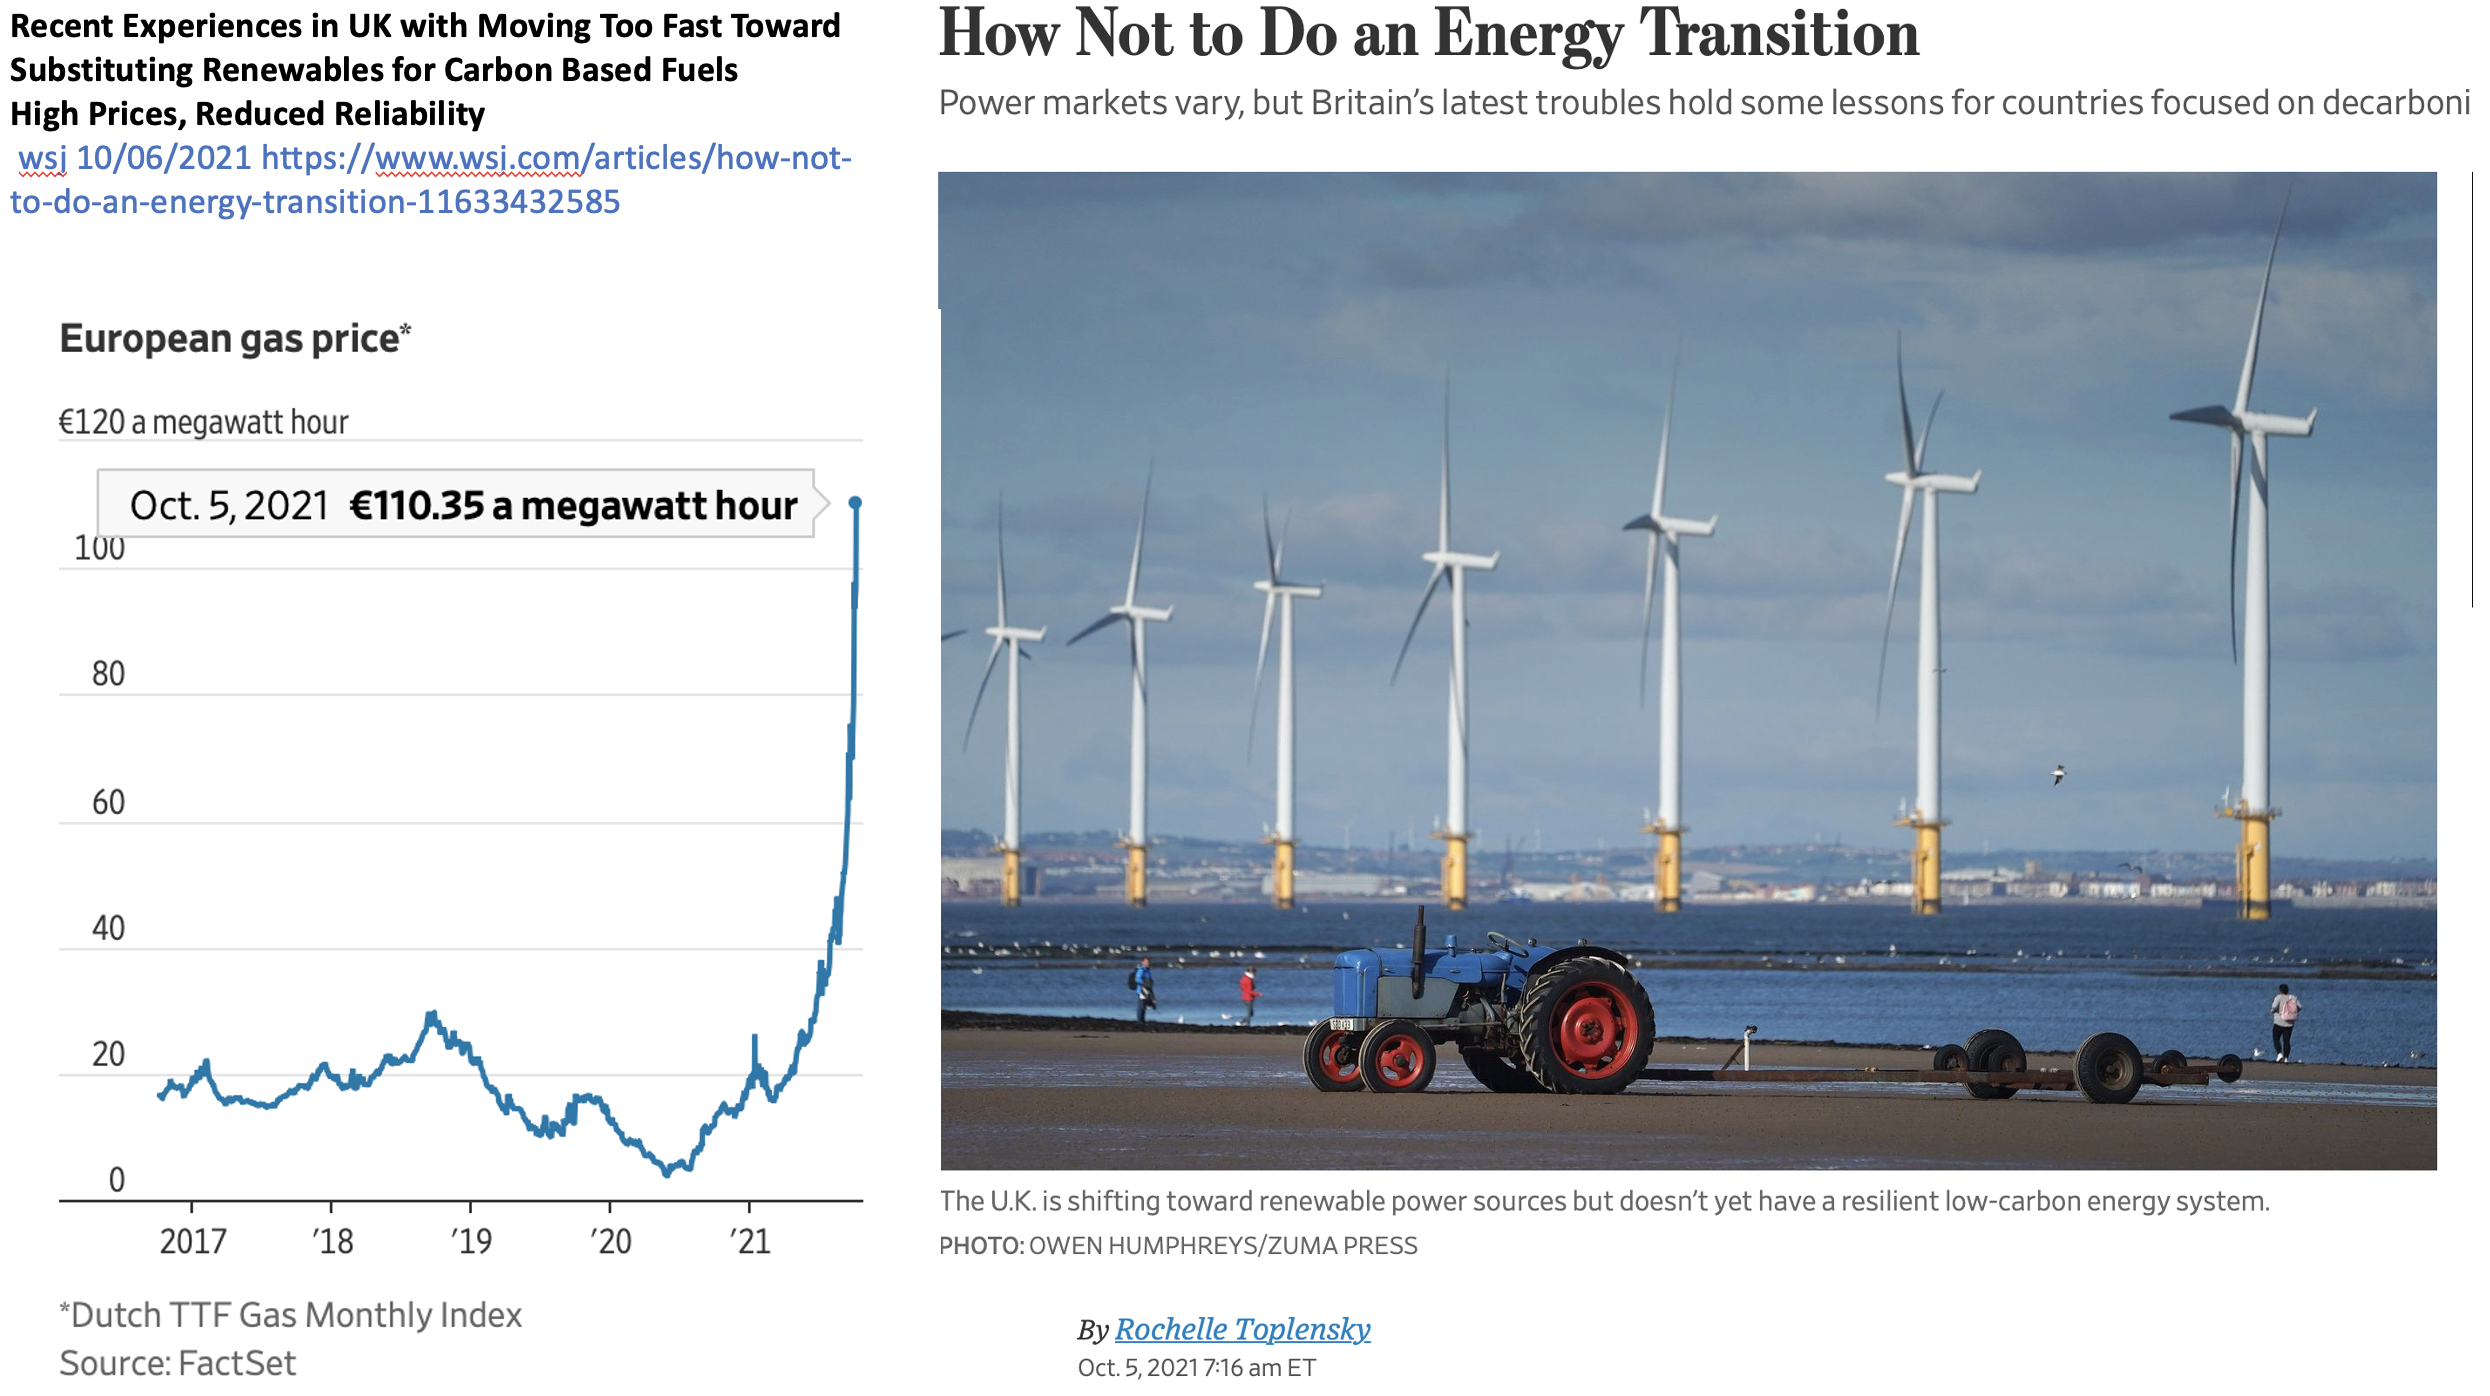
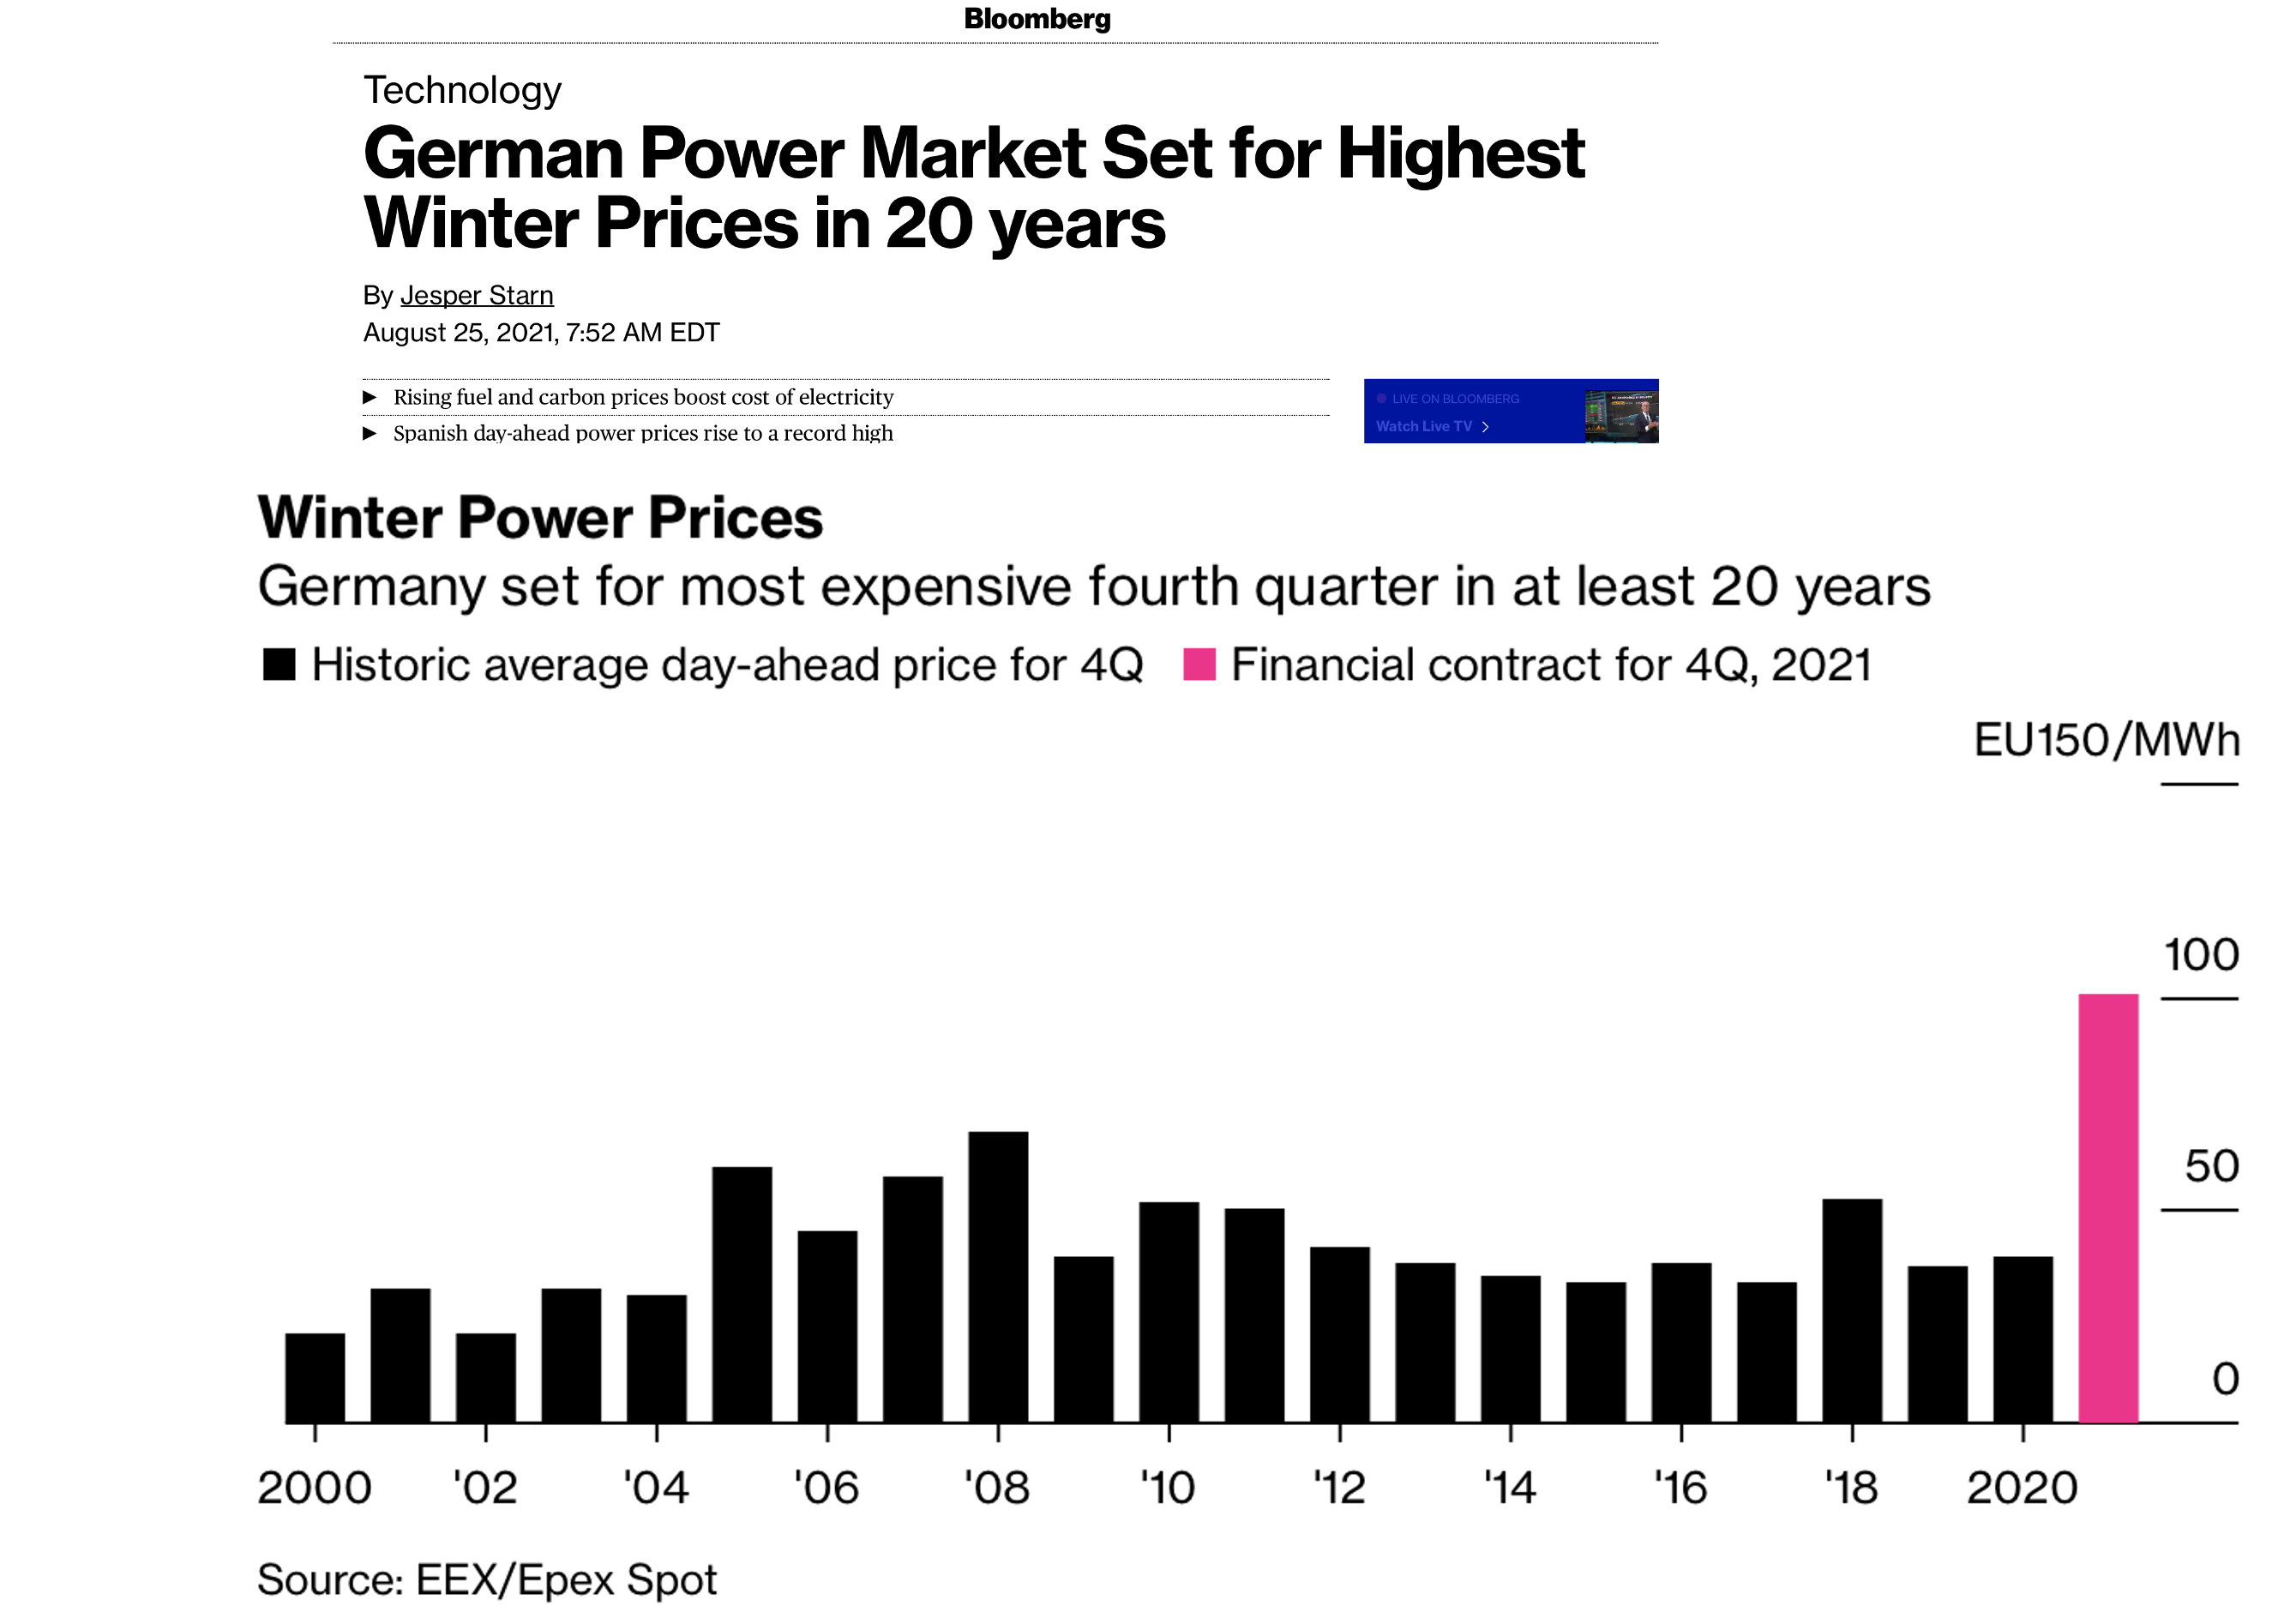
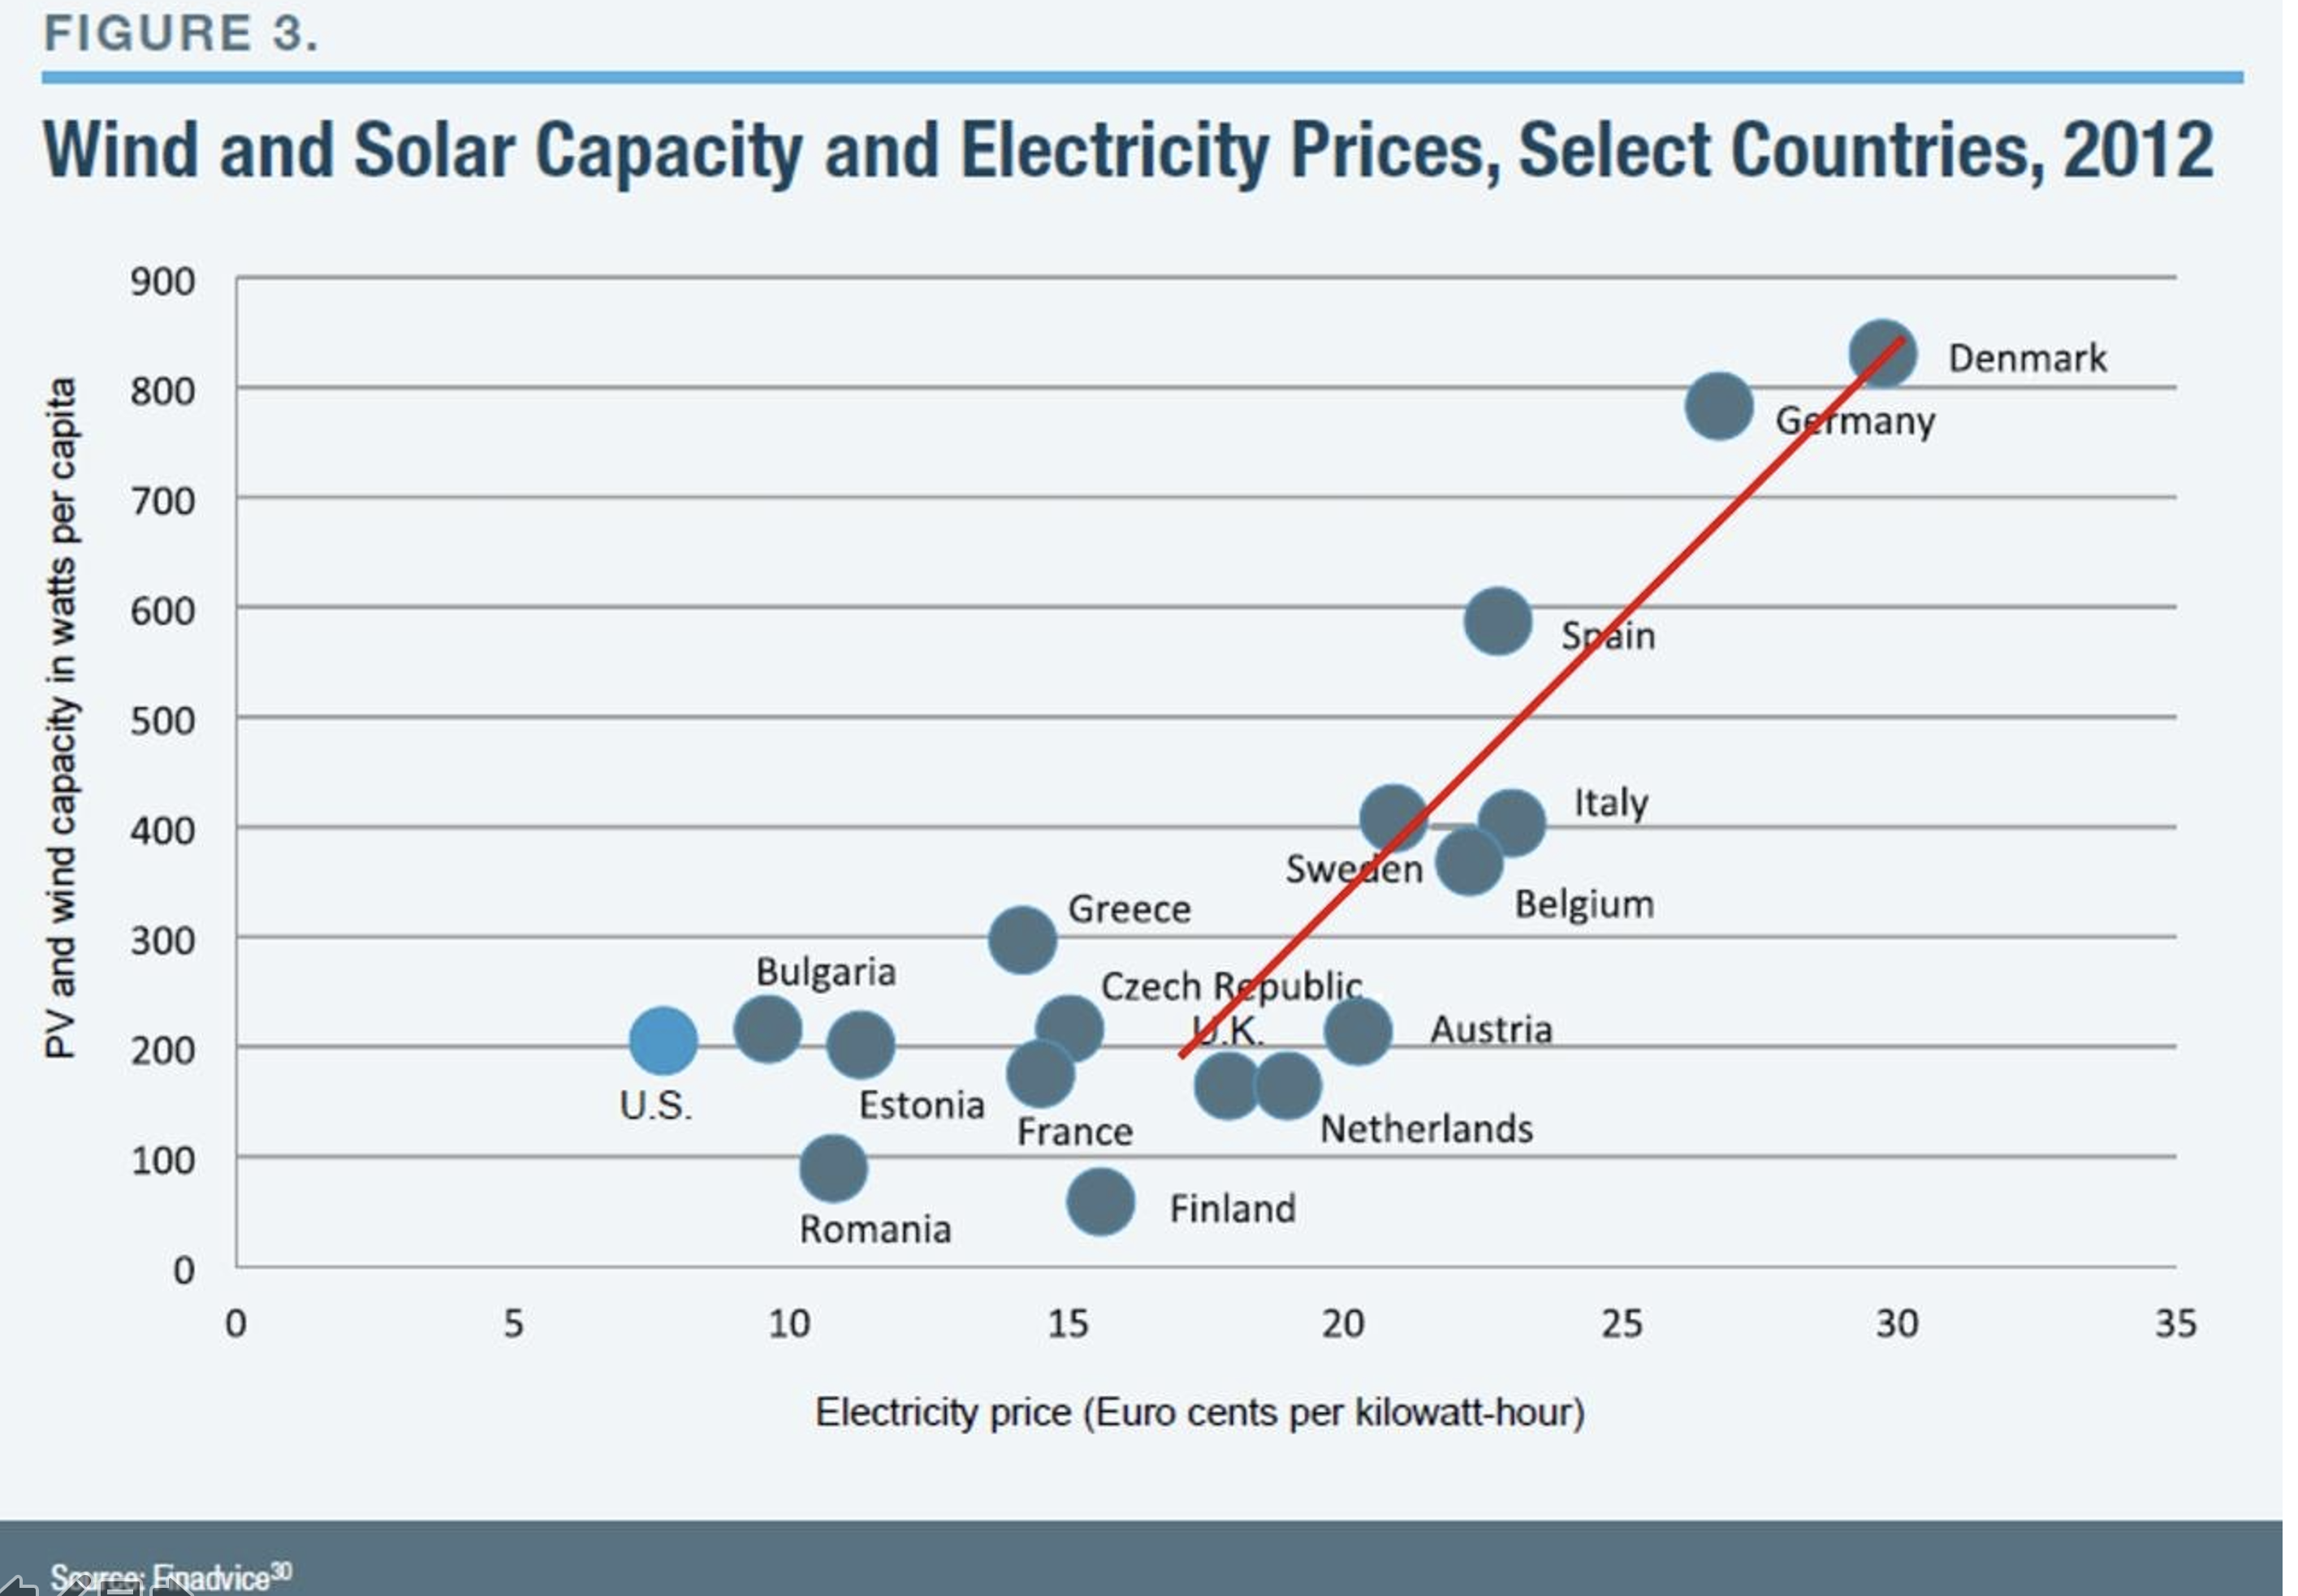
Consider the experiences of Germany, France and Sweden. Germany’s decision to forgo nuclear power has resulted in its falling far short of its carbon emission goal. France, which receives 72% of its electricity from nuclear, has less than half the carbon emissions of Germany, and electricity prices that are 40% lower. Sweden’s electricity is 40% nuclear, with prices 35% below Germany’s and per capita carbon emissions that are 57% lower.
Critics of nuclear power identify fear of accidents and a belief that a solution for waste disposal does not exist as reasons to oppose nuclear power. Neither of these is valid. People are afraid of nuclear power because it pushes all the wrong emotional buttons. As a result, the very low risk that nuclear power entails is not appreciated.
At the core of the fear of nuclear power is a fear of ionizing radiation (hereafter simply referred to as radiation). Radiation is extremely common in our environment. It is a straightforward substance to monitor and control, and its impact on public health is well understood. Each second natural background radiation interacts with our bodies more than 10,000 times. These natural sources account for about half of the radiation dose the average American receives, with the remaining half coming from medical procedures. The 60 operating nuclear power plants in the U.S. contribute less than 0.01% from routine operations.
The two basic ways a nuclear power plant can increase public radiation doses are accidents and waste disposal. Three accidents have occurred that affected the public. These, in increasing order of severity, were Three Mile Island in 1979 in Pennsylvania, Fukushima in 2011 in Japan, and Chernobyl in 1986 in Ukraine. This history of nuclear power over 42 years proves how safe nuclear power is.
At the Three Mile Island accident there were no health effects. Nuclear Regulatory Commission reports indicate the average radiation dose received by members of the public living near the plant was far below natural background radiation levels.
Fukushima released more radioactive materials than Three Mile Island, but because of effective emergency response efforts, public radiation doses were low. The United Nations Scientific Committee on the Effects of Atomic Radiation and the World Health Organization (WHO) concluded that there would be no observable health effects in the public from the accident.
The Chernobyl accident was basically the most severe nuclear power plant accident that is possible. International Atomic Energy Agency and WHO reports indicate that the only cancer that has been detected from the accident is thyroid cancer, which has led to 15 related fatalities. Among initial responders, 28 tragically died of acute radiation poisoning at the time of the accident.
Based on conservative estimates, it is possible that a few thousand might die within 50 years of cancers not epidemiologically detectable among the background cancer rate. This puts a cap on the worst-case result. A few thousand people die each day in the world due to air pollution from fossil fuels and also from auto accidents. With more than 37,000 fatalities worldwide since the Three Mile Island accident, commercial air travel has about a 10 times larger impact on public health and safety.
For comparison among electrical generating sources, the fatality rate per billion kilowatt-hours generated is: coal, 25; natural gas, 2.8; global nuclear, 0.074 (includes an assumed 4,000 future deaths from Chernobyl); wind, 0.035; hydro, 0.024; solar, 0.019; and U.S. nuclear, 0.0001.
And the lessons learned from the three accidents described above have been effectively applied to make safe nuclear power even safer.
Regarding high-level nuclear waste, James Conca (who has Ph.D. in geochemistry from California Institute of Technology) says, “We know where to put nuclear waste, how to put it there, how much it will cost, and how well it will work.” An oft-repeated phrase is that high-level waste is dangerous for tens of thousands of years, but the fact is that high-level waste loses 99% of its toxicity within 600 years. And while high-level waste is very toxic material, it is less hazardous than gasoline.
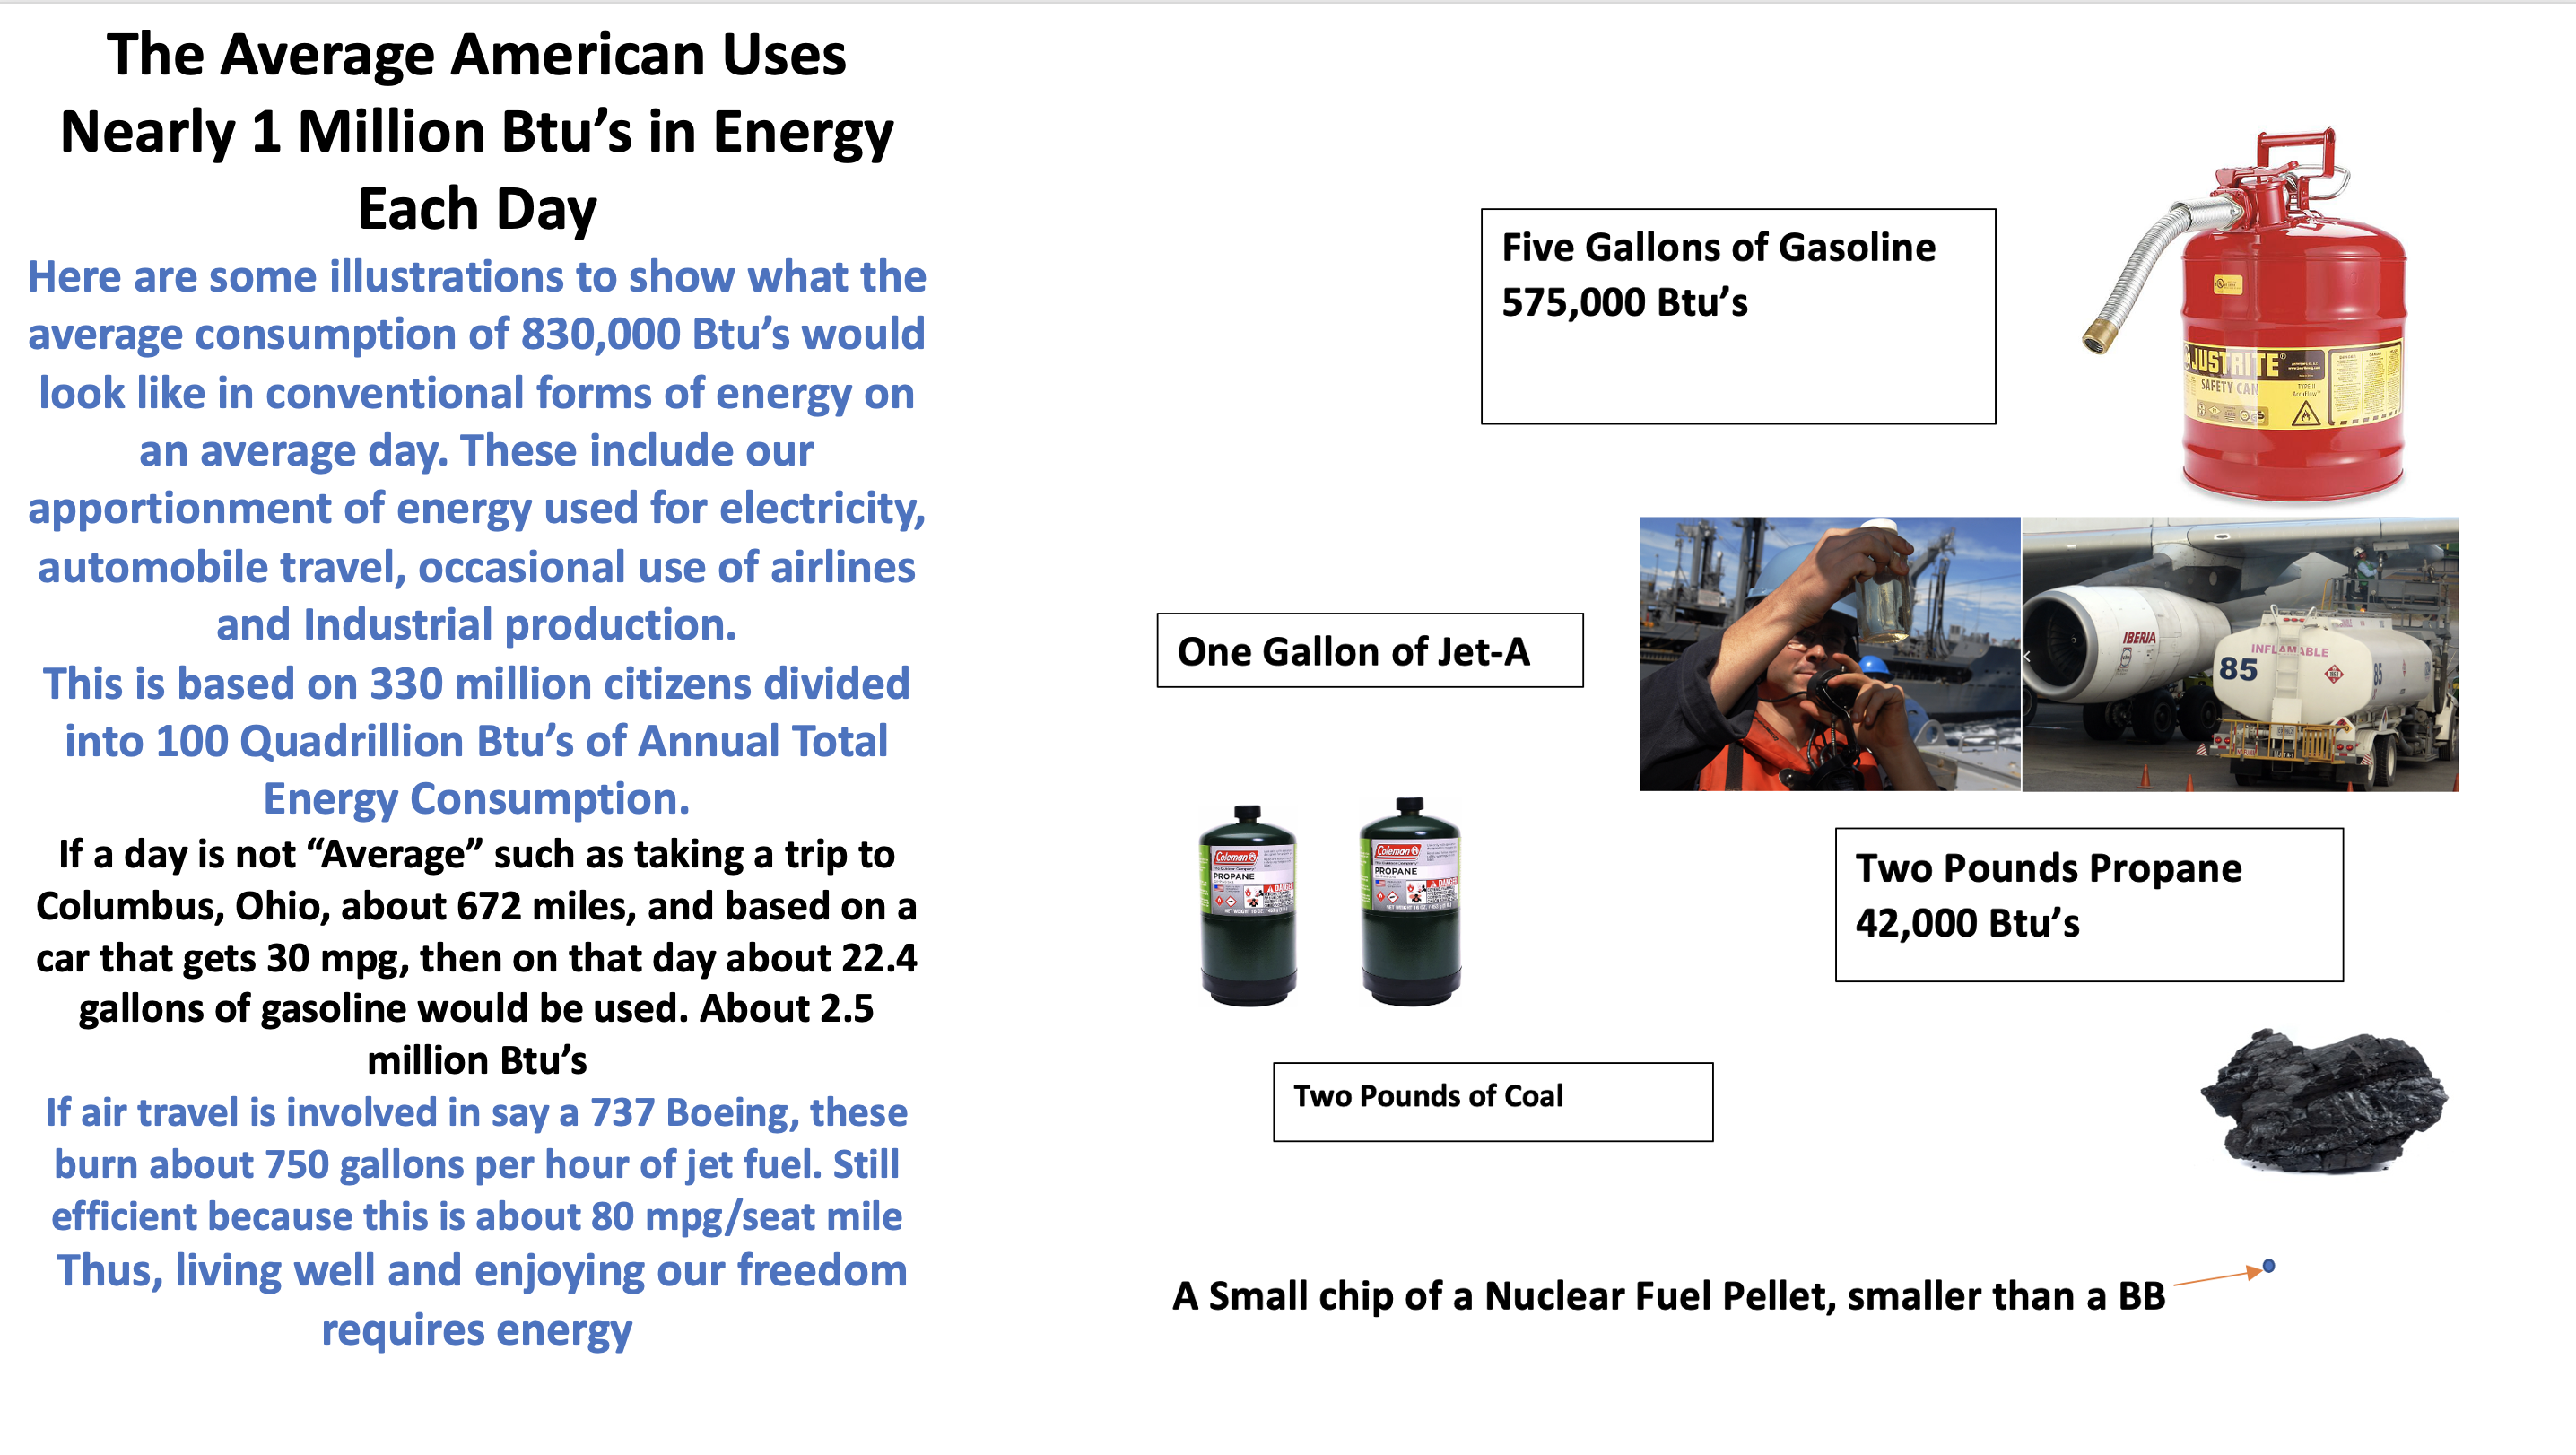
The U.S. produces 50 times more lethal doses of gasoline each year than lethal doses of high-level waste; we carry our gasoline with us pretty much everywhere we travel, and it is stored much less carefully than nuclear waste.
The very small volume of high-level waste allows meticulous control to be achieved. Each U.S. resident’s lifetime share of high-level waste would fit in a single can of Coke. Kilowatt for kilowatt, solar power waste has 10,000 times greater volume than nuclear waste, and wind’s total is 500 times larger, each involving large amounts of toxic metals in panels and batteries. Also, nuclear waste is an inert solid within a metal casing (i.e., spent nuclear fuel), not green, oozing goo.
And yet, wind and solar get an environmental hall pass, but nuclear power is labeled as exceedingly dangerous.
The current concept is to secure the solid waste in highly robust steel containers, and to store the containers in an accessible manner that allows routine monitoring and inspection in a deep underground repository free of groundwater that has been geologically stable for millions of years. Yucca Mountain north of Las Vegas was selected for study.
Prof. Bernard Cohen of the University of Pittsburgh calculated that if all the electricity in the U.S. were provided by nuclear power, it would result in 0.3 deaths per year in the U.S. due to waste storage. Should we be concerned with tiny quantities of nuclear waste migrating from a very remote, highly engineered and easily monitored facility sometime in the far distant future, or with the millions of tons of carbon dioxide and harmful particulates we currently pump into the air to breathe and cause our planet to heat up?
Yet in 2011 President Barack Obama defunded the Yucca Mountain project. Again, faulty risk assessment and politics won out over science and sound public policy.
We should be insisting that our government more vigorously pursue this valuable technology that could be a difference maker for addressing climate change. Bill Gates has helped form a new company, TerraPower, whose mission is to bring nuclear power plant design forward to the next level of safety and economic performance. In a recent quote from Forbes, he said “there are only three ways to solve the electric grid problem: one is a miracle in [energy-battery] storage, the second is nuclear fission, and the third is nuclear fusion.”
Wind and solar have a vital role to play, but we should not be putting total reliance on a miracle.