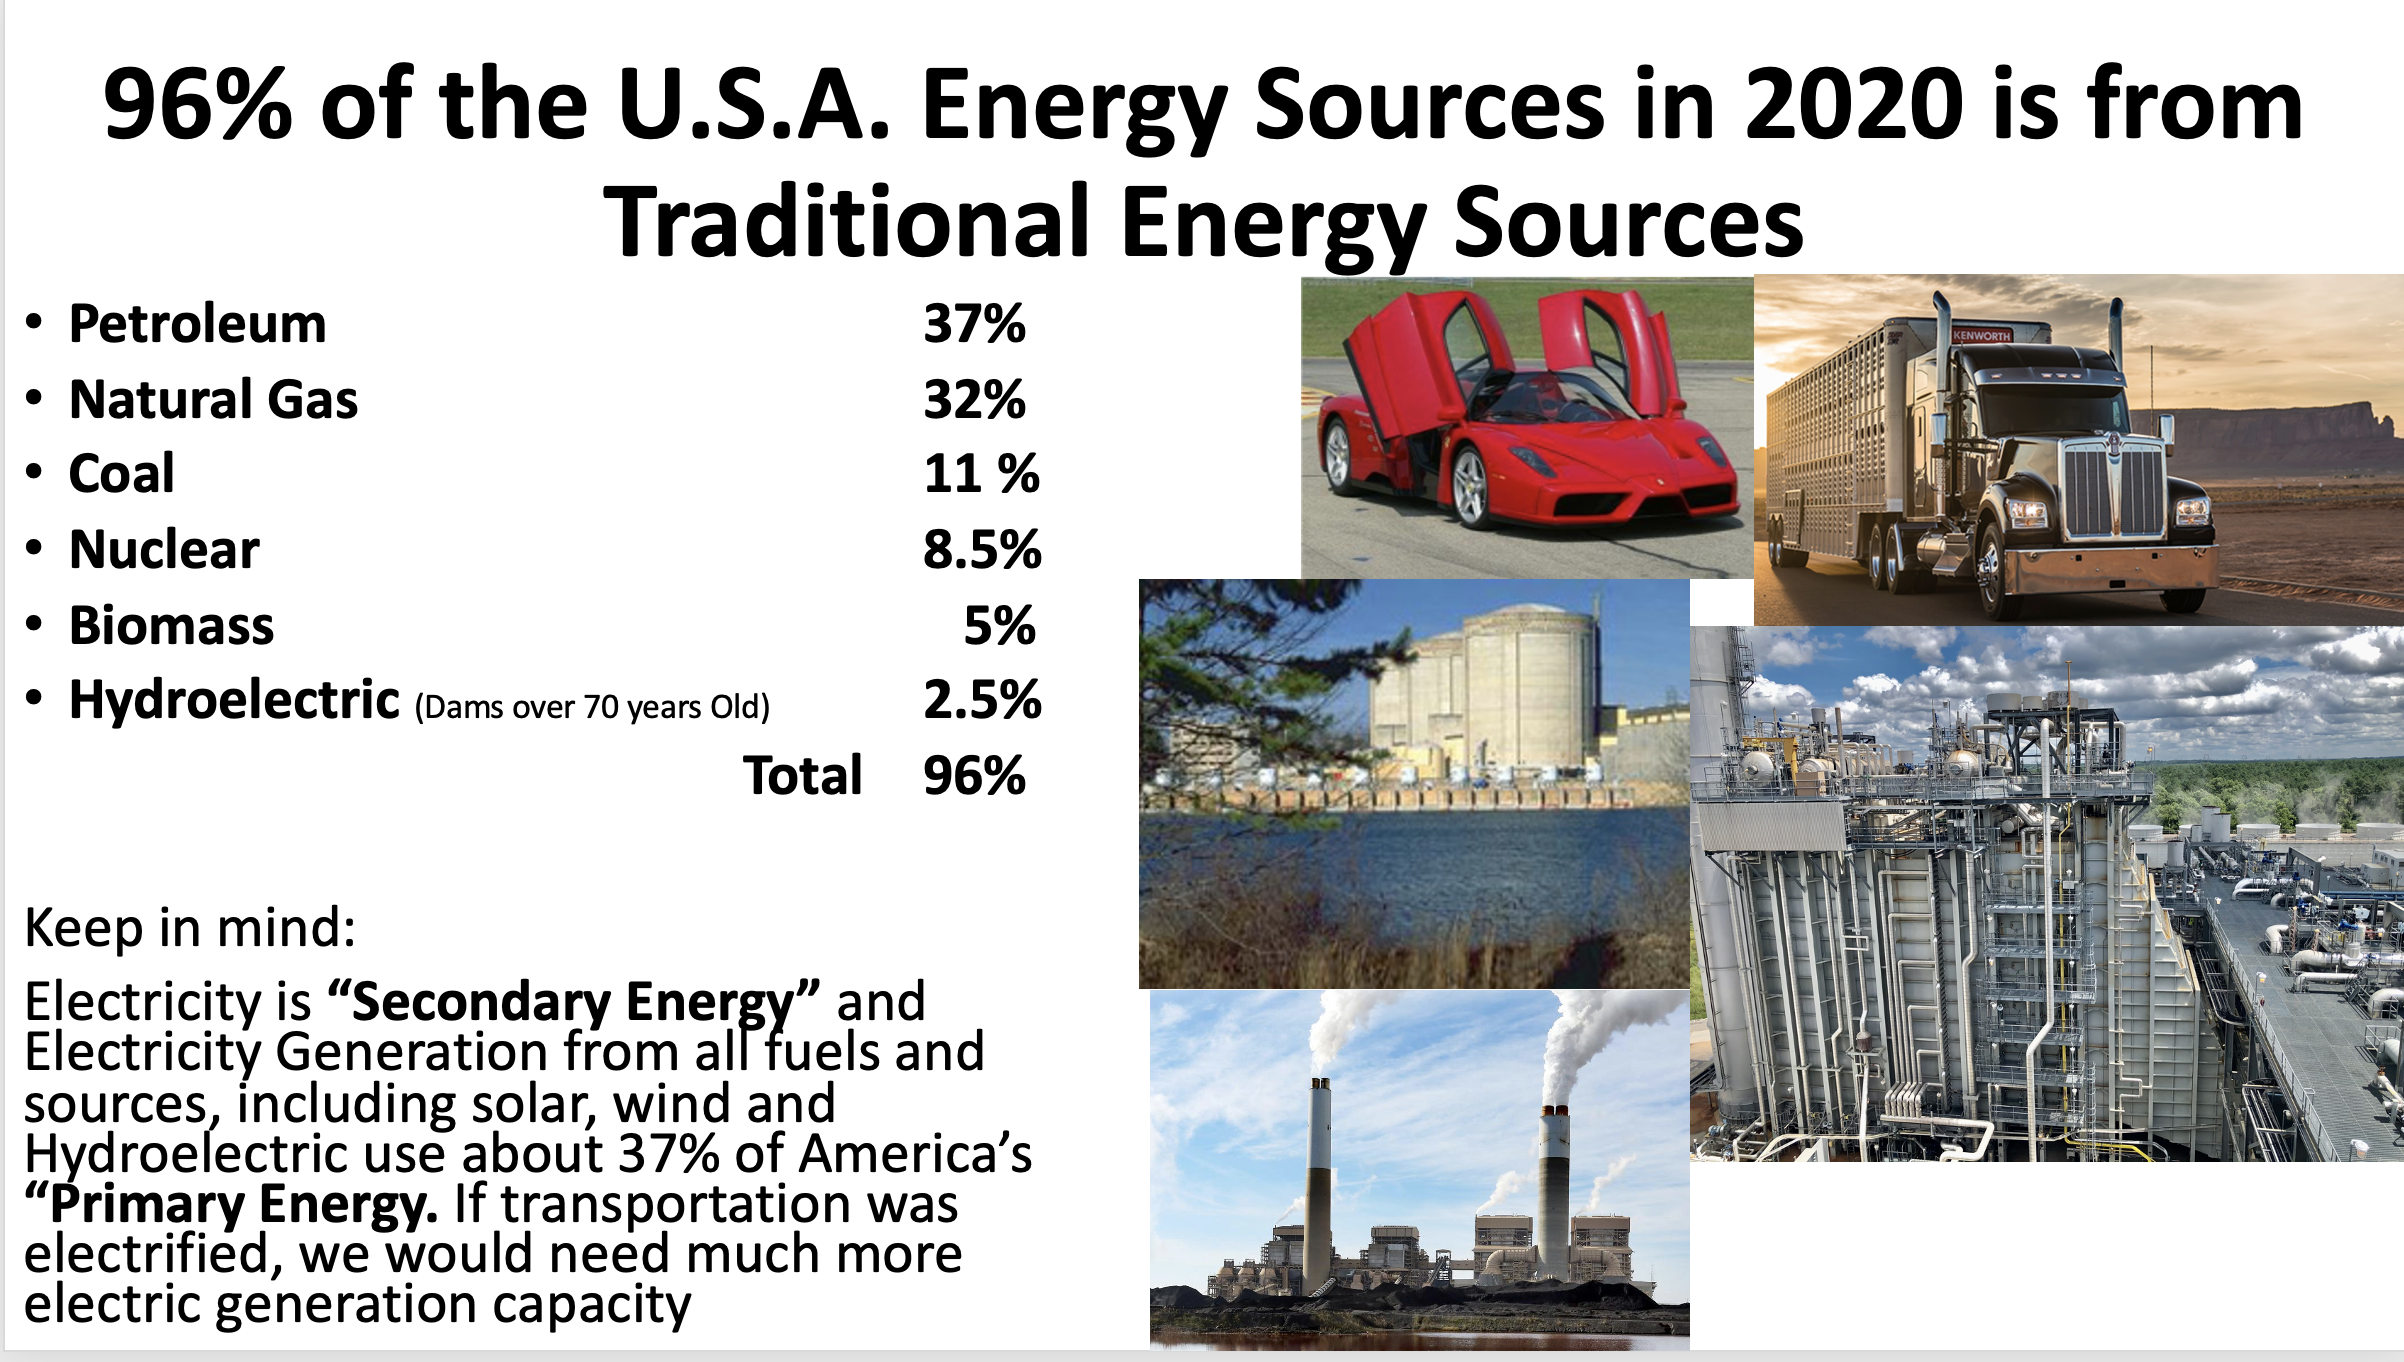
Each person that lives in a Developed Country and enjoys our high quality of life uses well over a million Btu’s per day. This post is a reminder of the importance of energy to power our lives and the sources of the energy we depend upon.
Introduction
The war on carbon has been going on for a long time. I have written my thoughts on the start of the war on carbon which has been escalating since the Clinton Presidency and was ramped up during Obama’s. The Biden Administration has further ramped up Climate Policies (aka war on carbon) which encompass the entire government, making the Clinton and Obama attacks on carbon compare as small nuisances. Then the United Nations Secretary General has piled on with his urging to ban investment in any fossil fuel production and to use the world’s financial institutions to cut off investment through ESG policies. The Main Stream Media and Entertainment and many “Woke Banks and large Businesses” have joined in to create a serious indoctrination program for the people of the world and tightened up the available financial investment to expand or modernize energy production facilities of any type. Not only the U.S., but the Climate Policies of the world to attain Net Zero Carbon by 2050 now has much momentum. The purpose of this post is to simply lay out the facts of the energy needs of today for anyone living in the Developed World.
The Importance of Energy
Energy use, economic prosperity and Quality of life go hand in hand. The title of one of Mr. Donn Dears recent books is: “NET-ZERO Carbon, The Climate Policy Destroying America”.
At first glance, the sub title, “Climate Policy Destroying America” may seem to be an exaggeration. The intention of this short essay is to show that Mr. Dears is correct, if we move toward Net-Zero Carbon too quickly, it will destroy the American way of life and will cripple our economy. The word “Sustainability” means to me, that we sustain our quality of life as Americans have enjoyed for many years. Energy, quality of life and economic prosperity are all related. Kindly stick with me and read to the end to review the importance of conventional energy.
100 Quadrillion Btu’s Per Year Energy Use
America has used right at 100 Quadrillion Btu’s (+/- 10) annually of energy for the last twenty years. The EIA and the Lawrence Livermore National Laboratory (LLNL) have calculated and published this data for decades. Here is an excerpt of the LLNL description from their website.
“The national economy is reenergizing, quite literally”
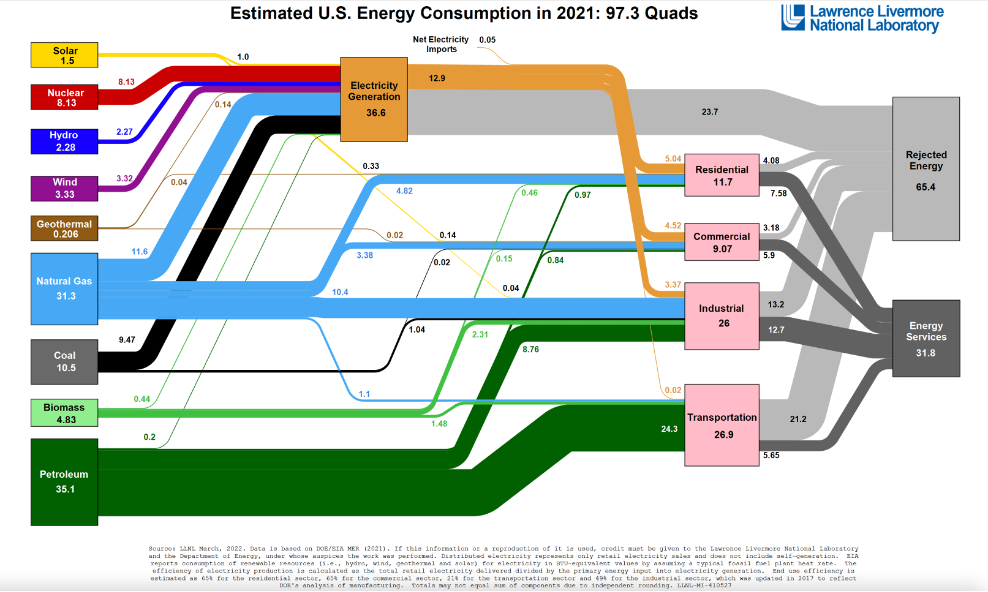
Each year, LLNL releases flow charts that illustrate the nation’s consumption and use of energy. In 2021, Americans used 97.3 quads (quadrillion BTU) of energy, which is 4.4 quads more than last year’s 92.9 quads, equivalent to a 5% increase. Both 2020 and 2021 annual energy consumption totals are less than 2018 and 2019, where Americans used more than 100 quads per year. A BTU, or British Thermal Unit, is a unit of measurement for energy; a BTU is the amount of heat it takes to raise 1 pound (~1 pint) of water by 1 degree Fahrenheit. 3,412 BTUs is equivalent to 1 kilowatt-hour, which is the amount of energy it takes to light an efficient LED lightbulb for a week. “ The chart below includes all forms of energy, including wind and solar which are included as the thermal equivalents of the electric power they produced. The chart shows “Total Primary Energy” which includes electricity generation, residential, commercial, industrial and transportation. This is my favorite chart for illustrating energy sources and uses. Suffice it to say, it is a lot of information in one chart.
LLNL Energy Flow Chart for year 2021
Please note the quantities of solar and wind which are 1.5 Quads for solar and 3.33 Quads for wind. Yes, this is an increase from previous years. However, the total wind and solar is 3.85 Quads or right at 4%.
My point is that Electrifying Everything if it were possible to take a magic wand and change all energy use to electric power, including heating, cooking, transportation and industrial production, then it will take a growth of 25 times what is installed now by nameplate power. When considering capacity factors of wind and solar it will actually be more like 75-100 times current installed capacity plus, technological advancements in energy storage would need to be accomplished. In essence, it is impossible to get there within 8 to 28 years (2030 or 2050) and still sustain our high quality of life and yes, our high standard of living. Not to mention Dispatchability, energy storage limitations and land use requirements. Also, the practical limitations of changing energy use for transportation, the second largest use of total primary energy after electricity generation, to electric or hydrogen power. How many of us would be willing to fly on a hastily developed hydrogen fueled jet aircraft? Change our lives to use EV’s for long distance drives? Give up the plastics, textiles and numerous other products that are created from oil, gas and coal? Let’s get back to what we do and enjoy through the use of today’s forms of energy.
So, How Much Energy, in Btu’s Does Each American Use per day?
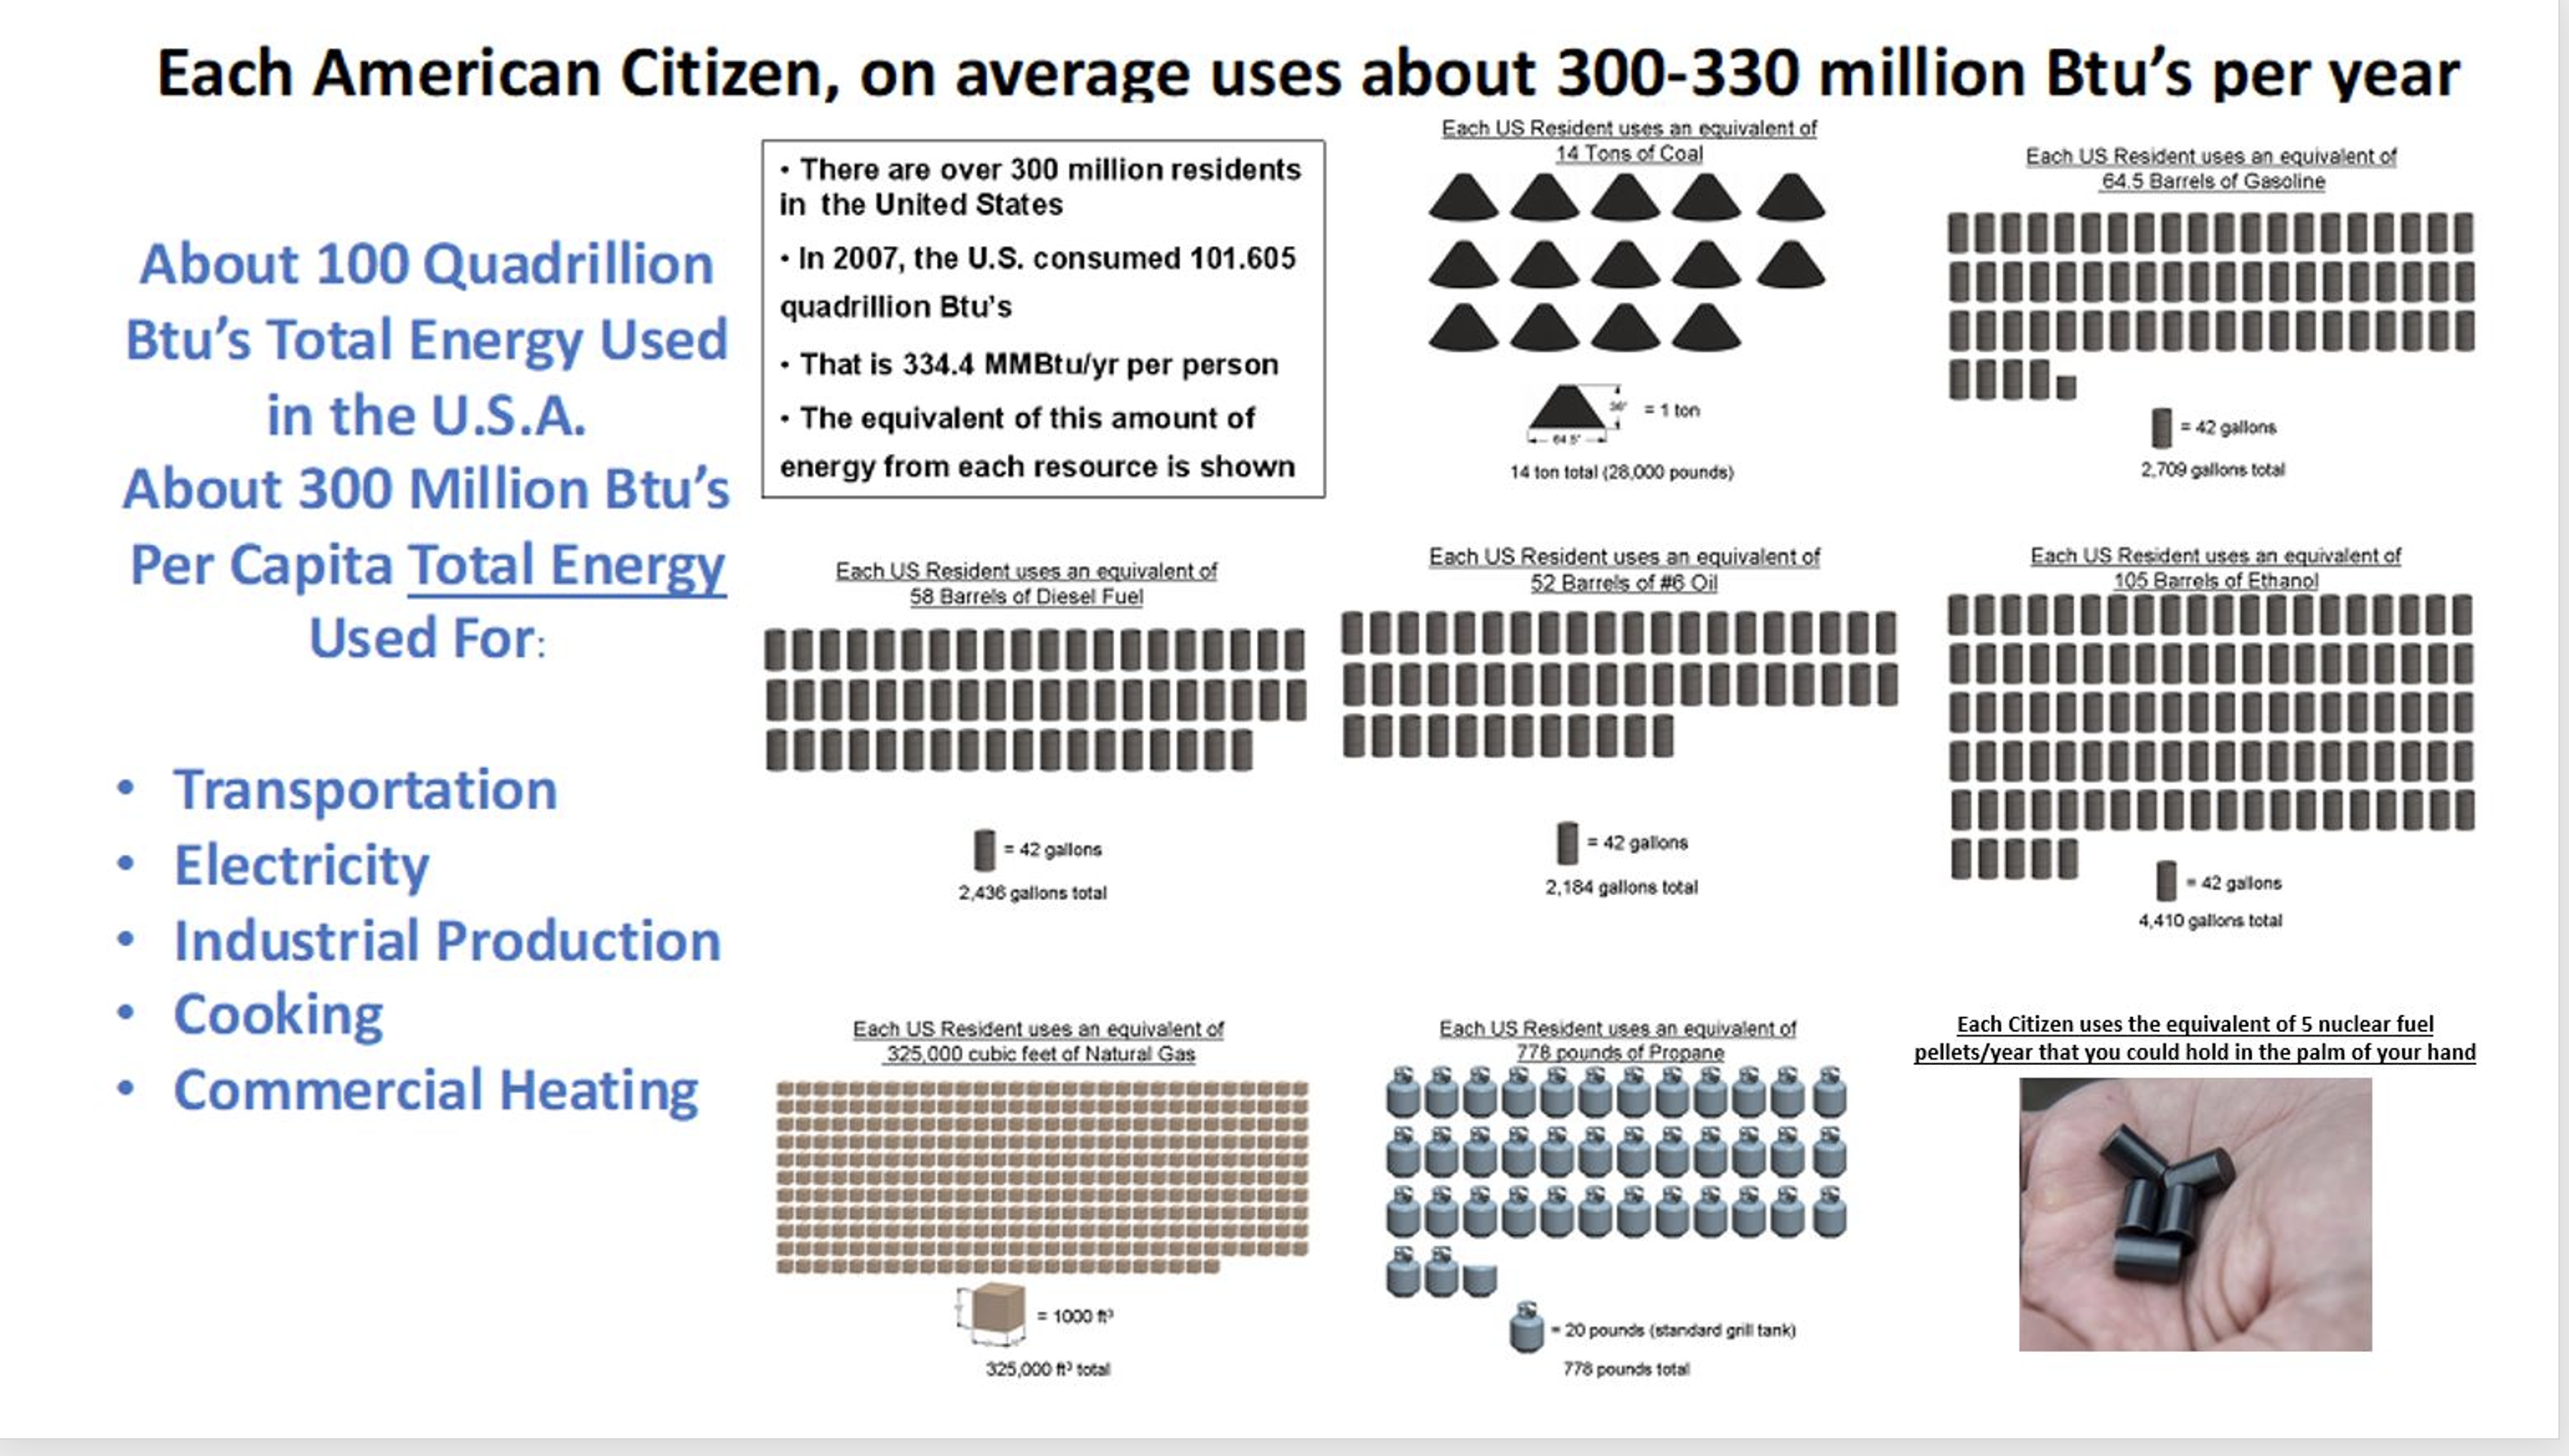
The illustration below was prepared to show a Middle School class the equivalent forms of energy they would use in a day. For our high quality of living, it is not hard to see how we depend on an average of about a million Btu’s of energy each day.
From Dick Storm presentation to Middle School Students, March 2022
Not shown in the illustration is the energy that is used on our behalf to provide industrial production, military defense and transportation of food and products to our local stores or even deliveries to our door via Amazon, Walmart, UPS, FedEx or other delivery services. Also, about 1% of America’s energy is used to produce fertilizer for farming, not including the fuel for tractors and processing food. All of these energy uses averaged out come to (in a good year) about 100 Quadrillion Btu’s. Remember, up to now, 4% are from wind and solar.
Does it seem reasonabe to expect that we can electrify everything? Including aircraft propulsion, all light vehicles, trucks, ships, trains, fertilizer and more? I don’t think so.
From Dick Storm Presentation to Middle School Students
Think about your day and both the necessities and the conveniences made available through the use of energy. My heading stated we use an average of about a million Btu’s per person each day. For those that will read this post, I suspect each of you are using far more than a million Btu’s per day. For example if a person takes a two hour flight on a airline, even at 80 miles per gallon per seat mile, the per person fuel for a 1,000 mile flight is about 12.5 gallons of Jet A. The plane trip alone uses about a million five hundred thousand Btu’s. The LLNL and EIA data that show our “average use per citizen” include children and folks that live very modestly and do not travel much. Also, the importance of energy used for Industrial production (including producing products from oil feedstock) which provides jobs and a productive economy cannot be underestimated. Industrial production to compete with China cannot be powered by solar and wind any time soon.
Summary and Conclusions
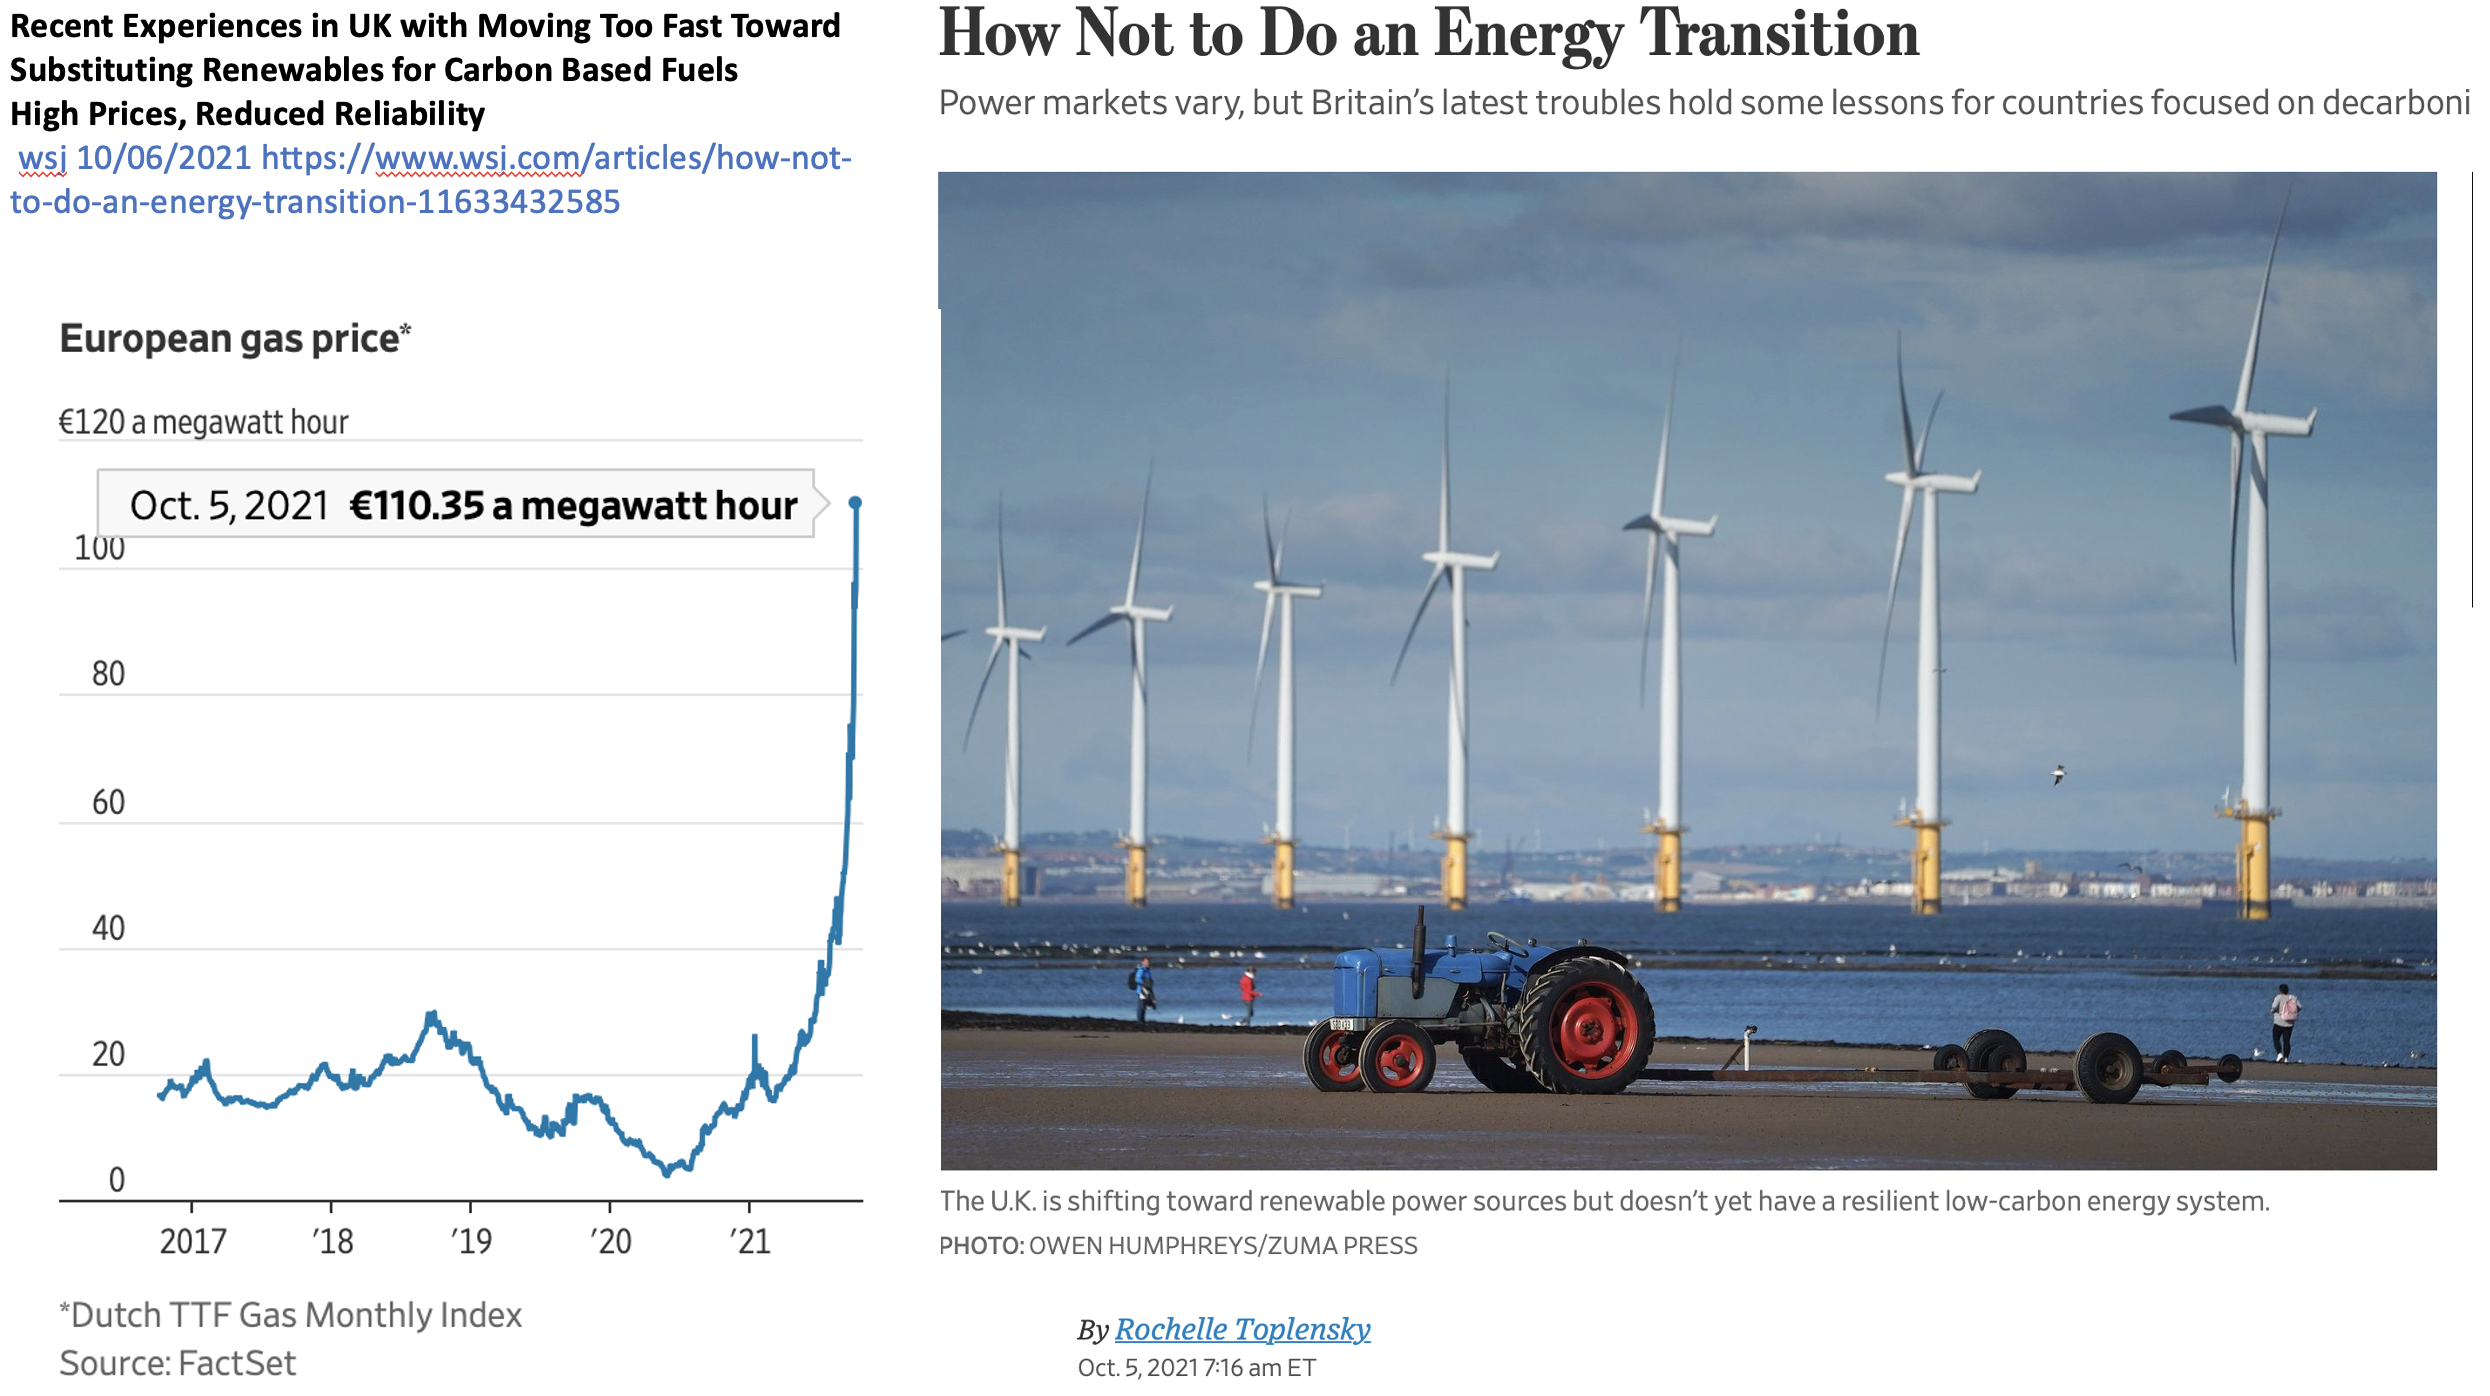
Where extreme priorities have been imposed to switch to renewables such as in Germany, the UK, Hawaii and Texas, there have been issues of high costs, unreliability and economic impact. Some references for further reading are provided below.
I agree with the Title of Donn Dears book, “NET-ZERO CARBON, THE CLIMATE POLICY DESTROYING AMERICA“
Dick Storm USCB-OLLI Courses, Energy and Electricity, History of Energy and Electricity and the Future of Energy and Electricity. The four parts of the “History of Energy and Electricity” are on my website: https://dickstormprobizblog.org
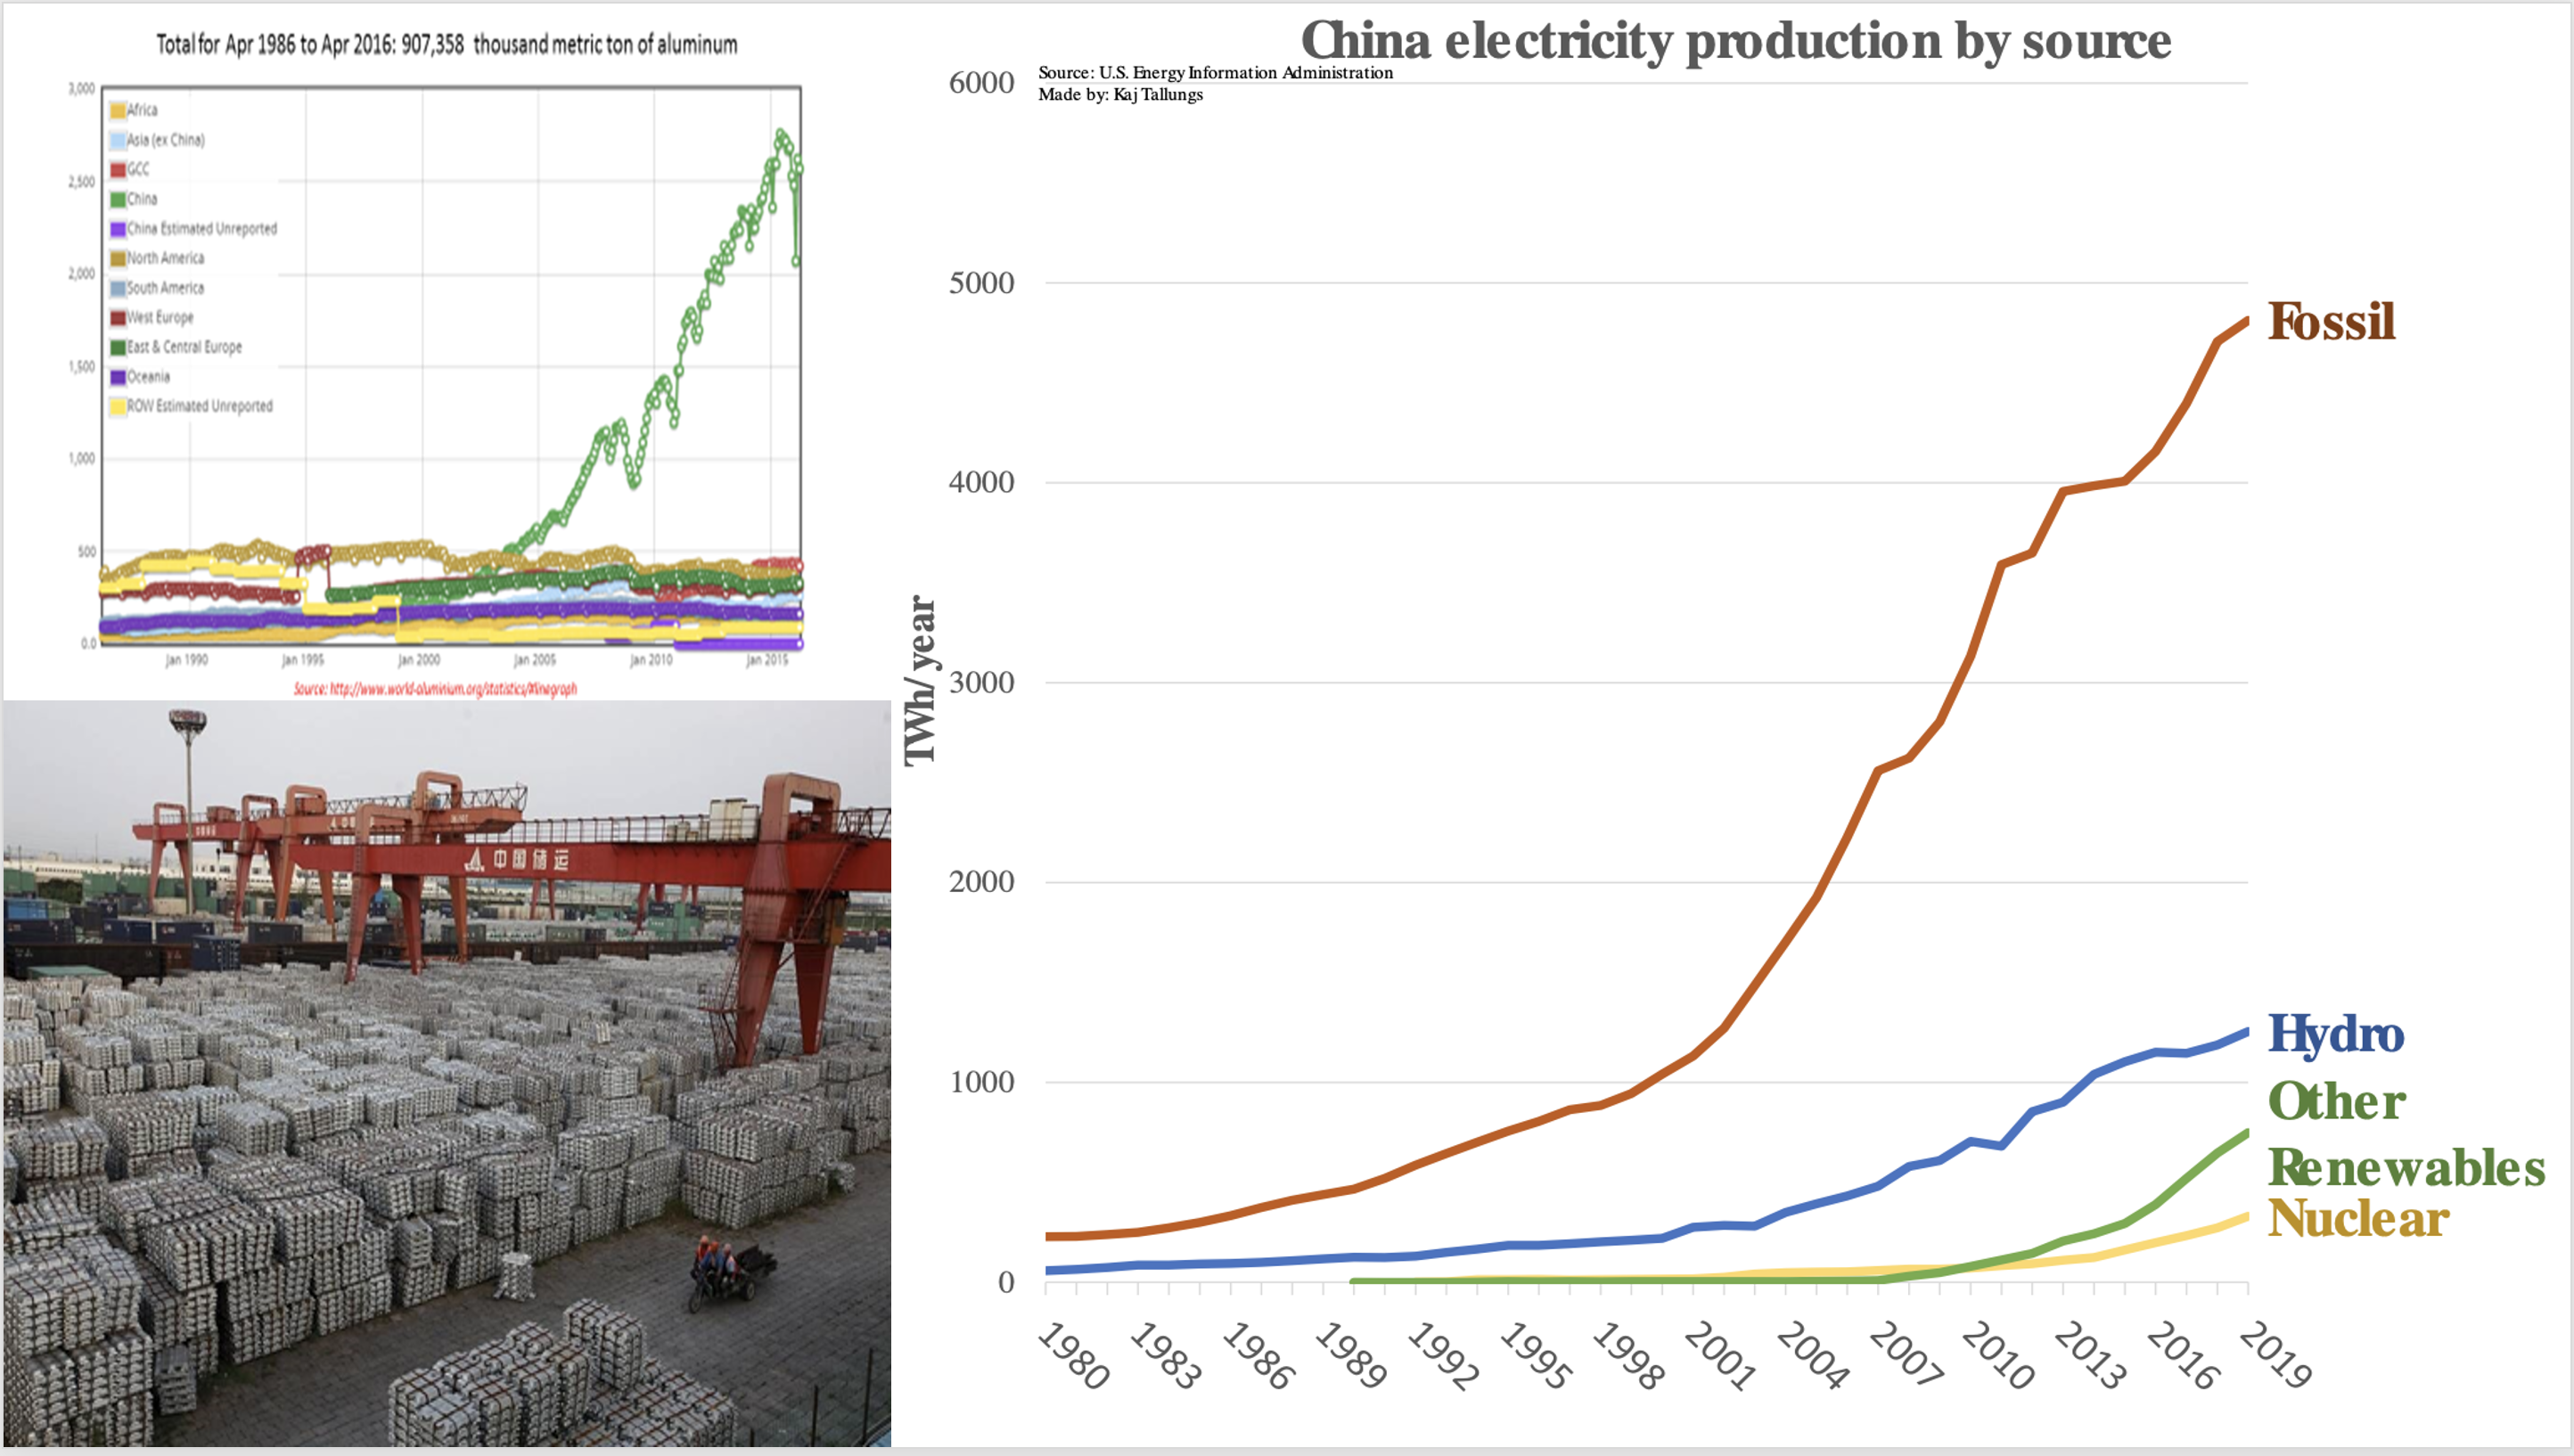
China entered the WTO in 2001. Since then it has increased in Manufacturing Might to become the World’s Largest Manufacturer and the World’s Largest Economy. To do so, it has built more electric power capacity in 20 years than the U.S. did in the preceding 150 years. China is a perfect example of how Energy and Economic Prosperity are inextricably related. First the U.S. showed the world how to use energy to replace muscle power by building our Industrialized economy using energy. This post, Part 4 shows how China has powered their manufacturing-based economy.
The relationship of energy and economic prosperity has always fascinated me. Parts 1-3 of this series focus on the America’s progress in energy development, electricity generation advances and rise in economic prosperity from 1850-2000. America during that 150 year period became the world’s largest Industrialized economy. Lifting millions of people from living in poverty to becoming the richest nation on earth.
That to me is impressive, but if we want a more recent example of the inter-relationship of energy and economic prosperity, China provides such an example. China’s climb to lift millions out of living in poverty over a couple decades is an amazing accomplishment. China used an aggressive “All Fuels are Important” policy become the world’s wealthiest country on a PPP basis (Purchasing Power Parity). From last to first in about 20 years.
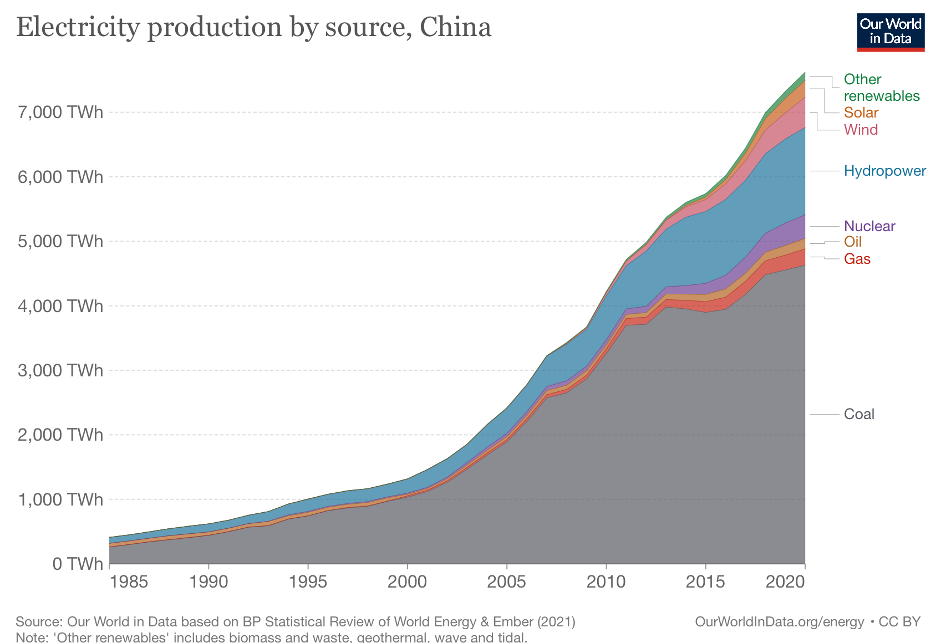
Like America’s rise a hundred years ago, the best interests of the people and the nation were put first, before restrictive regulations as we Americans (thanks to an out of control Bureaucracy) get hung up on. The following two charts show electricity growth and economic growth of China.
From Our World in Data, China’s Electricity Generation by Fuel Source
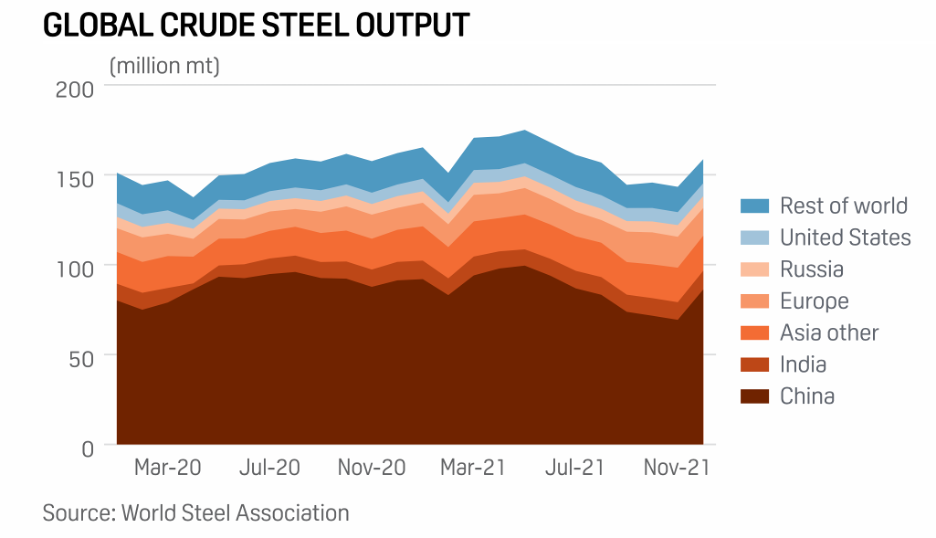
China entered the World Trade Organization in 2001 and immediately began ramping up manufacturing facilities for aluminum and steel production. In just fifteen years China went from insignificant steel and aluminum production to becoming the world’s leader and by 2016 was producing more than 50% of the world’s aluminum and steel.(3)
Dick Storm presentation to Delaware County Bar Association, July 2016World Steel Production, S&P Global, 2022
Leadership in Energy & Manufacturing, Creates Wealth of a Nation
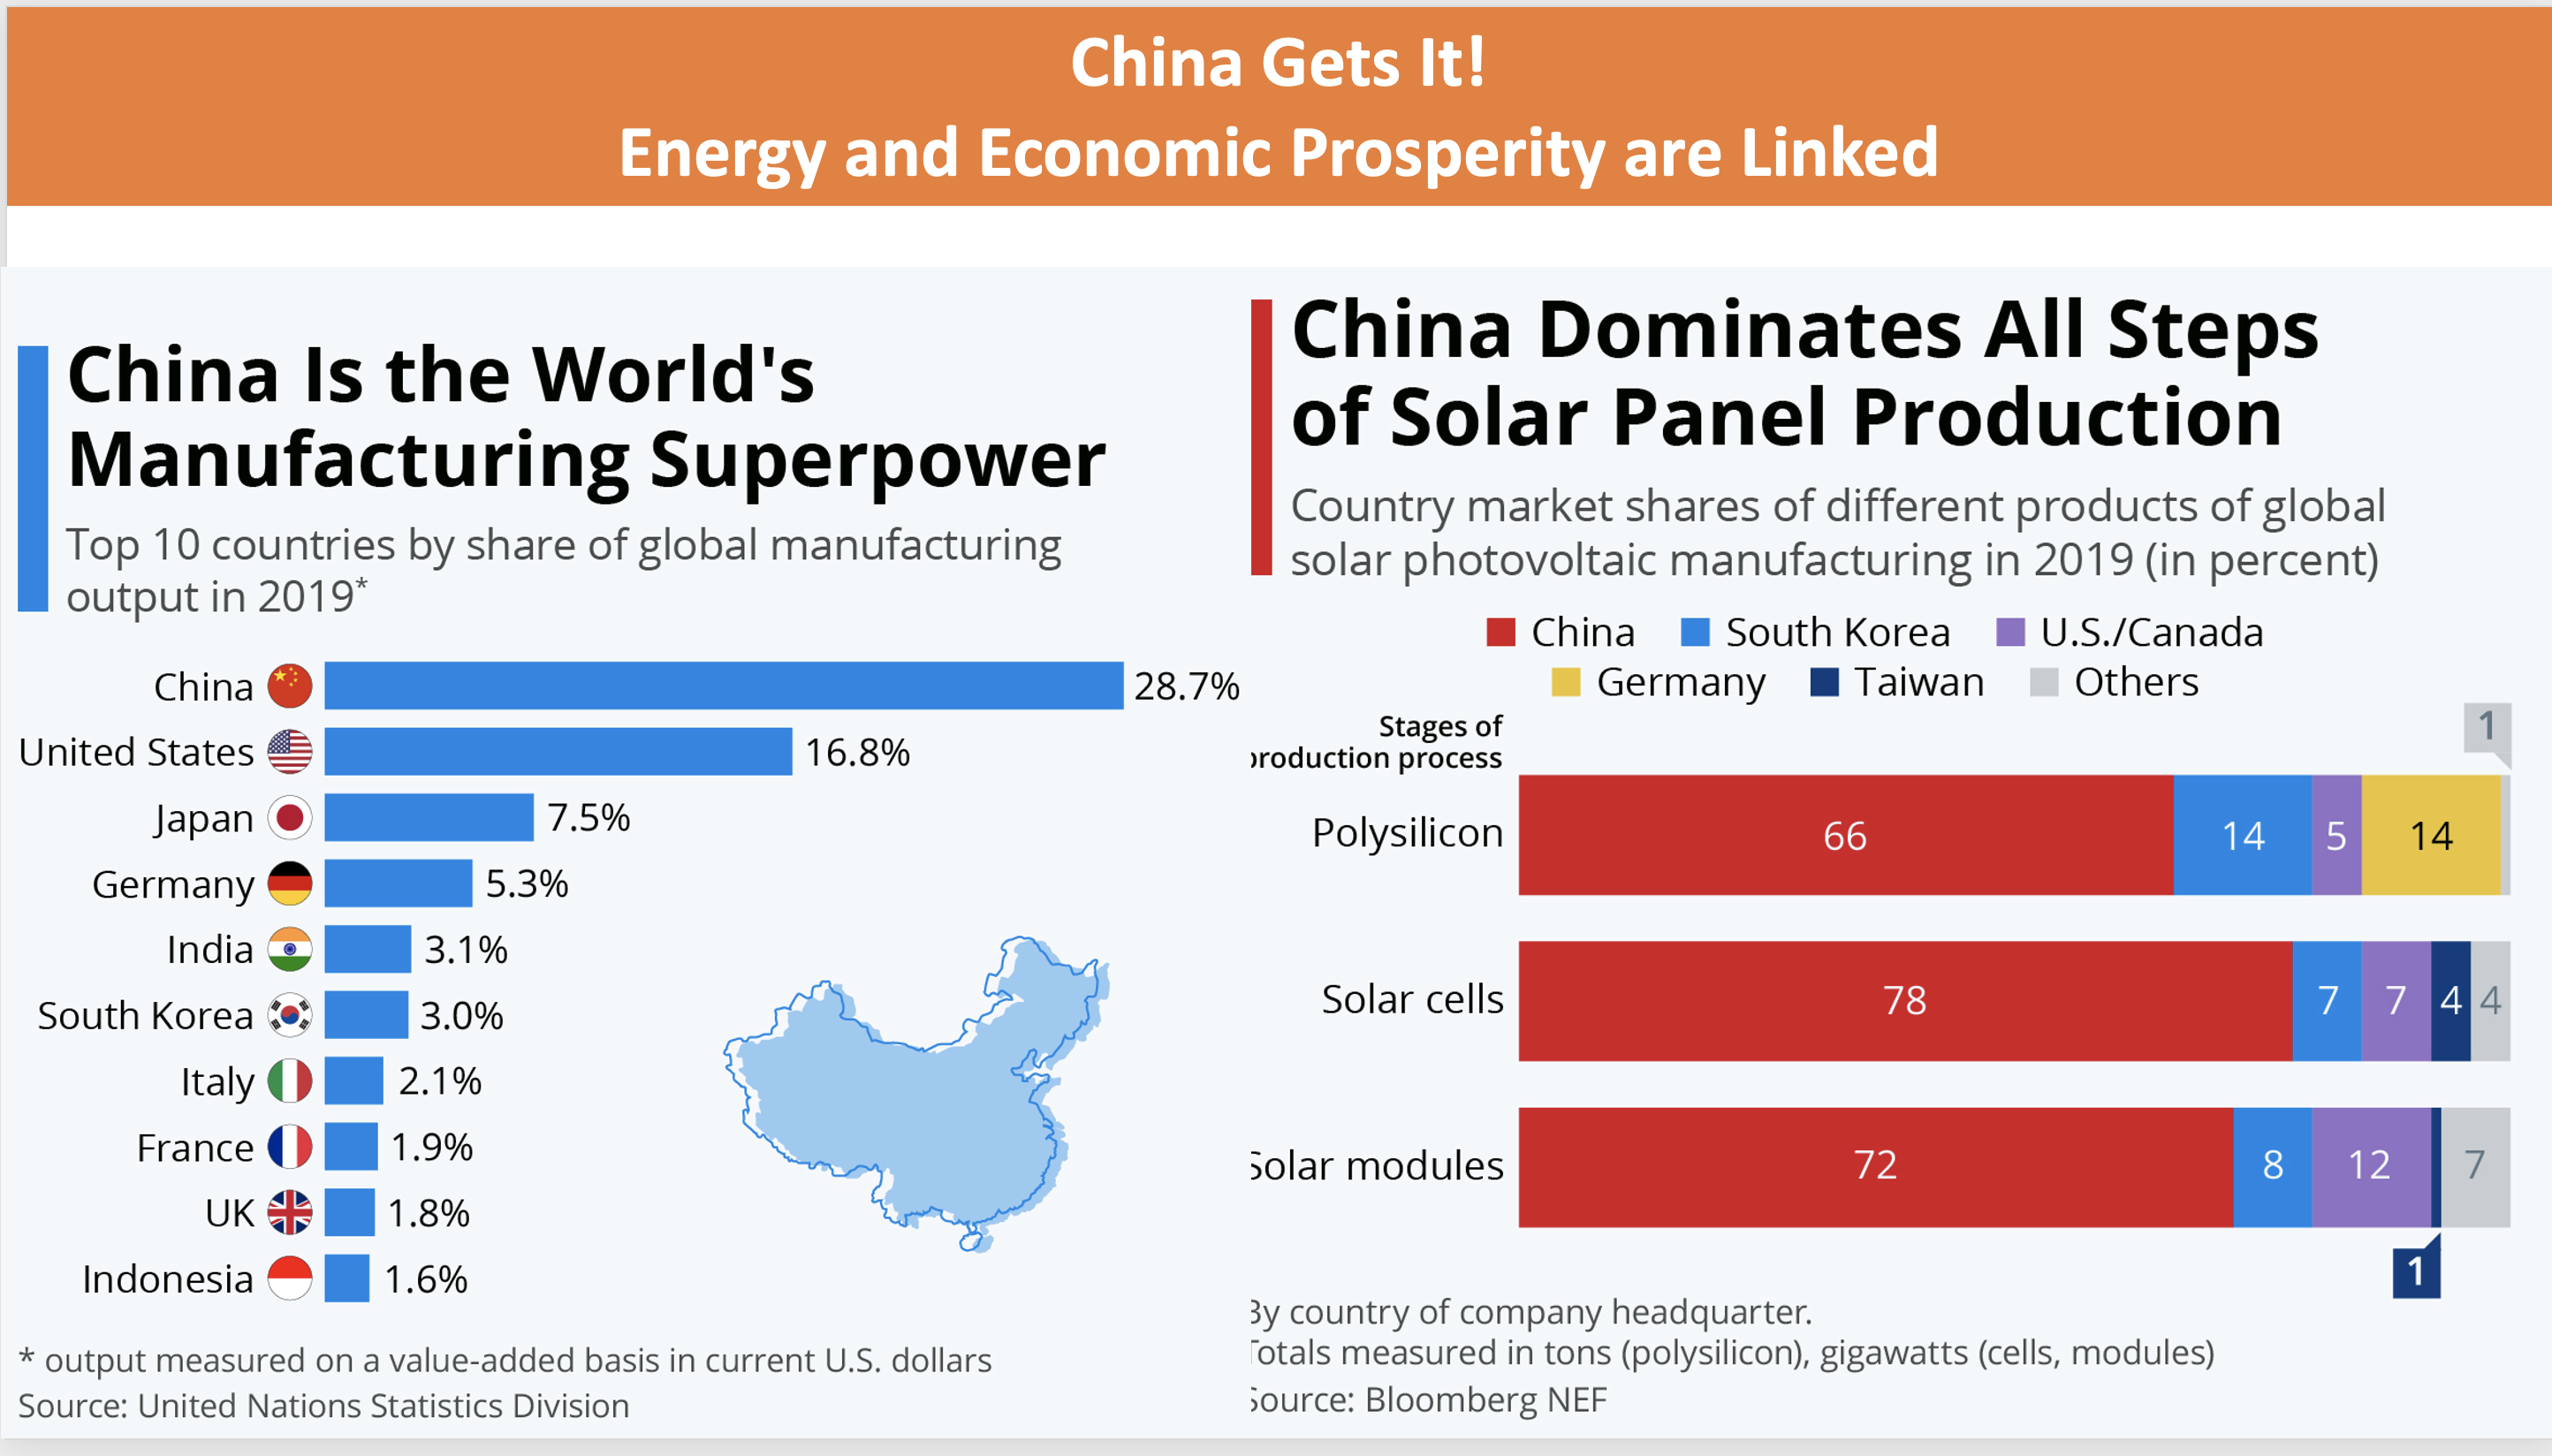
China has become the world’s largest manufacturer. This, unfortunately has been accomplished by many American businesses simply partnering or willingly yielding market share (along with 100 years of technological experience) to the Chinese. According to Statista:
From Statista 2022
China’s Electricity, Energy Sources and Plans for the Future
China has embarked on an aggressive path of “All Fuels are Important”. I have advocated this for many years for the U.S.A. As I covered in History of Energy and Electricity in Part 3, America invented, perfected and produced the first commercial nuclear power plants. We designed and built the best and cleanest coal plants. These U.S. plants were amongst the cleanest and most efficient coal plants in the history of power generation of all the world. Then, we quit. I would like to think “Paused” but with the Bureaucrats in Washington, Pausing means quitting. So, is it any wonder that China has passed us in manufacturing capacity? Worse yet, influence in the world. Getting back to China’s appproach to “All Sources of Energy are Important”.
I personally believe (along with many others(16) that most of Climate Change is from natural forces and that America’s energy security and reliability should be priority #1. Apparently on matters of Climate and Energy, China thinks like I do. Can’t think of much I agree with on China, but on “All Fuels are Important”, China and I do agree. For now, China is using enormous quantities of Fossil Fuels to power their Economy (and wealth, they own about 4% of American Treasury Bonds). Later, more nuclear and renewables will also be applied to their Grid. They already have the largest hydroelectric generation in the world. The Chinese have a good balance of Dispatchable generation and renewables.
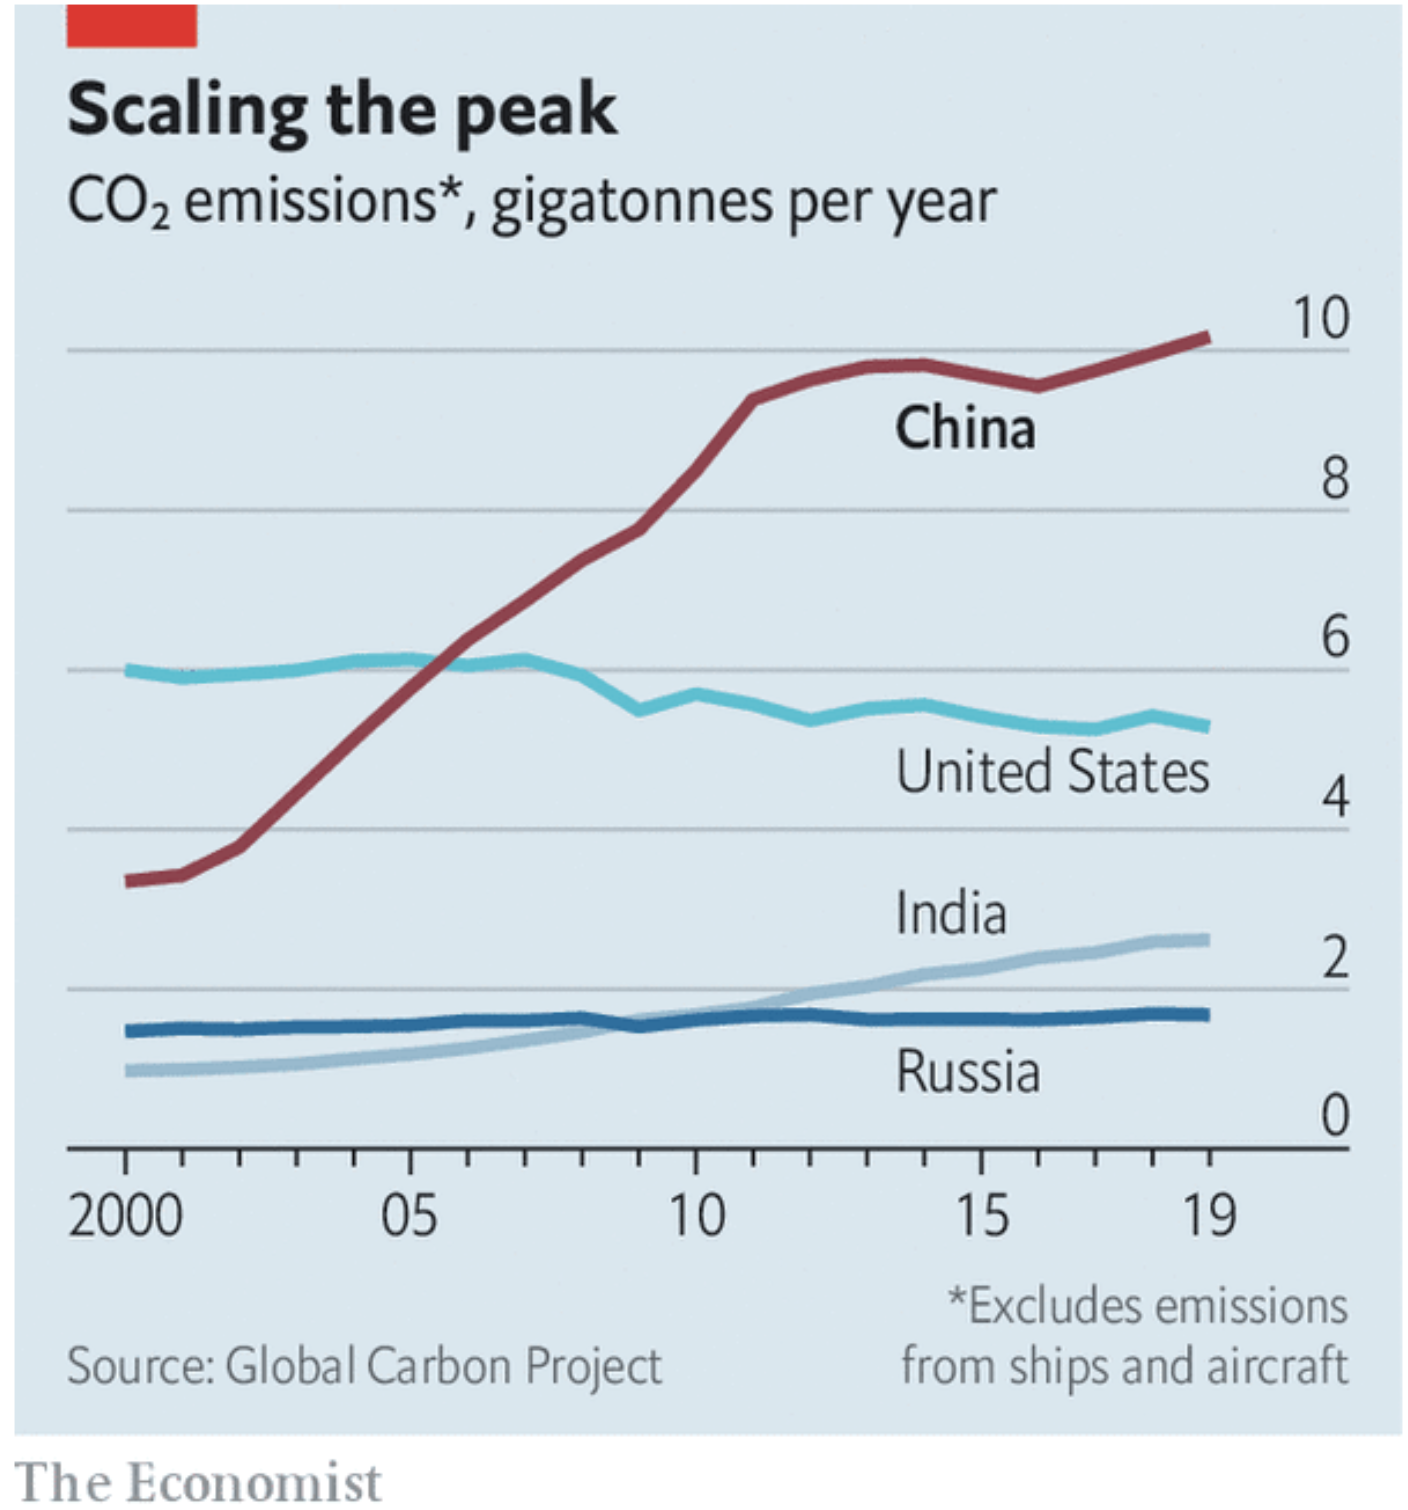
Economist Magazine
China’s Coal Plants
Time Magazine’s August 2021 issue(5) states that China plans to build 43 new coal plants. These are planned to be clean and efficient, but in fact, coal fueled.
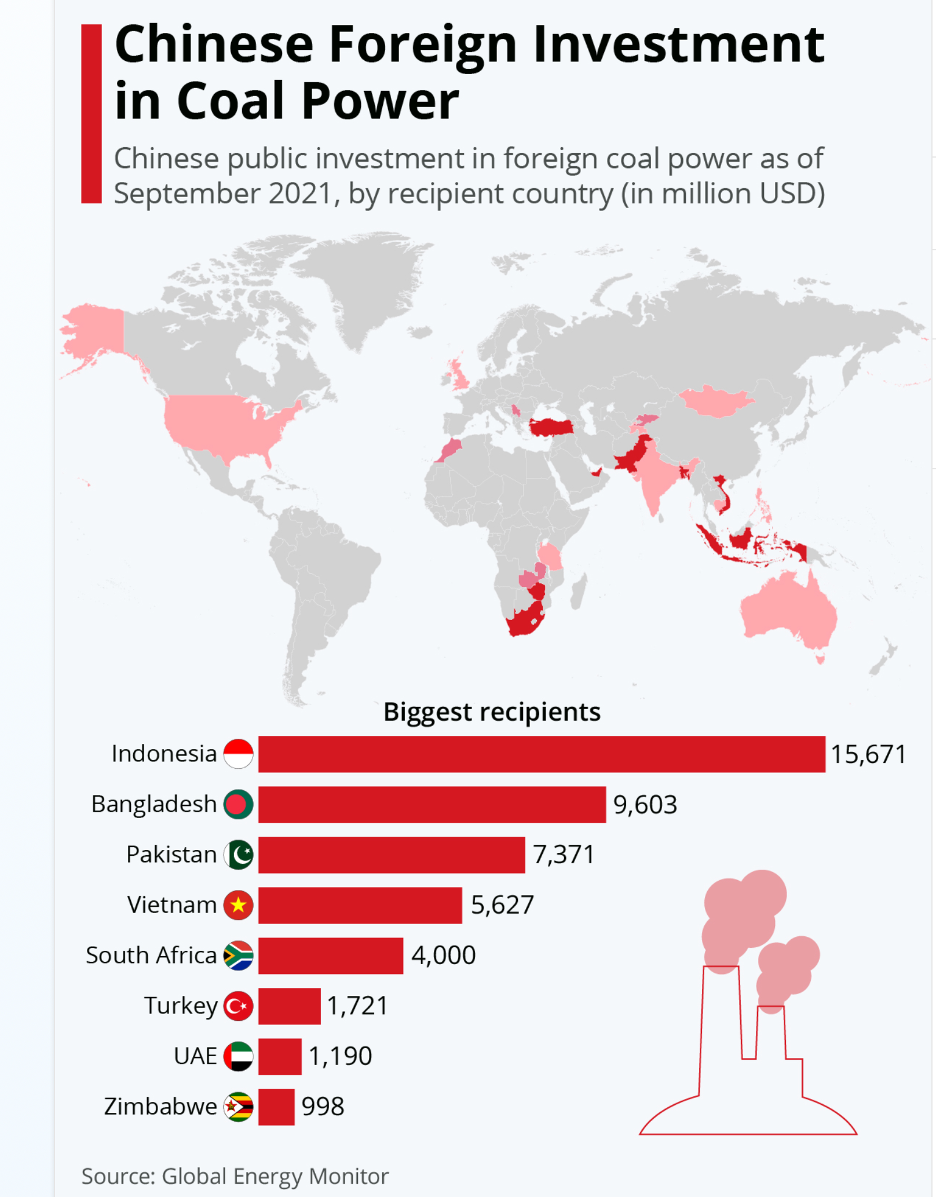
Not only are 43 coal plants planned to be built in China, but through their Belt and Roads Initiative, China is financing and building coal plants all over the world.(15) Reminescant of the way the U.S.AID did when I started my career in the 1960’s. Now, China is Financing, Manufacturing and Constructing power generation equipment and installing facilities all over the world.(7)
China is Building Coal Plants all over the World, not only in China
Nuclear Power
China does in fact have a forward path of matching electricity Demand with carbon-free nuclear power. Admiral Rickover and the U.S. Navy may have invented and perfected safe nuclear power generation but, China is the largest Benefactor from nuclear power generation. The new Westinghouse AP-1000 Units under construction by South Carolina Electric and Gas were stopped due to mismanagement and nine Billion USD in budget overruns. Southern Company’s Vogtle AP-1000 Units under Construction in Georgia are far over budget and behind schedule. Now planned for startup in 4th Quarter 2022(9)
China, on the other hand, plans 150 new nuclear plants and has already started up their Westinghouse AP-1000 Unit(10) Shandong Nuclear Power Co.’s Haiyang nuclear power plant is pioneering two significant aspects of nuclear diversification in China: district heating and desalination. Some of the other 150 nuclear plants are listed in the World Nuclear Association update of November 2021(11) China is on the way to leading the world in nuclear power generation.
Hydroelectric
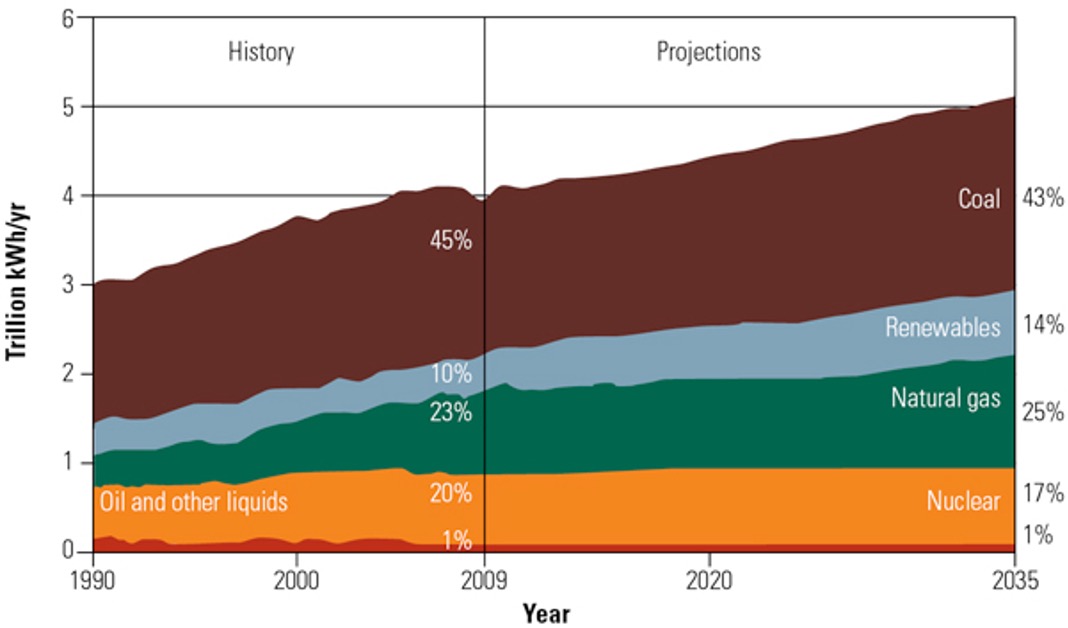
China generates more electricity than any other country from hydroelectric power. The “Three Gorges Dam” at 22.5 GW capacity , is the largest power station in the world.(13) Suffice it to say, China, like America has taken advantage of available river flows to install dams and hydroelectric generation. Still, most of the Dispatchable electric power must come from coal, nuclear and gas plants. The chart below was done by the EIA about 2017 to show what the U.S. Dept. of Energy Forecasted for China electric power generation through 2040.
Solar and Wind Generation
Renewables in China are also huge. (6) China is also the world’s largest manufacturer of solar and wind turbine components. The chart below shows the world renewables generation. Keep in mind, renewables are not “Dispatchable”. The variations in Demand must be handled by Dispatchable power generation capacity such as those conventional systems mentioned above. Namely, coal, gas, nuclear, hydro and to a small extent, oil fueled generators. The two blue lines at the lower right of the chart are wind and solar and worldwide total about 10% of generation. The majority of the Bulk Power generated from renewables is from Hydroelectric power.(13) Hydroelectric power, by the way, is Dispatchable.
IEA Global Energy ReviewIEA Global Ene rgy Review 2021
Conclusions
China has taken full advantage of All Sources of Energy and especially all forms of energy used to generate electricity. They have used their enormous wealth from exporting manufactured products to provide funding to build more manufacturing capabilities and to expand their influence to other countries of the world. China is a current example of how abundant and reliable energy can be used to accummulate wealth and influence in the world. Another metric of how the rapid build out of manufacturing capacity has increased wealth is to consider that four of the 10 largest banks in the world are Chinese owned.(14)
China understands the importance of “ALL Fuels are Important”. Meanwhile, the U.S. leadership is attempting to crush our major energy producing companies through excessive regulations and restrictions as well as foolish “Woke” social policies.(1) Then there is the foolish ESG Movement favored by the Democrat Party, the World Bank, Blackrock, major U.S. Banks and many U.S. manufacturing and Media corporations. The “Woke” ESG movement is weakening America and strengthening China, Russia, Iran and other countries not aligned with Freedom loving western nations.
It would be wise for our elected officials to wake up. We can only hope and pray that they do so before it is too late.
AMERICA BUILDS THE CLEANEST, MOST EFFICIENT COAL PLANTS IN THE WORLD, ACHIEVES ENERGY INDEPENDENCE, BEGINS RESHORING AMERICAN MANUFACTURING, CLEANS OUR AIR AND THEN….
COMMITS SELF INFLICTED ENERGY EUTHANASIA
My intention for the first two parts of the “History of Energy and Electricity Generation” was to outline the importance that energy and electricity played in improving our quality of living & growing our economy to become the largest in the world. America is still the world’s largest economy, but if we continue on the Net Zero Carbon Path of the “Green New Deal” then America will become weaker and China’s influence in the world will exceed America’s. Perhaps not a problem if China was run by Boy Scouts with high morals. But, the CCP does not share our values.
At current trends of economic growth, China’s GDP is likely to surpass the U.S.A.’s before 2030. The Sub-Title of this post is a reminder that during the Obama Presidency America’s Energy Policy was essentially committed to a Self-Inflicted path of energy euthanasia for our great country. Meanwhile, China ramped up energy production from All Fuel sources. I have written before on the relationship of energy and economic prosperity. That was the theme of parts 1 & 2 of this series. Abundant, reasonable cost energy fueled America’s economy for all of the 20th Century as America became the most productive country in the world with the world’s largest economy.
TWO MAGNIFICENT POWER PLANTS MADE IN THE U.S.A
On a positive note, let’s start with a description of two magnificent Ultra-supercritical clean coal plants. Made in the U.S.A. and amongst the best coal plants ever built. We should have more like these being built now!
AEP Company’s John Turk Ultra-Supercritical Power PlantTurk Plant Boiler Island and Some of the Air Emissions Control Equipment
The Best Clean Coal Plants Ever Built, Sadly amongst the last ones Built in the U.S.A.
In December 2012 one of the finest examples of American Clean Coal Plants started up. The 600 MW John W. Turk Plant in Arkansas. Power Magazine(3) awarded the plant the highest honor in 2013 for clean, reliable and efficient power generation. Here below is an excerpt of the article in POWER Magazine.
“AEP’s SWEPCO requested proposals in December 2005 for new generation to meet long-term capacity needs, and by August 2006 the company settled on coal-fired technology for a new plant site in Arkansas. Construction began in early 2008, and the new plant entered commercial service in December 2012. For overcoming numerous legal and regulatory obstacles and for building the first ultrasupercritical plant in the U.S., the John W. Turk, Jr. plant is awarded POWER’s 2013 Plant of the Year Award.
The new 600-MW John W. Turk, Jr. Power Plant owned by American Electric Power’s (AEP) Southwestern Electric Power Co. (SWEPCO) is located on a 2,800-acre tract near Fulton, in Hempstead Country, Arkansas, about 20 miles northeast of Texarkana. The Turk Plant, the first modern plant in the U.S. to commercialize ultrasupercritical (USC) boiler technology, was officially declared commercial on Dec. 20, 2012.”
The specifications are impressive. The steam generator is rated at 650 MW power generation capacity. The steam generator evaporates 4,420,000 pounds per hour of water to superheat to 1,100 degrees F. Think about what that means. Four million pounds per hour, if it is expressed as gallons per minute, the evaporation rate is the equivalent flow in GPM of about 8,800 gallons per minute. This quantity of water is pumped at a pressure of over 4,400 pounds per square inch and then super-heated to over 1,100 degrees F. every minute. That still impresses me to think about it. Thanks to the American metallurgical and welding technology, the ASME Boiler and Pressure Vessel Code and over 150 years of experience, that is one of the American Power Industry’s most magnificent accomplishments, in my opinion.
Plants such as Turk can do this 24/7 constantly and at a high-capacity factor. Unlike Wind or Solar Power, the Turk Plant is fully Dispatchable too. That is why I describe plants such as Turk and Longview as magnificent! They are truly engineering marvels.
Another example of a modern, efficient supercritical coal plant is the Longview Power Plant near Morgantown, West Virginia. Longview has also attained the accomplishment of becoming the most efficient coal plant in America (different years for Turk and Longview)
Longview Power Plant Located in WVA, Award for Most Efficient Power Plant in U.S. in 2016 by POWER Magazine
Both Turk and Longview are clean coal plants equipped with Flue Gas Desulfurization equipment, Baghouses for particulate collection and Selective Catalytic Reactors for Oxides of Nitrogen correction. Called “Clean Coal because the truly harmful pollutants have been removed.
These two highly efficient HELE Plants, (HELE=High Efficiency Low Emissions) are amongst the last several major coal generating plants built in America. That’s right, about 2012 marked the end of new coal plant design and construction of coal plants in America. Few people outside the power industry understand the implications of what this means for our future.
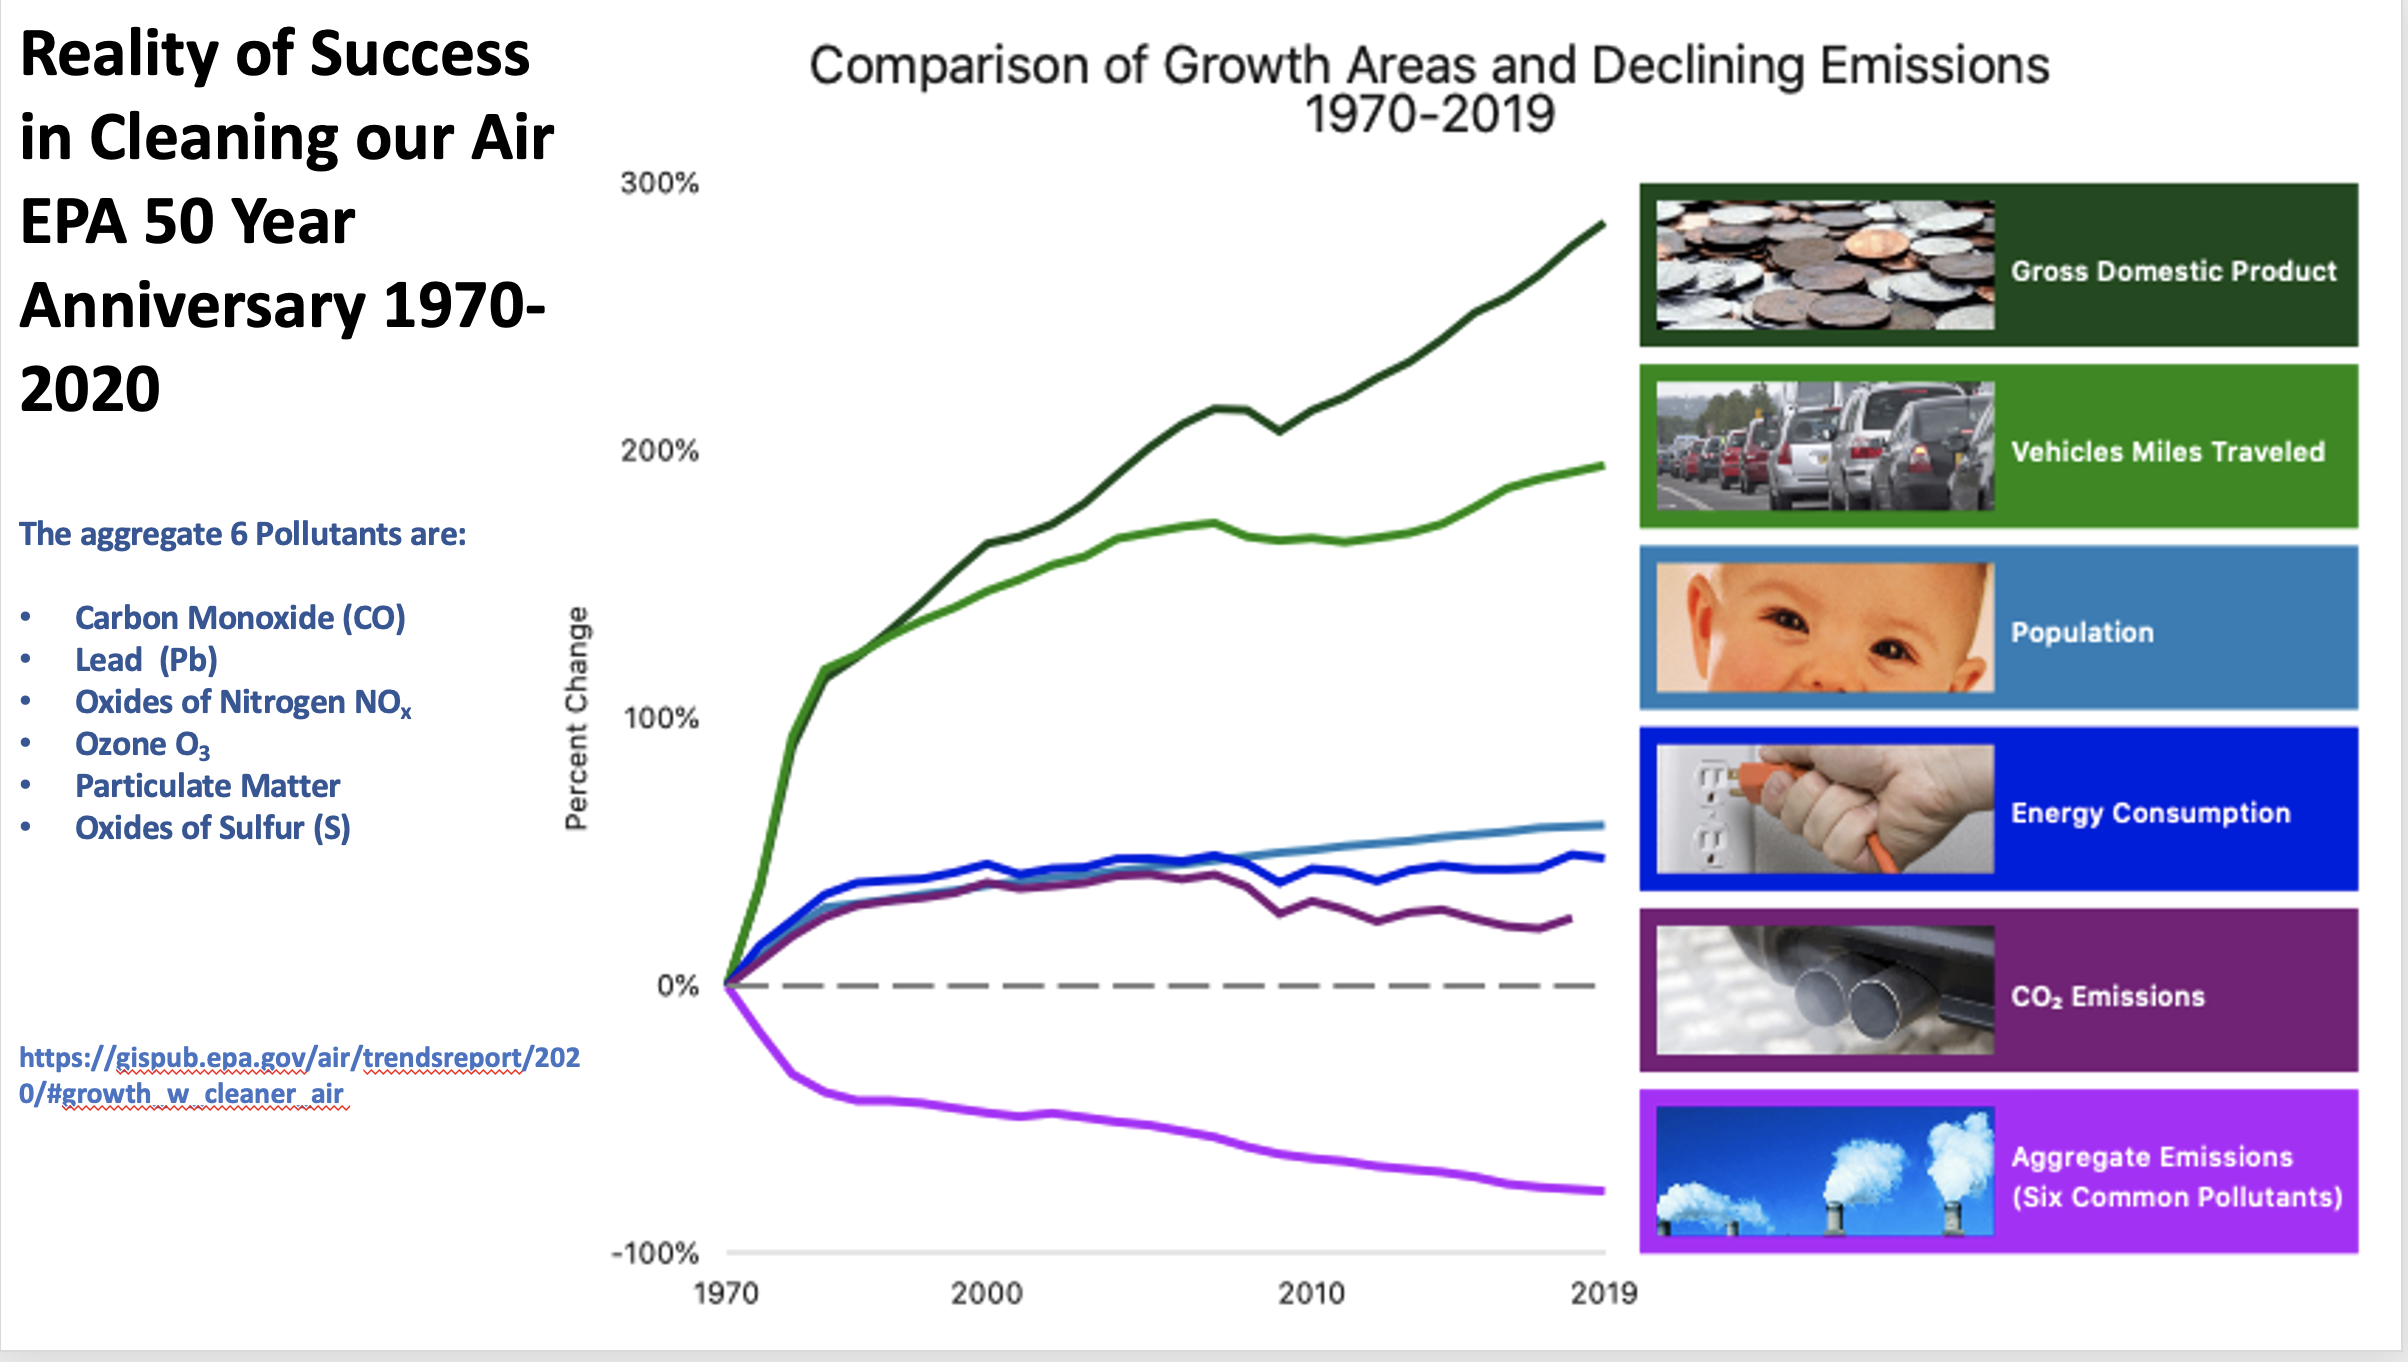
Let me state here that I worked my entire career in the pursuit of excellence in coal power generation. Including efficiency and emissions improvements. I believe in clean air and clean water. The EPA was needed in 1970 because acid rain, fine particulates and ground level ozone were problems which large coal fired power plants contributed to. The success of the efforts of the EPA to clean the air is best described on the chart below which is prepared by the EPA(11).
EPA Comparison of Economic Growth and Air Quality 1970-2018
From my viewpoint, cleaning the air of harmful emissions was accomplished by the time that Obama became President. From that point on, the EPA was weaponized against the best interests of America. Weaponzizing the EPA to create what I call, Energy Euthanasia. It continues today with the Climate Policies that are Destroying America. Check reference # 15 below, Donn Dears Book entitled, “NET-ZERO CARBON, THE CLIMATE POLICY DESTROYING AMERICA”
Weaponizing the EPA:
Commiting to the Present Path of Climate Policy has Seriously Wounded America’s Supply Chain for Power Generation Equipment
The Obama years 2008-2016 set a course for American Energy that were very difficult. Especially for coal power. During Obama’s Presidency, he led the EPA to declare that Carbon Dioxide should be regulated. This was later, upheld by the Supreme Court, the CO2 regulations, right or wrong, became the law of the land. Here is a short summary of how the “War on Coal” during the Clinton administration ratchetted up to becoming “The War on Carbon” and becoming lethal for American Energy Independence, the Fossil Power Plant Equipment Supply Chain & the Economic growth and prosperity that Energy Independence provides.
According the WSJ April 18, 2009, “In 1998, the Clinton administration EPA studied the question and determined that the Clean Air Act was “potentially applicable” to CO2 and other greenhouse gases. But despite continued pressure from environmental groups, the Clinton administration never moved to regulate the gases.
The EPA lumped carbon dioxide with five other gases — methane, nitrous oxide, hydrofluorocarbons, perfluorocarbons and sulfur hexafluoride — into a single class for regulatory purposes. That’s because they share similar properties: All are long-lived and well-mixed in the atmosphere; all trap heat that otherwise would leave the earth and go into outer space; and all are “directly emitted as greenhouse gases” rather than forming later in the atmosphere.”
According to the bulk of somewhat biased scientific research, such as that assembled by the Intergovernmental Panel on Climate Change, the more greenhouse gases there are in the atmosphere, especially carbon dioxide, the more heat is trapped. That leads to rising temperatures. The EPA endorsed the (Politically Biased) IPCC research and specifically said that “natural variations” in climate, such as solar activity, couldn’t explain rising temperatures. For the record, I believe that global rising temperatures have mostly been from natural forces for thousands of years, even before the Ice Age. I am not a Climate Scientist, but there are many highly qualified well credentialed Climate Scientists that I agree with. Such as Professor Richard Lindzen, Judith Curry, Roy Spencer, John Christy, Steven Koonin and many more. Here below is an excerpt from Koonin’s book, “Unsettled, What Climate Science Tells Us and What it Doesn’t and Why it Matters”(18) His closing thoughts are in green font below:
Dr. Steven E. Koonin is a leader in science policy in the U.S. He served as Undersecretary for Science in the Dept. of Energy under President Obama.
“What we think we should do, in short, is begin by restoring integrity to the way science informs society’s decisions on climate and energy-we need to move from The Science back to science. And then take the steps most likely to result in positive outcomes for society, whatever the future might hold for our planet. As President Biden exhorted in his inaugural address, “We must reject the culture which facts themselves are manipulated, or even manufactured”
In my opinion, Dr. Koonin is correct, we should let science get back to science and that much of the huge volumes of research on manmade climate change has been politically inspired, not science inspired.
The current policy of “Net Zero Carbon” has been based on politically biased science and is driven by special interests, but not in the best interests of America.
Further, the Chinese for one country outside the U.S. have worked to influence alarm with American University students to go green. See reference below (10) where Professor Lindzen of MIT writes on China’s recent actions.
China is Fortifying Their Supply Chain, While We are Self-Inflicting Harm on Ours
The Weaponization of carbon became very effective during the Obama Administration. Interrupted by President Trump and then intensified under the Biden Administration. The path to harm the Fossil Power Systems and Fossil Power Production was ratcheting up to becoming more and more lethal. (Lethal to the Made in U.S.A. supply chain) Electricity prices were kept reasonable and the Greenhouse Gas emissions reduced during this time, thanks to the Shale Gas Revolution.
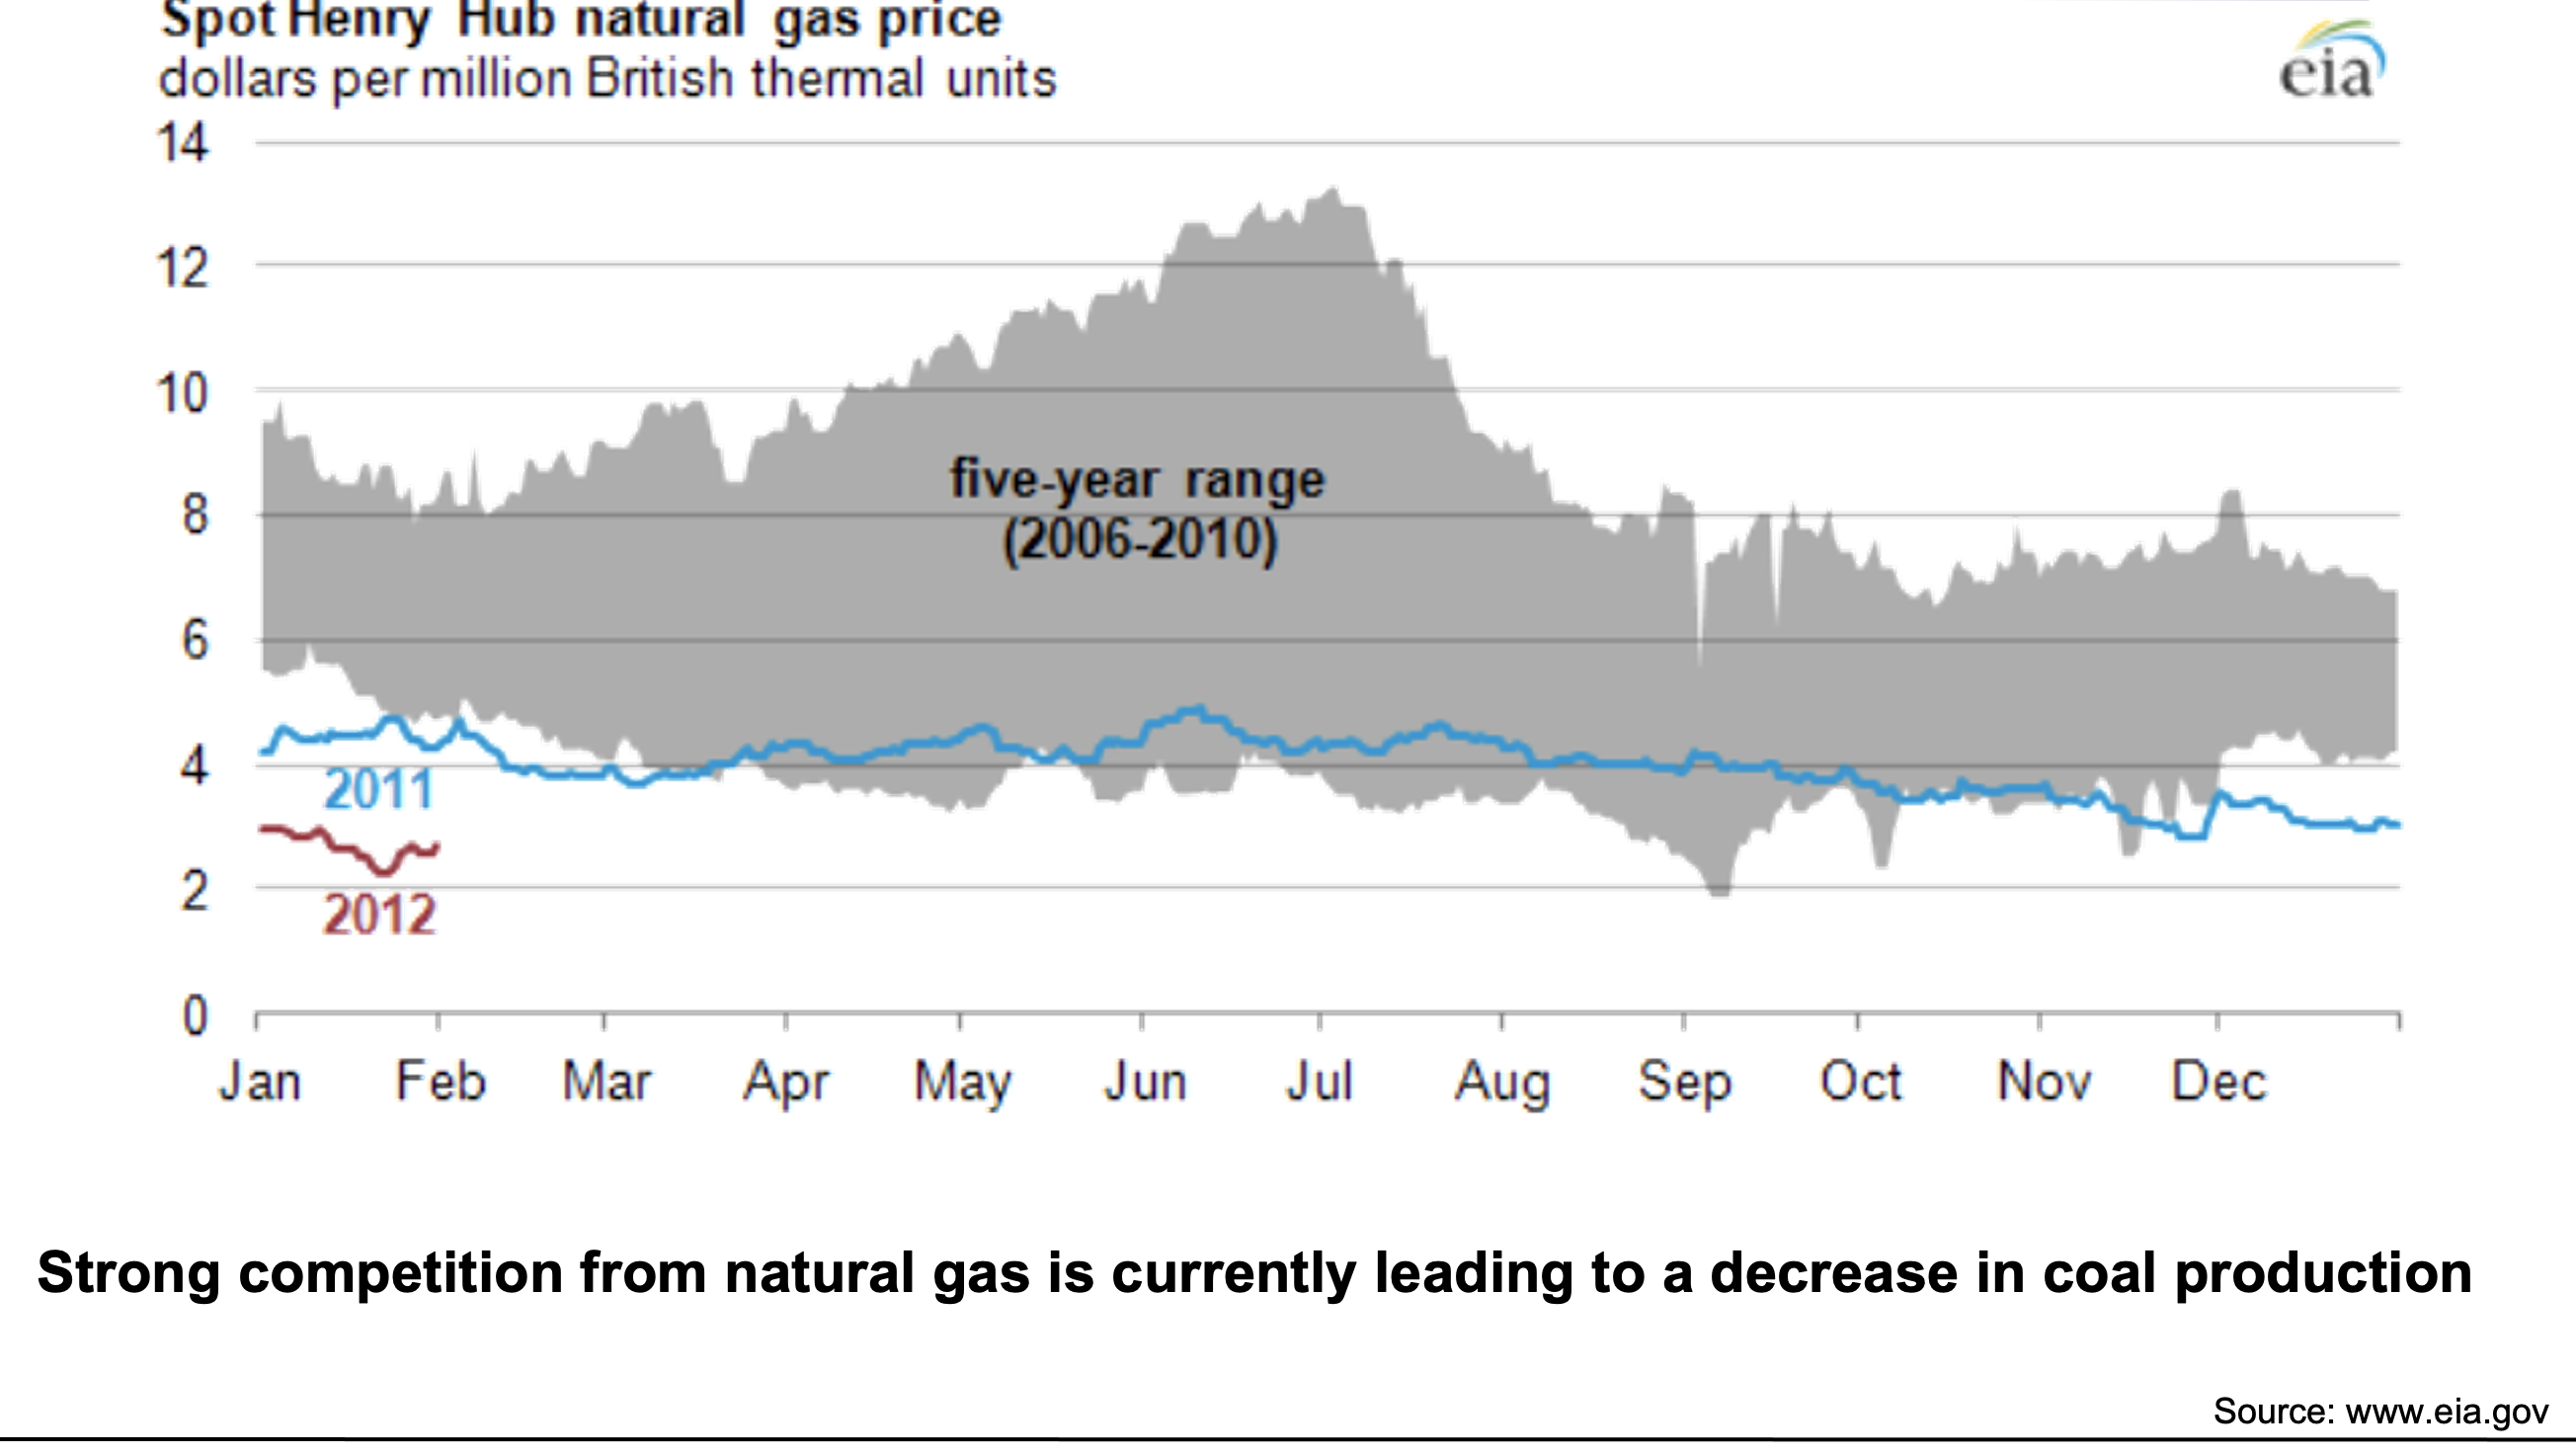
The Shale Gas Revolution Aids the War on Coal
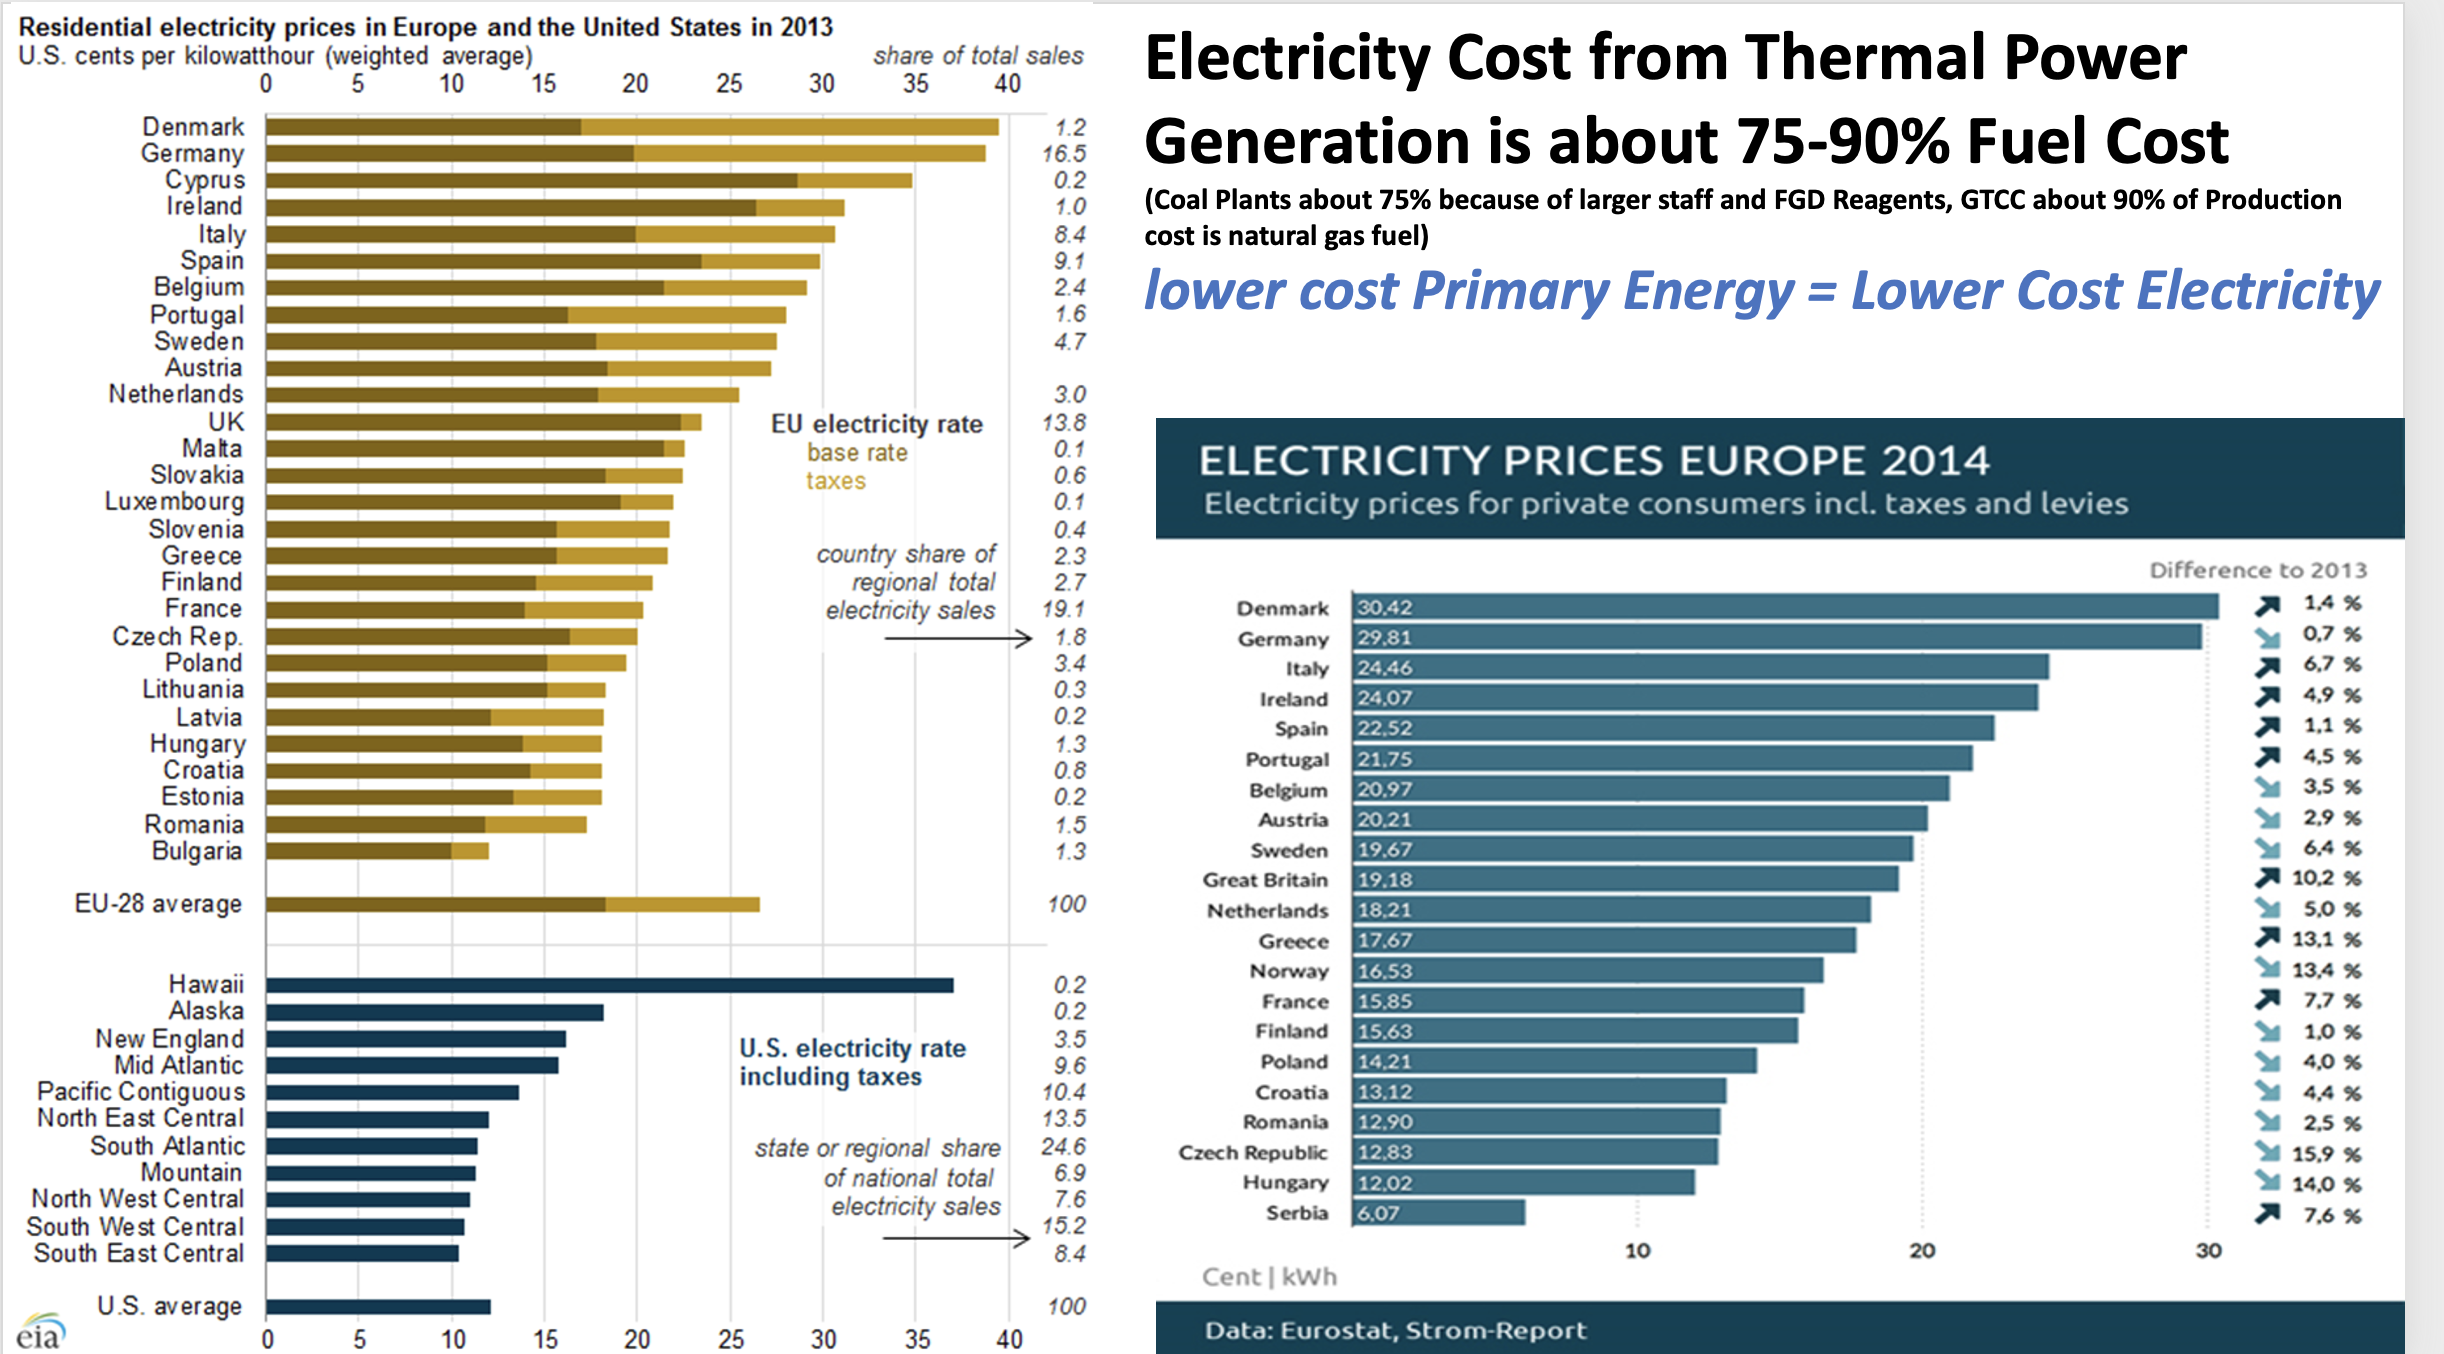
As the War on Coal progressed, the public was insulated from electricity price rises due to enormous natural gas productivity and falling natural gas prices. The graph below shows the path of natural gas prices/million BTU’s from 2006-2012. Ultimately, gas prices dropped to levels below coal prices on a $/million Btu basis. This illustration was used for a training class I was involved with in 2012 to a coal plant staff to emphasize why excellence in O & M and best Heat-Rate operations were important for competitive power generation from coal. At the time, natural gas fueled power generation had suddenly became less expensive than coal. This is because in a Thermal-Power Plant, most of the electricity generation cost is for fuel. In GTCC (Gas Turbine Combined Cycle) plants the fuel cost component is about 90% of the production cost of electricity. Thus, doubling fuel cost/million Btu’s by itself nearly doubles the production cost of electricity. Conversely, halving the fuel cost nearly halves the production cost for electricity generation.
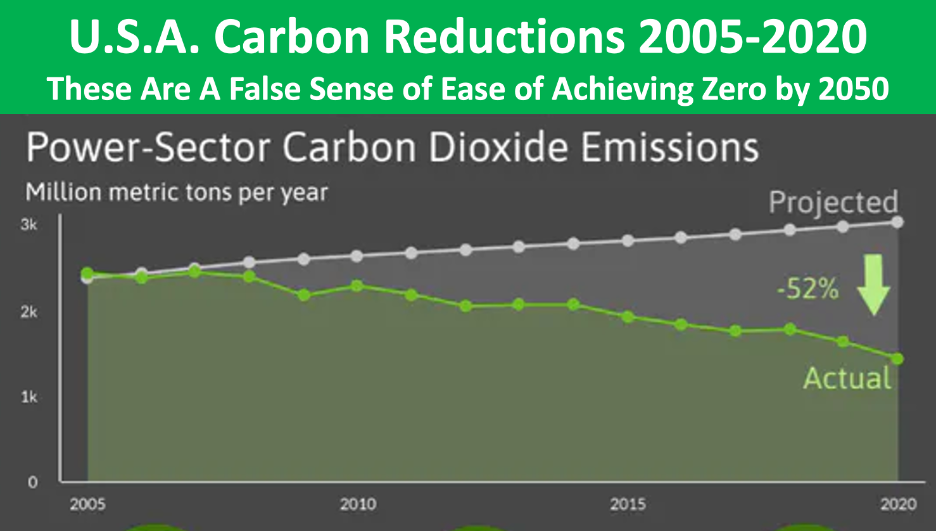
Also during this time Gas Turbine Combined Cycle Plant technology had improved to approach 65% Thermal Efficiency. The most efficient Heat-Engines in History. Thus, it appeared between 2010 and 2020 that America could wage war on carbon and enjoy economic prosperity including the lowest electricity costs in the world. We also had the largest drop in Carbon Dioxide emissions in the world. A 52% drop.
The following charts will illustrate the path from 2005 forward of reducing carbon emissions and keeping electricity prices reasonable.
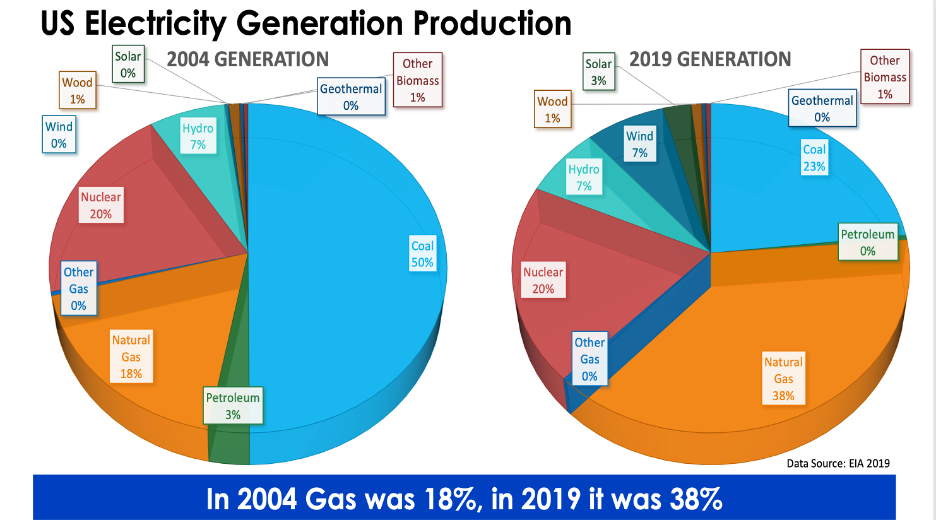
First, fuel changes from coal to natural gas created drastic CO2 emissions, because natural gas generated electricity produces about 50% of the CO2 that coal fueled plants do.
Because electricity produced by natural gas creates about half the carbon dioxide as coal generated electricity, the first 50% reduction in Greenhouse Gases was painless. Low natural gas cost (Thanks to the Shale Gas Revolution) plus high efficiency GTCC plants provided this huge first step.
The increase in natural gas power production replaced coal power production. Together, coal, gas and nuclear still provide over 80% of our electricity. The chart above is 2004-2019. The one below is the actual (Dispatchable too!) generation across the U.S.A. in September-October of 2021:
The two pie charts of generation by Fuel (below) are from the Midwest Independent System Operator (MISOEnergy.com) and the PJM Interconnection (PJM.com) for January 26, 2022. Note the importance of coal power generation. Again, coal, nuclear and natural gas are providing over 80% of our nation’s electricity generation when it is most needed. Many of the coal plants providing this power are planed to be shut down in the next few years. They will be missed. Note reference(17) below, list of coal plants to be retired in the next few years.
AMERICA ACHIEVES ENERGY INDEPENDENCE IN 2019
US Department of Energy, EIA
The U.S. Supply Chain for Manufacturing Fossil Power Systems Equipment
Besides the importance of reliable, reasonable cost electricity, there is the Supply-Chain which we should all be concerned about.
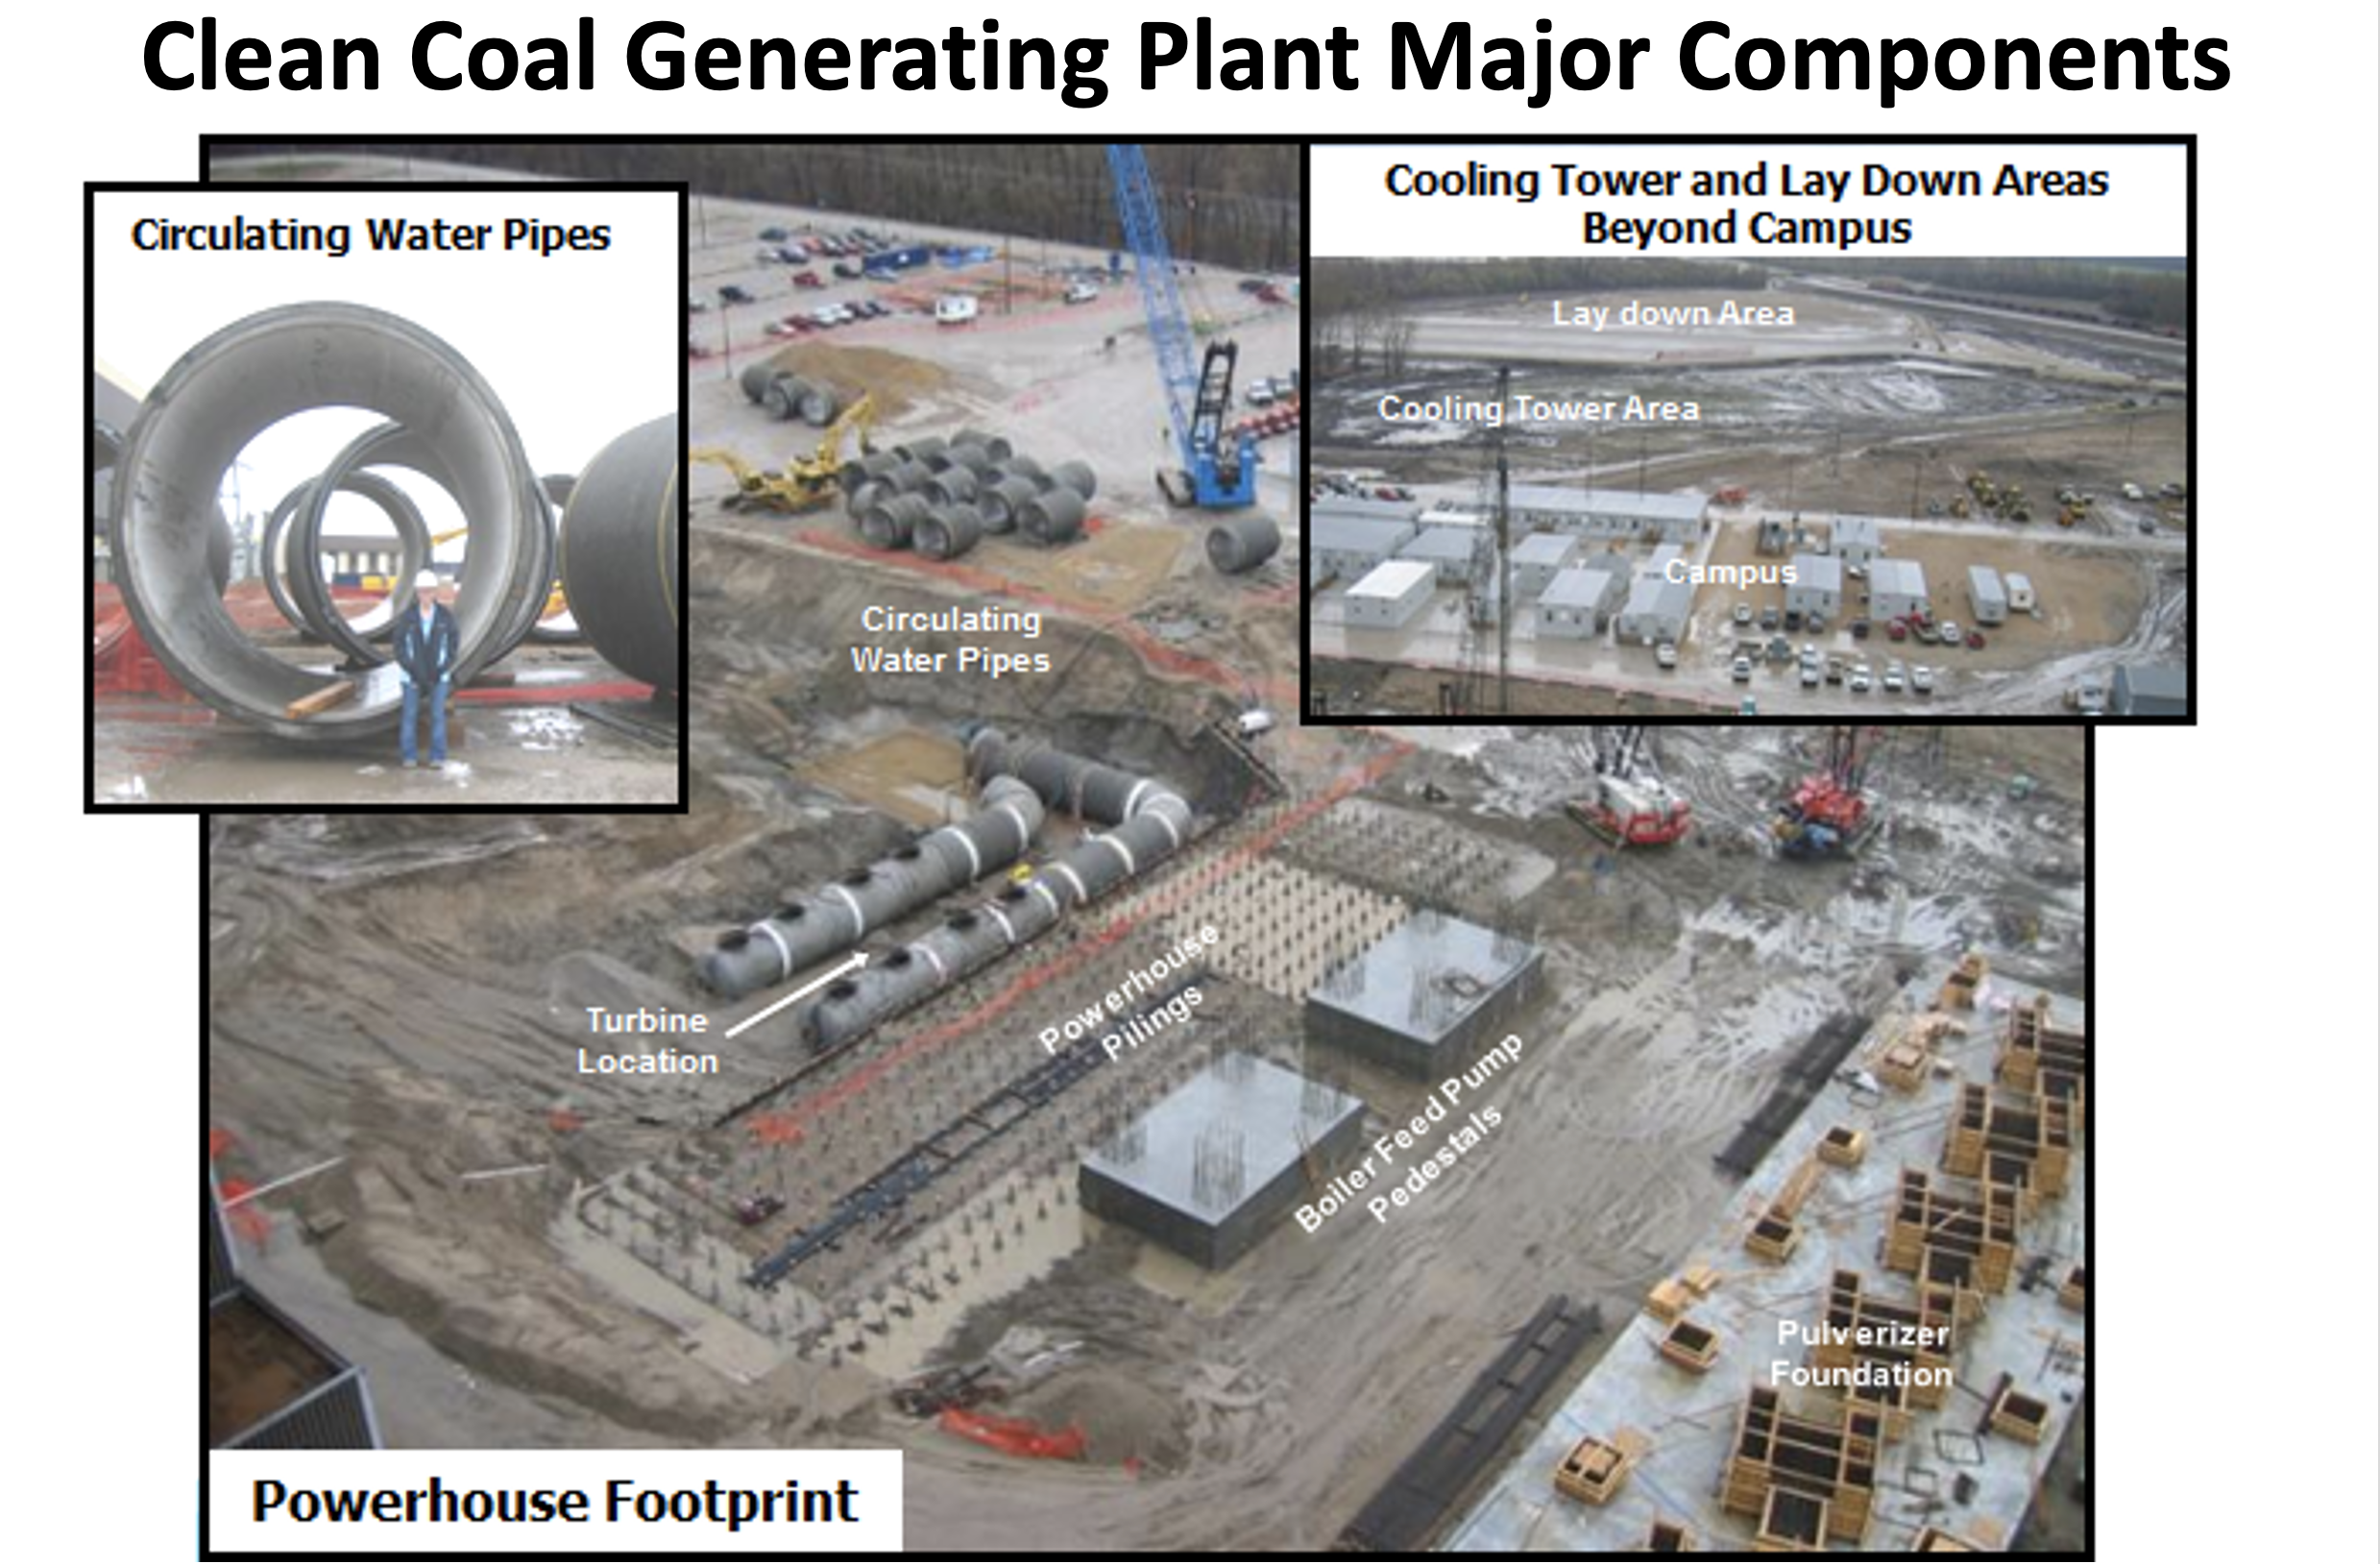
The Supply Chain of Coal Plant Components includes thousands of tons of components. Once manufactured solely in the U.S.A., these components provided hundreds of thousands of jobs. For example, when I worked for B&W in 1969, B&W employed over 35,000 employees. Combustion-Engineering also employed over 35,000 employees. General Electric and Westinghouse Electric back then employed hundreds of thousands of employees. America was the world’s #1 manufacturer and this served our country very well. Take a look at the illustrations below of major coal plant components during construction.
A large clean coal plant involves tens of thousands of tons of steel manufacturing, seamless high alloy tubing, high pressure piping, hundreds of miles of copper wire, transformers, steam turbines, large pressure vessel manufacturing, pumps, heat exchangers, motors, generators and many other components. Manufacturing of these components involves hundreds of thousands of jobs for skilled engineers, technicians and craftsmen. The Supply-Chain is very large and spreads all across the U.S.A. Here below is a list of the suppliers to the Turk Plant. This is from the POWER Magazine article.
We stopped building large coal plants about 2014. With that comes a withering and loss of our productive manufacturing capacity. Recently, our Supply-Chain woes have been in the news. My friends ask me, How could we invent computer chips and then lose the capability to produce them here in the U.S.? How about steel tubing, steel shapes, aluminum, Rare Earth minerals and EV components? Pharmaceuticals? Where do most of these come from now? Most, come from China. China is the World’s largest manufacturer, so it seems reasonable to accept the published data that shows China using more energy than any other country.
China Energy Consumption, compared to the Rest of the World
From BP Statistical Review
Meanwhile, China is Getting a Lot of Practice in Building Large Coal Power Plants, All of the Equipment Involved and Many Other Products…..
Pakistan Power Plant, Financed and Built by ChinaFrom LinkedIn Post by Mike Caravaggio
Boston University has a web site that tracks China Coal Plants:
Closing Summary
In my life-time I saw America as the top Industrialized Country of the world. We shared our wealth and technologies with other countries in good faith. Then for whatever reasons, the people of great influence, mostly from the American Democrat Party, sought to weaken our productive capacity and to cede that capacity to the Chinese Communist Party. The Mainstream News, Entertainment and most Democrats have all been part of this transfer of productive capacity and with that productive capacity comes influence in the world.
It is my hope that sometime soon, our President and Congress will wake up and see the importance of energy to power our economy. The U.S. Senate Report, “Europe’s Energy Crisis, A Warning to America” should be read by all elected officials.(15) The other references below are also informative.
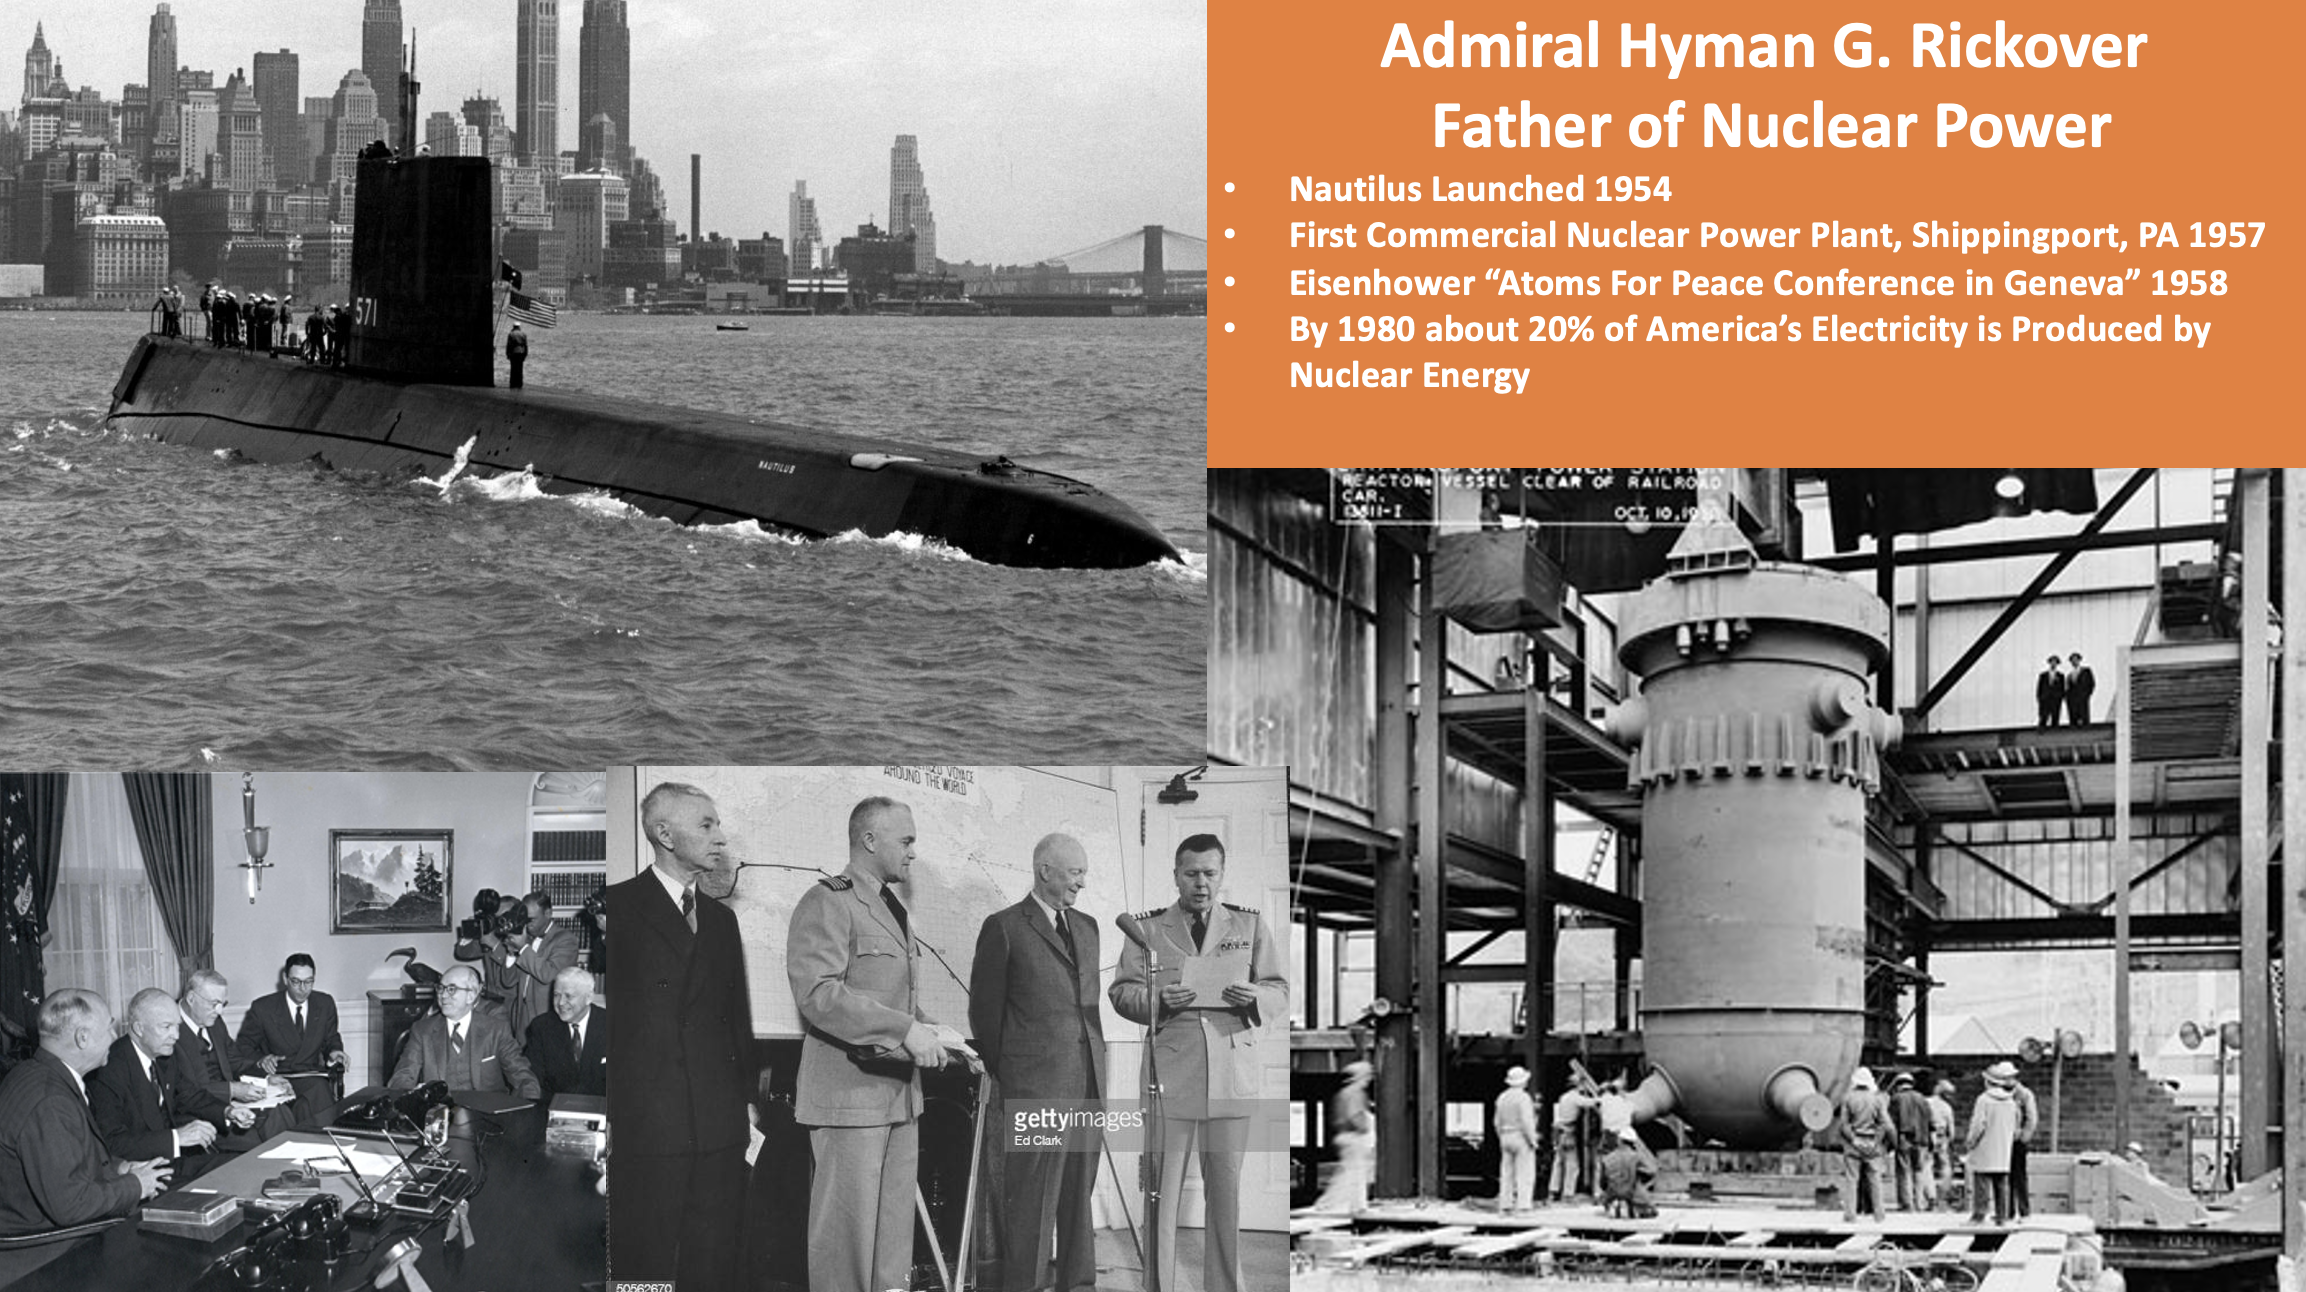
The purpose of this post is to show the progress of creating America’s huge Grid, made up of Dispatchable Power from coal, nuclear, gas and oil fuels from 1955 through 2010. Also during this time, the EPA came to be and began regulating true pollutants from power generation facilities. America’s designers, engineers and manufacturers of electric generating equipment rose to meet the challenge and provided energy to expand the American economy while at the same time cleaned our air. Nuclear Power grew to be about 20% of our total electricity generation during this 55 years. These years were special for me, because they include my becoming interested in power generation in 1959 as a Freshman at Williamson and then joining the B&W Nuclear and Special Projects Group in the 1960’s when nuclear was believed to be the future of electricity generation.
The First Pressurized Water Reactor, Nuclear Steam System
It was 1954 and the Nautilus, the first Nuclear submarine ever built was launched. The pressurized water nuclear steam system was a prototype for future Navy as well as commercial applications.
USS Nautilus, First Nuclear Powered Submarine, Launched January 1954From Babcock & Wilcox, “Steam, It’s Generation and Use” 41st Edition
“President Dwight D. Eisenhower was determined to solve “the fearful atomic dilemma” by finding some way by which “the miraculous inventiveness of man” would not be dedicated to his death, but consecrated to his life. In his “Atoms for Peace” speech before the United Nations General Assembly on December 8, 1953, President Eisenhower sought to solve this terrible problem by suggesting a means to transform the atom from a scourge into a benefit for mankind. Although not as well-known as his warning about the “military industrial complex,” voiced later in his farewell radio and television address to the American people, President Eisenhower’s Atoms for Peace speech embodied his most important nuclear initiative as President”. (2)
The Research and Development into peaceful use of atomic energy continued on “Atoms for Peace”. The partnership of the U.S. Atomic Energy Commission and the brilliant minds of employees from the American companies; Westinghouse Electric, General-Electric, Babcock & Wilcox, Combustion Engineering, Allis-Chalmers and other fine U.S. companies brought enormous advancements. In just a few years there was great progress in atomic physics, nuclear safety, ASME Codes for Pressure Vessel Design, Welding, Non-Destructive testing of welded joints and material science. The future of nuclear power looked extremely bright.
So did efficient coal power generation. I love this advertisement (below) for B&W, then a Fortune 500 company (#134 in 1960) and builder of many of the U.S. Navy’s Boilers that helped win two world wars. B&W also built the pressure vessels for the reactors and steam generators used in the Nautilus and many of the commercial nuclear steam systems to follow. Including Duke Energy’s highly successful three Unit Oconee Station which the first unit began commercial operation in 1973.
Nuclear Steam Systems were a logical extension for B&W and Combustion Engineering Company to move into after many decades of building Fossil Steam Systems. I have referred to the importance of Heat-Engines often during my career. Perhaps that is from recollections of working for B&W in the 1960’s. Below is a copy of a B&W ad from 1954:
Copy of advertisement in Fortune Magazine about 1954
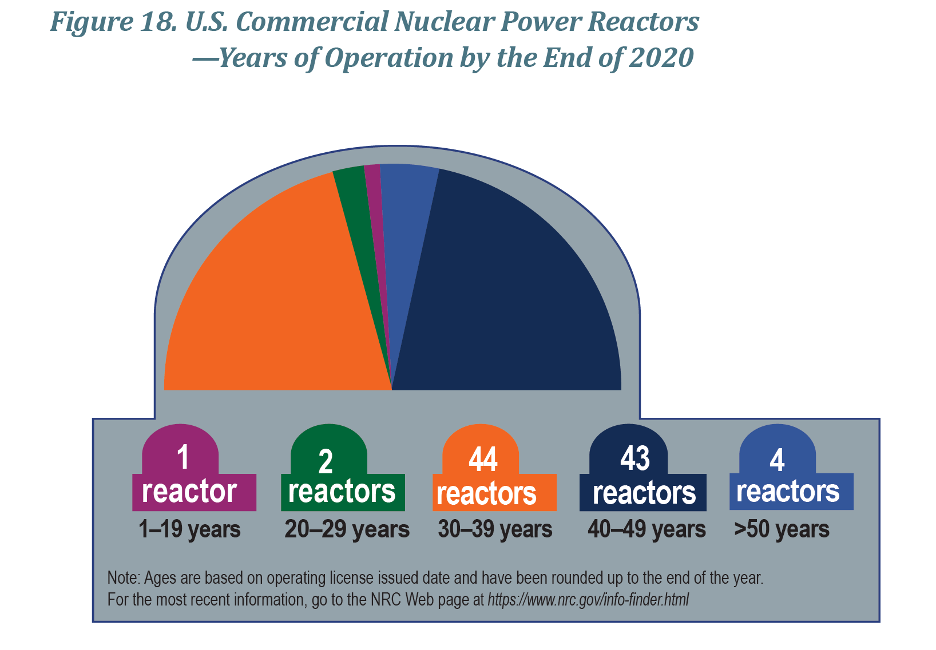
In 1954 and the chairman of the Atomic Energy Commission Lewis Strauss in his extreme enthusiasm for commercial nuclear power generation, coined the phrase….”Too Cheap to Meter”…..That was in 1954 and of course there was a building boom of nuclear power plants from 1960 to 1990. Over 100 nuclear steam systems were put into operation between 1970 and 1990. Here are the 93 that are still operating:
From Nuclear Regulatory Commission (NRC) website January 2022
Yes, Nuclear Power has been a very good invention for America. Although thousands of employees made nuclear steam systems possible, the primary credit for this gift to Humankind should go to one man, Admiral Hyman G. Rickover, Father of the U.S. Navy Nuclear Fleet and Father of Commercial Nuclear Steam Systems.(8)
The combination of new nuclear units plus ever more efficient and clean coal plants created electric growth with electricity costs amongst the lowest in the world.
This was good for world manufacturing competitiveness (especially good for energy intensive industries such as aluminum and steel manufacture) also good for reasonable household electric costs to power ever increasing labor saving household appliances.
Speaking of reasonable household electric costs and high quality of living. These ads for “Living Better Electrically” were common in the 1950’s to 70’s.
From Dick Storm, ASME Annual Meeting Presentation 2011, “Why Coal is Important
My state of South Carolina continues to enjoy reassonable cost, abundant and reliable power from Admiral Rickover’s invention. According to the EIA and NEI, over 55% of SC electricity is generated from nuclear power. I might add, these are “old nuclear plants” that have been well maintained, well run, proven and reliable. Several of these were started up in the 1970’s like Turkey Point and may have their licenses extended for 80 years. Amazingly robust and well built.
Top States for nuclear power generation in 2020 by NEI and EIA, Slide used in Dick Storm USCB-OLLI Course, 2021
The chart below is from the NRC website. As mentioned above, many of the very reliable and I might add, Dispatchable power generating nuclear power plants are aging and before they are shut down, it would be wise to plan, design and begin construction on the next generation of nuclear plants. Renewables such as wind and solar are not Dispatchable and electric battery storage is not yet feasible. These issues will be discussed in a future post. Suffice it to say for the time period 1950-1990 America had four very good decades of power generation advancements which resulted in an extremely reliable Grid providing some of the lowest cost electricity in the world.
From NRC Website
Energy, Economic Prosperity and Living with a High Human Development Index
The 1970’s and 1980’s saw clean coal and nuclear power together, provided about 70% of our electricity. America’s GDP pretty much followed the production and consumption of coal fuel. Coal and nuclear at the time were the most reasonable cost fuels to generate electricity.
From Dick Storm Presentation to ASME Annual Meeting 2011,, “Why Coal is Important”, Dallas, TX
The U.S.A. has used about 100 Quadrillion Btu’s annually for many years. Below is a copy of the EIA Total Energy Use by Fuels from 2008. This is getting ahead of 1990 but for reference, the Total Energy Use of America has held very close to 100 Quadrillion Btu’s per year for many years. The chart below shows consumption of 94.58 Quadrillion Btu’s in 2008. This reduction in energy demand was the result of the Financial crisis of 2008.
As we move forward keep this in mind. From 1950-1990 the fuel mix was changing. Thsese changes had to do with cost of fuel, pollution and availability. But for the last two decades America has used a total of about 100 Quadrillion Btu’s +/- 10 per year. This includes electricity, transportation, Industrial production, heating, and cooling. The chart reads from left to right with the fuel sources on the left and energy flows to the right.
From Dick Storm ASME Presentation, 2011, Why Coal is Important
The 1970’s Were Good Years of Progress…. But Not Perfect
The EPA (Environmental Protection Agency) began in 1970 under the Nixon Administration. Amongst the first pollutants to be regulated, was sulphur and particulate emissions. The trend of the six major pollutants has been downward every since 1970.
The six major pollutants that were significantly reduced during this time period are: Particulates, Sulfur, Carbon Monoxide, Lead, Ground level Ozone & Oxides of Nitrogen.
The first steps the EPA took to regulate a path for cleaner air was to regulate particulates and sulfur. Some electric Utilities immediately (1970-71) switched from coal fuel firing in their boilers to oil fuel. This was when the fuel cost/million Btu’s of oil and coal were about the same, in 1972 that was about $0.50/million Btu. By switching to oil the switchover downtime was reduced and huge Capital cost of Electrostatic Precipitators avoided. I was working at Carolina Power and Light at that time and remember these times well.
The Neighboring Utility in Virginia, then (1973) VEPCO had switched much of it’s generation to oil fuel, so did Potomac Electric (PEPCO) and Philadelphia Electric and others to the north. They were dependent on the (at that time) reasonable cost, easier to control emissions oil fuel. Well, that was fine until the first Arab Oil Embargo in October 1973.
Arab Oil Embargo, 1973
I was a senior engineer working at Carolina Power and Light Compay’s Roxboro Generating Station. My job was a startup and test engineer for the coal fueled 720 MW, Unit #3 which began commercial operation during the summer. Many mechanical problems were needing to be sorted out and I had job security for the next several years.
The Arab Oil Embargo lasted about a year, 1973-74 and during this time, many Utilities purchased new coal generation capacity. Especially in the southern states where air-conditioning load in the summer and heat-pump load of the winter was growing rapidly. I remember year over year growth in the range of 10% increase in electric demand. Of course, manufacturing was strong back then too.
As time went on in the 1970’s more coal plants and more nuclear plants were started up. The future of clean, reliable Nuclear power looked great until……
Three Mile Island, 1979
The future of nuclear power had a serious setback in March 1979. Although no one was injured, this was pretty much the end of new nuclear steam system orders for U.S. Utilities. It took more than another decade to complete the 100 + nuclear steam systems that were on order. More strict Regulations by the NRC and more built in safety requirements ensured that nuclear power would not be “Too Cheap to Meter” in the U.S.A.
New Clean Coal Plants are Built
To meet the increasing Electricity Demand, and do so with Domestically sourced fuel, more large coal plants were built in the 1980’s. These however were nearly all equipped with Flue Gas Desulfurization and Particulate controls. Later in 1991 the EPA Clean Air Amendment was made into law and Oxides of Nitrogen were significantly reduced and more FGD equipment began being retrofitted on existing large coal plants that did not have FGD. Thus, the ever cleaner air as shown in the foregoing chart. Yes, the EPA was needed in 1970 and the Clean Air Ammendment of 1991 also has turned out to be beneficial.
EIA DATA, 2009 The Projection did not expect the Shale Gas Revolution
How The Public Perception of Coal Becomes Tarnished
During the Arab Oil Embargo not only did we have gasoline shortages and gas lines. But the electric Utilities also suffered financially due to the rapid increase in oil costs and with the ramp up in oil costs, so did the price of competitive fuels such as gas and coal. During this time of financial stress, the Utilities drastically reduced Operation and Maintenance Budgets. What was cut first? Tree trimming around high voltage transmission line, painting and maintenance costs such as these. These are expected during volatile times in business and can be recovered from.
The Worst Budget Cut
The worst budget cut, in my view, was the cutting of public education of “Living Better Electrically” and “Better Things for Better Living”. Back in the 1970’s there were Utility representatives that invested time in Public Schools to teach the girls about electric appliances and how to use them. The boy students learned how electricity was generated from coal, oil, gas and hydro-electric sources. There was advertizing on the radio and TV. Remember “Reddy Kilowatt”? Reddy Kilowatt was the lightening bolt stick figure mascot for the investor owned Electric Utilities. Between Reddy Kilowatt and a small army of Home Economics teachers from the Electric Utilities, American Citizens learned the importance of electricity and how it was generated. I personally remember learning that as a teenager in the 1950’s, and I was just an average student.
Reddy Kilowatt, The Mascot of The Investor Owned Electric Utilities Circa 1970
I gave a presentation to the American Coal Council membership in 2008 on how, in my view, the public perception of coal changed. Here below is the illustration that I used to show the change from pro-active Utility education of the Public to the taking over of this effort by the Environmental Movement. Believe me, I support clean air and clean water as much as anyone. In fact, I worked much of my career exerting my best efforts to reduce particulates, reduce NOx and improve efficiency of power plants. However, the Environmental Extremists took over shaping the Public’s Perception of coal following the Arab Oil Embargo and filling the void of public education left by the exit (regarding public education) of the Electric Utilities. Not all, but most Utilities management were enthusiastic about exiting the Public Schools and Public Education just as many that ran bus services were quick to exit that business as soon as the Regulators would allow them to quit. The chart below illustrates the enormous funding of the leftist Green organizations after 1970. The green groups funding helped to indoctrinate or shape public views against coal and carbon. Now the Green Extremist organizations literally have far more money to spend on public indoctrination than the private sector manufacturers. But, that is a topic for another day.
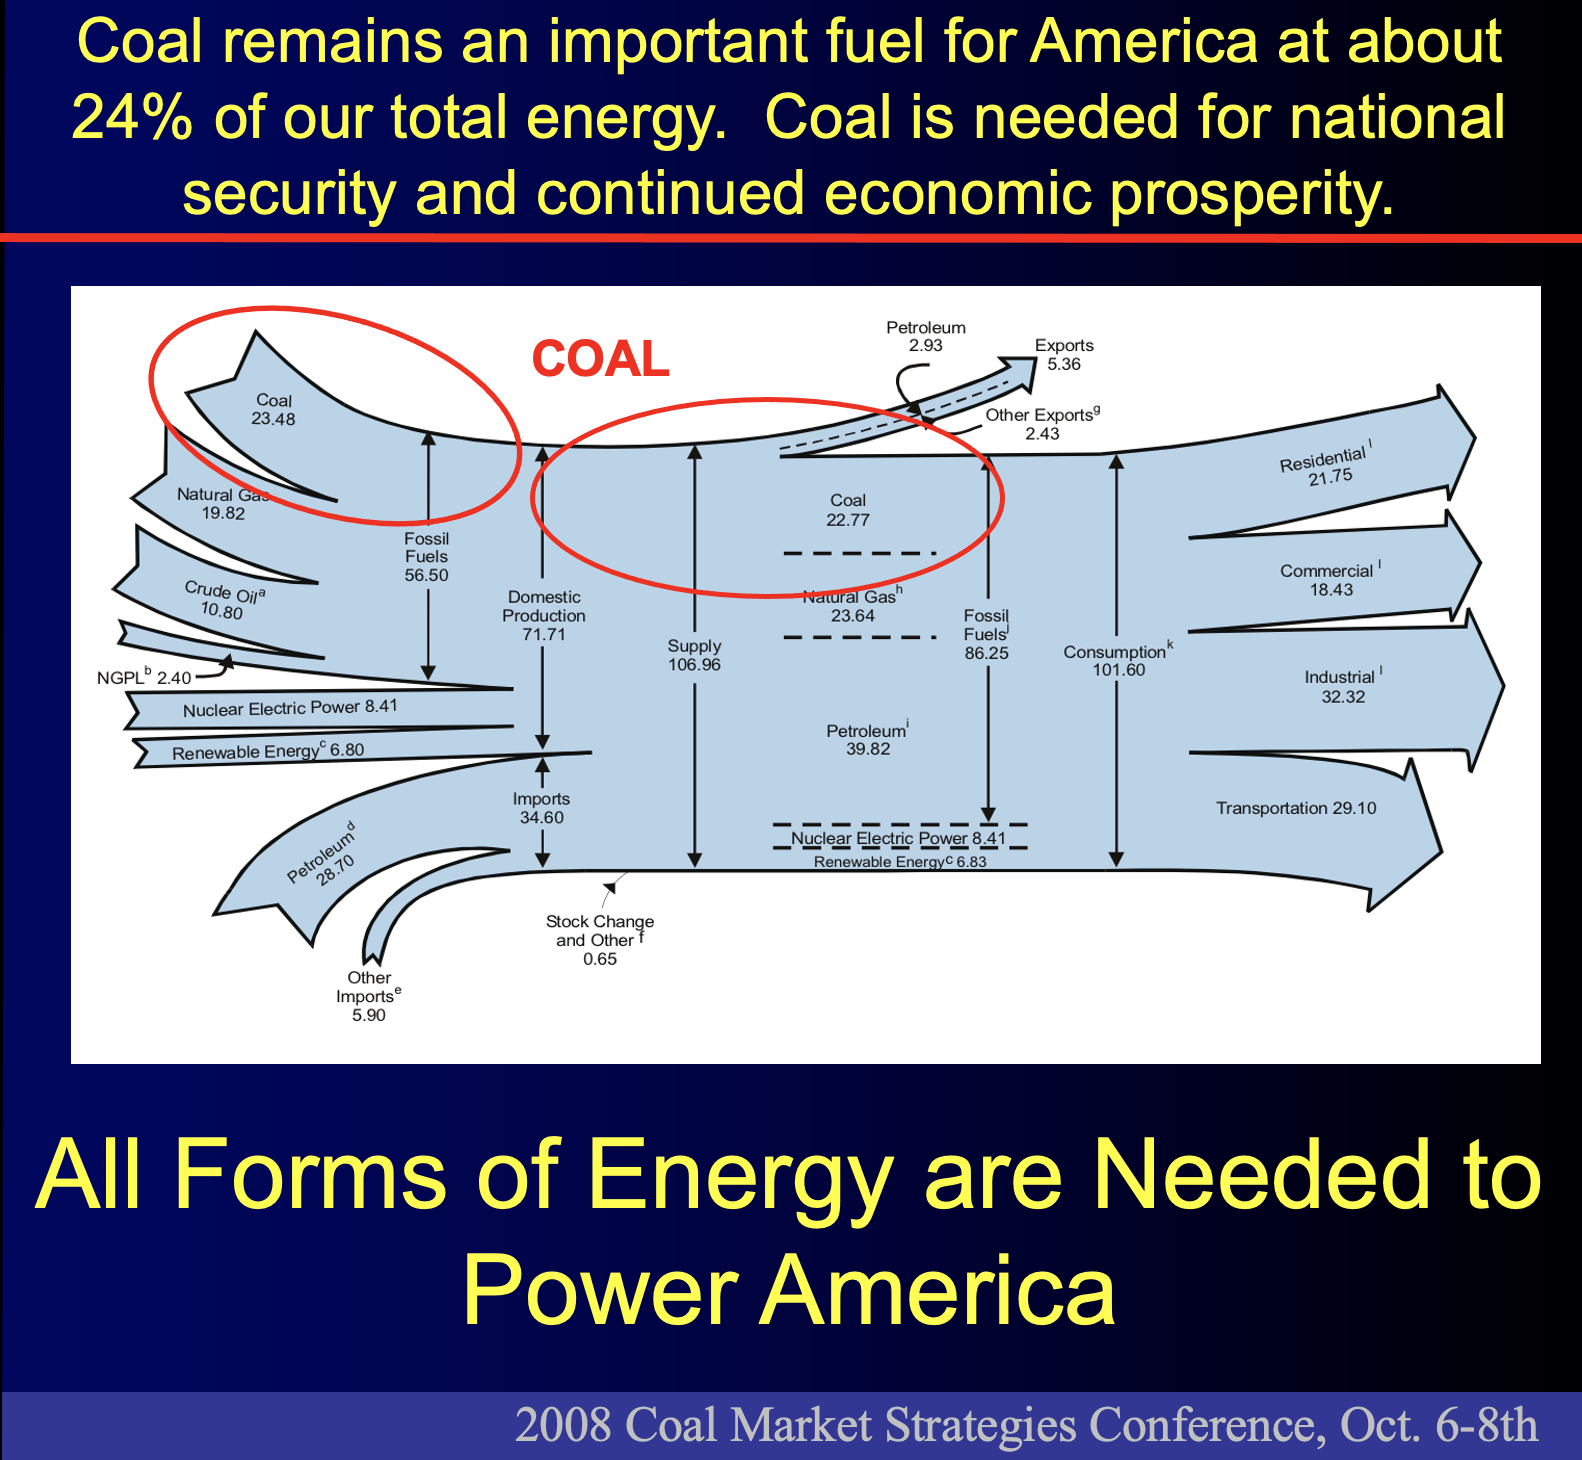
All Fuels are Important
The Total Energy Flows of the year 2007 are shown on the Sankey Diagram below. This is TOTAL Energy which includes Electricity, Industrial, Transportation, Commercial and Residential uses of energy. The changes of the percentages of each fuel change with the economics of producing the fuels. Such as discussed above when the Arab Oil Embargo of 1973-74 caused oil prices to rise sharply in 1974 and many power generation plants were switched back to coal from oil. We should keep this in mind as the government pushes us toward Electric Vehicles in the future. In my view, we will need over 100 Quadrillion Btu’s annually to support our high quality of life. So, as electricity is substituted for gasoline or Diesel fuel, more electricity generation will be required which more than likely will come from conventional sources of gas, nuclear, coal & hydro-electric. The chart below is 2007. In part 3 I will include more recent Sankey Diagrams of Total Energy Flows.
This will conclude Part 2 of this series on the History of Energy and Electricity Generation in the U.S.A. The next section will cover 2005-2022.
Conclusions:
Projections into the future are simply, projections. We can learn from our recent energy history of nuclear being thought to be, “Too Cheap to Meter” and the end of coal just a few years away. In the 1960’s the future of coal was proclaimed Dead….. However during this current cold weather in the U.S. Coal Power is depended on for a large percentage of electricity generation. Just check pjm.com
Likewise, the EIA projection published in 2009 showing an increase in coal going forward did not take into account the Shale Gas Revolution made possible by Directional Drilling and Hydraulic Fracturing. The coal consumption dropped off primarily due to the reduction in cost of the newly abundant Domestic natural gas that became available about 2012. Low natural gas prices were helpful for those opponents of coal fuel.
Reasonable cost energy is required to fuel a thriving Economy. Note the drop in energy use after the 2008 Financial Crisis.
Industrial output is particularly linked to reasonable cost, abundant and reliable energy. Especially primary metals like steel and aluminum.
Net Zero Carbon is a disasterous Policy for the U.S. to follow unless a large number of new generation nuclear plants are deployed in the U.S. generation fleet.
Nuclear, Coal, Gas, Oil, Thermal Biomass and Hydro-Electric are the only Dispatchable sources of electricity generation by today’s technology
Reliable, Abundant, Reasonable cost and Dispatchable electric generation is required for a country to remain or to become competitive in the world with a manufacturing based economy. China has proved this over the last 20 years since joining the WTO
America has burned coal and natural gas more responsibly and cleaner than any other country that uses Fossil Fuels for Bulk Power production in Gigawatt quantities
The Net Zero Carbon Policy is a Disasterous path for our country to follow. We should learn from historical events of the past.
My friend a Tinkerer reminded me of the old phrase, “When Tinkering, it is important to save all of the pieces” This old saying should be remembered by the politicians that are “Tinkering with America’s Energy Policy” and allowing reliable and needed coal plants to be shut down and demolished. This has even occurred with reliable nuclear plants. We should be preserving the power generation infra-structure that powers America’s economy and our life styles.
Dick Storm, January 19, 2022
Author’s note on the background and why I write on this Blog:
I said at the beginning this was a special time for me. Well, it was because my life-time career in power generation began in 1962 after graduation from Williamson. I joined Babcock & Wilcox’s Nuclear and Special Products Division in 1965 and worked as an assistant to the Project Manager for Navy PWR’s and on the Oconee Nuclear Steam System. I did not like the rigorous administrative paperwork required by the AEC at the time and many engineers were transferring into the Nuclear Division from the Fossil Power Generation Division, leaving many vacancies in PGD. So, I arranged a transfer to Results Engineering to work for one of the best Mentors ever, Silas Morse. The “Too Cheap to Meter” phrase regarding nuclear power was well known within the walls of B&W and as a 22 year old newby, I was strongly advised that coal plants will be shut down in a decade because nuclear is so clean, has such an extreme energy density and it is highly productive. I went anyway, vowing to study and learn all I could about coal power so that I could remain employed for my future career. It worked.
My stint at B&W provided travel to large Paper Mills from New England to Missoula, Montana, to run acceptance tests on the largest (then the largest steam plants were about 500 MW) coal and gas plants at Baltimore Gas & Electric, Houston Light & Power, Illinois Power, Ohio Edison and more.
Always wanting to be a startup engineer, in 1969 I left B&W to join Riley Stoker as a senior startup engineer at Tampa Electric’s Unit #6 at Gannon Station. Then off to participate in the startup of Riley’s first and only coal-fueled supercritical units at Wateree Station for SCE&G near Columbia, SC. In between, helped with acceptance testing at Santee-Cooper’s Jeferies coal plant in Monck’s Corner. Then back to Florida to startup new oil fueled units at the City of Lakeland and Jacksonville.
My big opportunity to get involved with a major Utility came in 1972 and I was assigned to be the lead Startup Engineer for the 420 MW dual fueled Sutton Unit #3. Then in January 1973 I joined Carolina Power and Light Company as a Senior Engineer in charge of the startup of the 720 MW Roxboro Unit #3. Great learning experiences including the Arab Oil Embargo and the “Wheeling” of Coal Generated Power from CP&L to Utilities in the north that had switched fuels from coal to oil and then were short on fuel with the oil embargo.
In 1977 I left my position, then as Operations Superintendent at CP&L’s Roxboro Plant, to join a newly formed small contractor, Flame Refractories, in Oakboro, NC. Flame was small, only a dozen or so total employees when I joined. The company grew and I started Flame Technical Servives. Flame grew to be a major Utility Specialty contractor with hundreds of employees. My Technical Services Department eventually grew to an average size of about 20 engineers and technicians and became well known all across the U.S.A. and Internationally. Some of the most interesting International trips began in 1978 when ALCOA hired us to correct some boiler problems at the Suriname Aluminum Company in Suriname, South America. Then later to Guinee in Africa, Jamaica, Spain and Australia.
In 1992 after 15 very interesting and growing years at Flame, I started Storm Engineering later to be folded into Storm Technologies, Inc. We continued solving large electric Utility Boiler problems for the next twenty years that I was President of Storm Technologies. Storm Technologies earned a good reputation for solving difficult coal plant problems and we traveled all around the world to work at plants in South America, Asia, Oceana, Africa, India, the Philippines, Indonesia and of course, all across the U.S.A. and Canada. During these travels is when the relationship of Energy and Economic Prosperity became apparent to me. Where we traveled to help sort out problems in coal plants around the world, there was and remains, a higher quality of life. The UN calls it “Human Development Index”. I saw the affects of reasonable cost, reliable energy on the improving quality of life in Developing countries.
I retired from active involvement at Storm Technologies in 2012 when my son Danny became President.
Since then, I have done my best to give back by teaching the importance of power generation and wise use of resources for power generation. I was on the Williamson College of the Trades Board until 2019 where I championed the modernization and upgrades to the Energy Island used for power generation and instructional purposes at the College. Also, have volunteered to teach courses on Energy and Electricity Generation at schools and Colleges. The genisis of this post and others on my Blog are from slides used at the USCB-OLLI courses I have presented here on Hilton Head Island.
One of the biggest problems our country has is a misunderstanding of energy and electricity generation. The current path to Net Zero Carbon is a very hamful path for America because Renewables are not capable of replacing the large, reliable and proven coal, gas and nuclear plants that power our country. Therefore, I continue to do my best to Educate the public on the true facts regarding energy and electricity generation.
Thank you for taking time to read this. Your comments are welcomed.
This is an excellent review of the relationship of energy and prosperity. Especially in Africa where reasonable cost coal plants could lift millions from poverty.
This is a fourth post toward infographics exposing the damaging effects of Climate Policies upon the lives of ordinary people. (See World of Hurt Part 1 , Part 2, and Part 3 ) And all of the pain is for naught in fighting against global warming/climate change, as shown clearly in the image above. This post presents graphics to illustrate the fourth of four themes:
Zero Carbon Means Killing Real Jobs with Promises of Green Jobs
Reducing Carbon Emissions Means High Cost Energy Imports and Social Degradation
100% Renewable Energy Means Sourcing Rare Metals Off-Planet
Leave it in the Ground Means Perpetual Poverty
The War Against Carbon Emissions Diminishes Efforts to Lift People Out of Poverty
The OurWorldinData graph shows how half a billion people have risen out of extreme poverty in recent decades. While much needs to be done, it is clear that the world knows the poverty…
Coal has been important to lift people from poverty to good lives for about 150 years. The Developed world made great progress from 1900 to present day thanks to reasonable cost coal power. The Electric Utilities once educated the public on power generation and “Living Better Electrically” Any of us born before 1950 can remember the Edison Electric Institute Mascot, “REDDY KILOWATT”. What a wonderful benefit that was for Humankind. As a high school student I actually knew where electric power came from and the basics of Thermal Power Plants.
Then ironically, about the time of the 1973-74 Arab Oil Embargo, I was working for Carolina Power and Light Company. A responsible and efficient Electric Utility headquartered in Raleigh, NC. I remember as a fact, CP&L cut the Public Relations Budget which included killing programs in schools to teach Home Economic Students the benefits of “Living Better Electrically”. Also, TV and Newspaper articles to explain the importance of electricity. So, what filled the void? The Environemntal Extremists filled the void. Then in the 1990’s Bill Clinton’s Presidency began the “War on Coal”. Later the war on coal morphed into the war on carbon.
Thank you Ron Clutz for writing your article. I will post a couple pictures of life without Fossil Fuels. As John Kerry flies around the world professing to save the Planet, I suppose this is what he and the Biden Administration wish for us to do, return to muscle power. This is preposterous considering we are well into the Digital and Space Age!
Well, that is at least one reason we have such a mess of energy policy now.
Once a “War on Carbon”, Has now Morphed into a “War on Freedom”, “War on our Rights”, “War on Capitalism” and an assault on much of What “We the People” Have Worked Hard For. The clowns in Scotland are spending our tax dollars and restricting our freedoms as best they can. Essentially putting China and the rest of the world first, America last. All on our dime.
Meanwhile, U.S.A. High Gas Prices, Super Market Shortages, Inflation , Oil and Gas Jobs are Killed and Winter Energy Supplies may be limited. The American people did not vote for this
America has been a leader by example in reducing carbon. The U.S.A. has reduced our carbon emissions by over 50% since 2005. How? By releasing the power of free markets and American innovation. At the end of President Trump’s term, America was energy independent. He did that in four years only to have Joe Biden reverse his policies.
The War on Fossil Fuels is not new and the intentions have always been to raise energy costs so that “Green Power” will become competitive. Yes, the intentions of President Biden, John Kerry, Al Gore and the rest of the Green Extremists (Reminder, the War on Coal started in the Clinton-Gore Administration. Obama just continued and accellerated anti American energy policies Clinton-Gore began) The war on carbon is intended to make Exploration, Development, Production and use of oil, gas, coal and even nuclear, more expensive and harder to use. All of this as the world’s people still depend on Fossil Fuels and nuclear together for almost 90% of our total energy. How can our leaders be so ignorant and insensitive? Well, back in the 1990’s when bill Clinton started the “War on Coal”, I did my best to educate the public and the students of public schools and several Colleges on energy and electricity generation. I am proud of my efforts, small as they seem in the grand scheme of things. There is still a need for Energy Engineers to become active in PR for Energy!
I copied the Oct. 2011 Commentary(Below) from POWER Magazine’s web page. Kindly note my last line: I sure wish the readers of POWER and many other engineers took the suggestion to educate the public on energy and electricity generation more seriously. If we had, perhaps we would not have the mess we have in Washington today.
(From Oct. 2011)
Shaping America’s Energy Policy
America’s energy and environmental policies have been dysfunctional for decades. Obsessively moving toward “green” has made America weaker and has damaged our economy. During POWER’ s first 100 years (1882–1982), the magazine chronicled the U.S. growing into the strongest industrialized economy in the world. America designed and built products for the world using raw materials and energy from within our own borders. Now we are in a recession and the U.S. Environmental Protection Agency’s (EPA) “War on Coal” continues. Does anyone get the connection? Ever-worsening regulations are killing jobs by the thousands.
Past Turning Points in U.S. Energy Production
Remember when America took risks and led the world in energy innovation? Let’s review some of the past milestones.
The pace-setting power stations Eddystone and Philo are ultrasupercritical power plants that were designed in the 1950s. Hailed as the most efficient coal power plants in the world when they were launched, these plants were designed for over-40% thermal efficiency.
Then Admiral Hyman G. Rickover and President Dwight D. Eisenhower followed through on the “Atoms for Peace Initiative” to commercialize the success of the Navy nuclear propulsion systems, which were to be applied to electricity generation for peaceful purposes. The Shippingport nuclear power plant began operations in the early 1960s, and larger commercial nuclear plants were on the drawing boards. By the mid-1960s, it was said that nuclear power was such a technological breakthrough that “electricity will be too cheap to meter.” America went on to build more than 100 commercial nuclear plants, most of which are still operational. U.S. nuclear plants remain economical and have earned an enviable safety record.
Then came oil embargos, followed by volatile natural gas prices. The high oil and gas prices resulted in a surge in building new coal plants from 1975 to 1985. The nuclear fleet grew until 1978, when the Three Mile Island accident created a major setback. In recent years, nuclear power morphed into the politically correct, carbon-free fuel. However, the tsunami in Japan in March and the resurgence of anti-nuclear groups around the world seem to have once more stalled future nuclear plant development.
The Need for Energy Policies That Promote Our Economy
U.S. energy policy should promote the use of all fuels. America is the Saudi Arabia of coal. If mining permits, EPA regulations, and common sense energy policies were practiced, then power engineers could replace our aging coal plants with new clean coal plants exceeding 40% thermal efficiency. This would be an efficiency improvement of about 7 percentage points above the existing coal fleet.
It is absurd that environmental activists can shape the U.S. energy policy based on ideology alone, with little concern for keeping electricity prices reasonable and our economy growing. Why don’t environmental activists embrace new, more efficient clean coal plants? America should be replacing our aging fleet with new, more efficient, clean coal plants. Will we ever learn?
My concern is that the same type of political correctness that nearly killed nuclear power after Three Mile Island may harm the future of clean coal plants. If the U.S. rebuilt the aging 300+ GW coal fleet with all new, clean ultrasupercritical coal plants, it would employ well over three million Americans. Jobs and a strong America are related to the utilization of homegrown energy, including the mining of coal and raw materials; construction; and the production of steel, cement, copper wire, generators, boilers, balance-of-plant equipment, and environmental controls. Compare the number of jobs created to build, operate, and maintain new coal plants with the “green jobs” of erecting foreign-built windmills or solar power facilities.
If we want to restore economic prosperity and renew manufacturing in America, then we need reasonably priced electricity to supply power to manufacturing plants. Keeping electricity costs reasonable for residential consumption is nice, but to restore manufacturing jobs in America, reasonably priced wholesale electricity, which is available on a 24/7 basis, is needed. This point seems to be forgotten in the national dialog on America’s energy future.
Educating the American Public About Electric Power Production
I think each of us who understands power production has a responsibility to educate our friends, neighbors, and elected officials. There are millions of citizens who believe reasonably priced, reliable electricity is an entitlement. The right thing for human advancement is to use the God-given natural resources that have made “living better electrically” a way of life in the developed world.
In my opinion, we should build green power where it is practical and economic to do so, such as on the roofs of buildings and parking garages. I support the building of nuclear plants and combined cycle gas plants, where economically justified. Energy engineers understand that when the sun sets and the wind is calm, the U.S. needs reasonably priced, dispatchable power to energize what is left of America’s manufacturing might.
I urge the readers of POWER to do your part in educating the public and our elected officials on the true facts of how we can continue to “live better electrically” and keep America strong. I promise to do my part. Will you?”
— Richard F. “Dick” Storm (was in 2011 ) CEO/senior consultant of Storm Technologies Inc. in Albemarle, N.C.
I presented a short course to the local University, OLLI, Life-Long Learning Program. I thought it may be helpful to provide a summary of the course on this Blog so that it is available to others. Mindful that many policy makers and voters are not aware of the costs of renewable energy and the difficulties in living without carbon based fuels. This course was intended to provide insight to non-energy engineers on this important topic. Also included at the end are numerous references that are not widely discussed by the Main Stream Media, Entertainment and even in “Woke” Social Media.
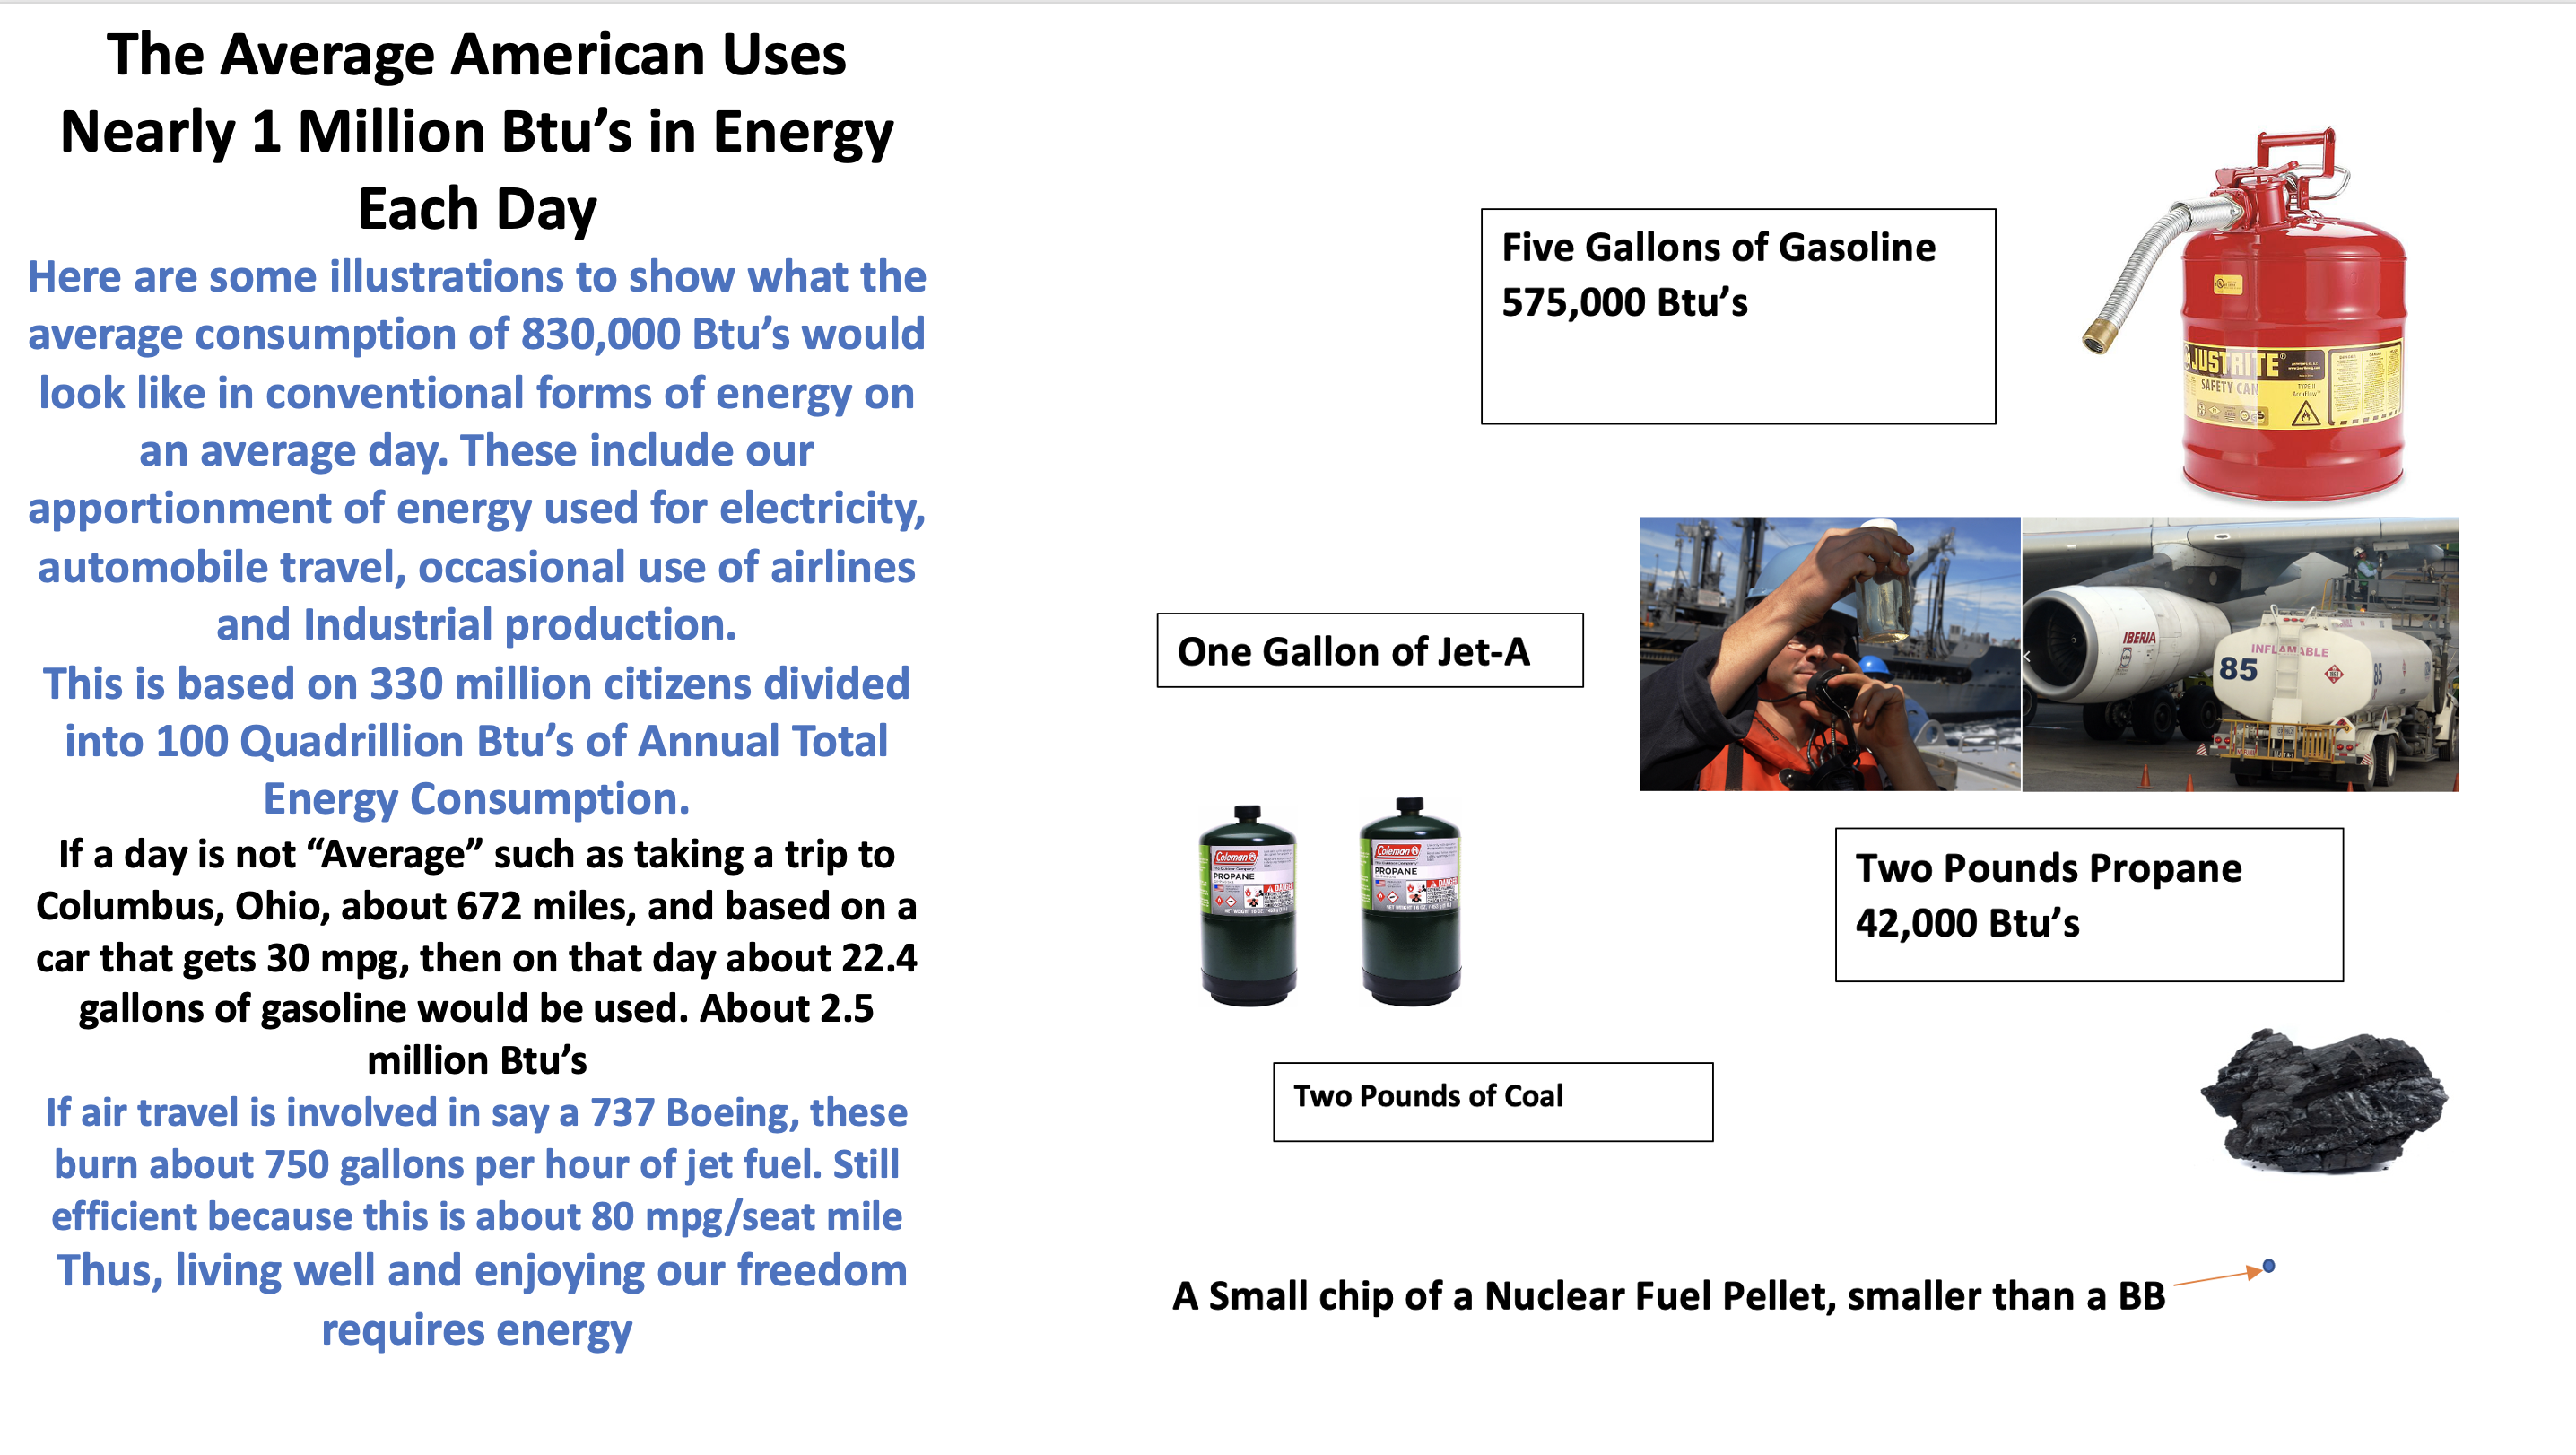
America uses about 100 Quadrillion Btu’s per year. This translates to about 830,000 to 1 Million Btu’s used each day by each American. This includes electricity, transportation, shipping, heating, industrial and commercial. Each individual citizen consumes roughly about a million British Thermal Units (BTU’s) per day, the chart below show the sources of those BTU’s and how they are used.
From U.S. Department of Energy, Lawrence Livermore Laboratory data
About 37% of America’s energy is used for electricity generation. The other 63% is also important and if everyone drove EV’s, then much more electricity demand will be required.
Each citizen uses almost a million Btu’s per day. Depending on employment type, home location in warmer or northern climate and life-styles, the amount of energy used will vary. But for me and my friends and our life-styles, I am sure we use over a million Btu’s per day. For the class, I prepared an illustration of just how an average person could use 866,000 to a million Btu’s each day.
Another illustration shows just how we depend on energy to carry on our daily living.
I have watched the use of total energy for the last twenty years or so and have seen it hover at about 100 Quadrillion Btu’s each year. This is the energy required to fuel our economy and the Freedom to travel and live our lives as Americans have enjoyed for many years. Disrupting this energy supply to fuel our economy and our life styles will create unnecessary hardship, pain and National security risks for all Americans.
The Democrats and the Biden Administration have America on a path to “Net Zero Carbon”. This is insane, foolish and simply not possible to attain. Not unless our standard of living and productive capacity as a nation are severely compromised. I refer you back to the first figure above, the Sankey Diagram that shows total Primary Energy Used in 2019. Of the 100 Quadrillion Btu’s used, only 3.8% came from wind and solar. This is after decades of tax subsidies to renewables. Only 3.8%. Now, for the “Net Zero America” path promoted by Princeton University and the Democrats, they want to change ALL of our ENERGY to Carbon Free. See the figure below:
After many years of subsidies, renewables can’t do better than 3.8% of our energy and the “Net Zero Carbon” proponents think that by throwing Billions and Billions of your tax dollars to connected, (D) Crony Capitalists, we will be able to replace Fossil Fuels and Nuclear with solar panels and wind turbines. This is simply not practical and it will harm America if it is tried. Why? Because we utilize and depend on 96.2% of our energy to come from conventional sources. Petroleum, Coal, Natural Gas and Nuclear. It is absolutely Nuts to have a “War on Carbon” when in fact, we depend on carbon based fuels for every day living. OK, I am a retired coal power engineer and some will say, I am biased toward Fossil Fuels. Imagine that. So to get past the bias, let’s take some real world examples of where large groups of citizens have been subjected to “Extreme Green” policies and take a look at the results. Certainly the politicians are smart enough to understand we should learn from the mistakes of others. You think? Four examples I will offer are:
Wind Power in the UK and resulting extreme costs
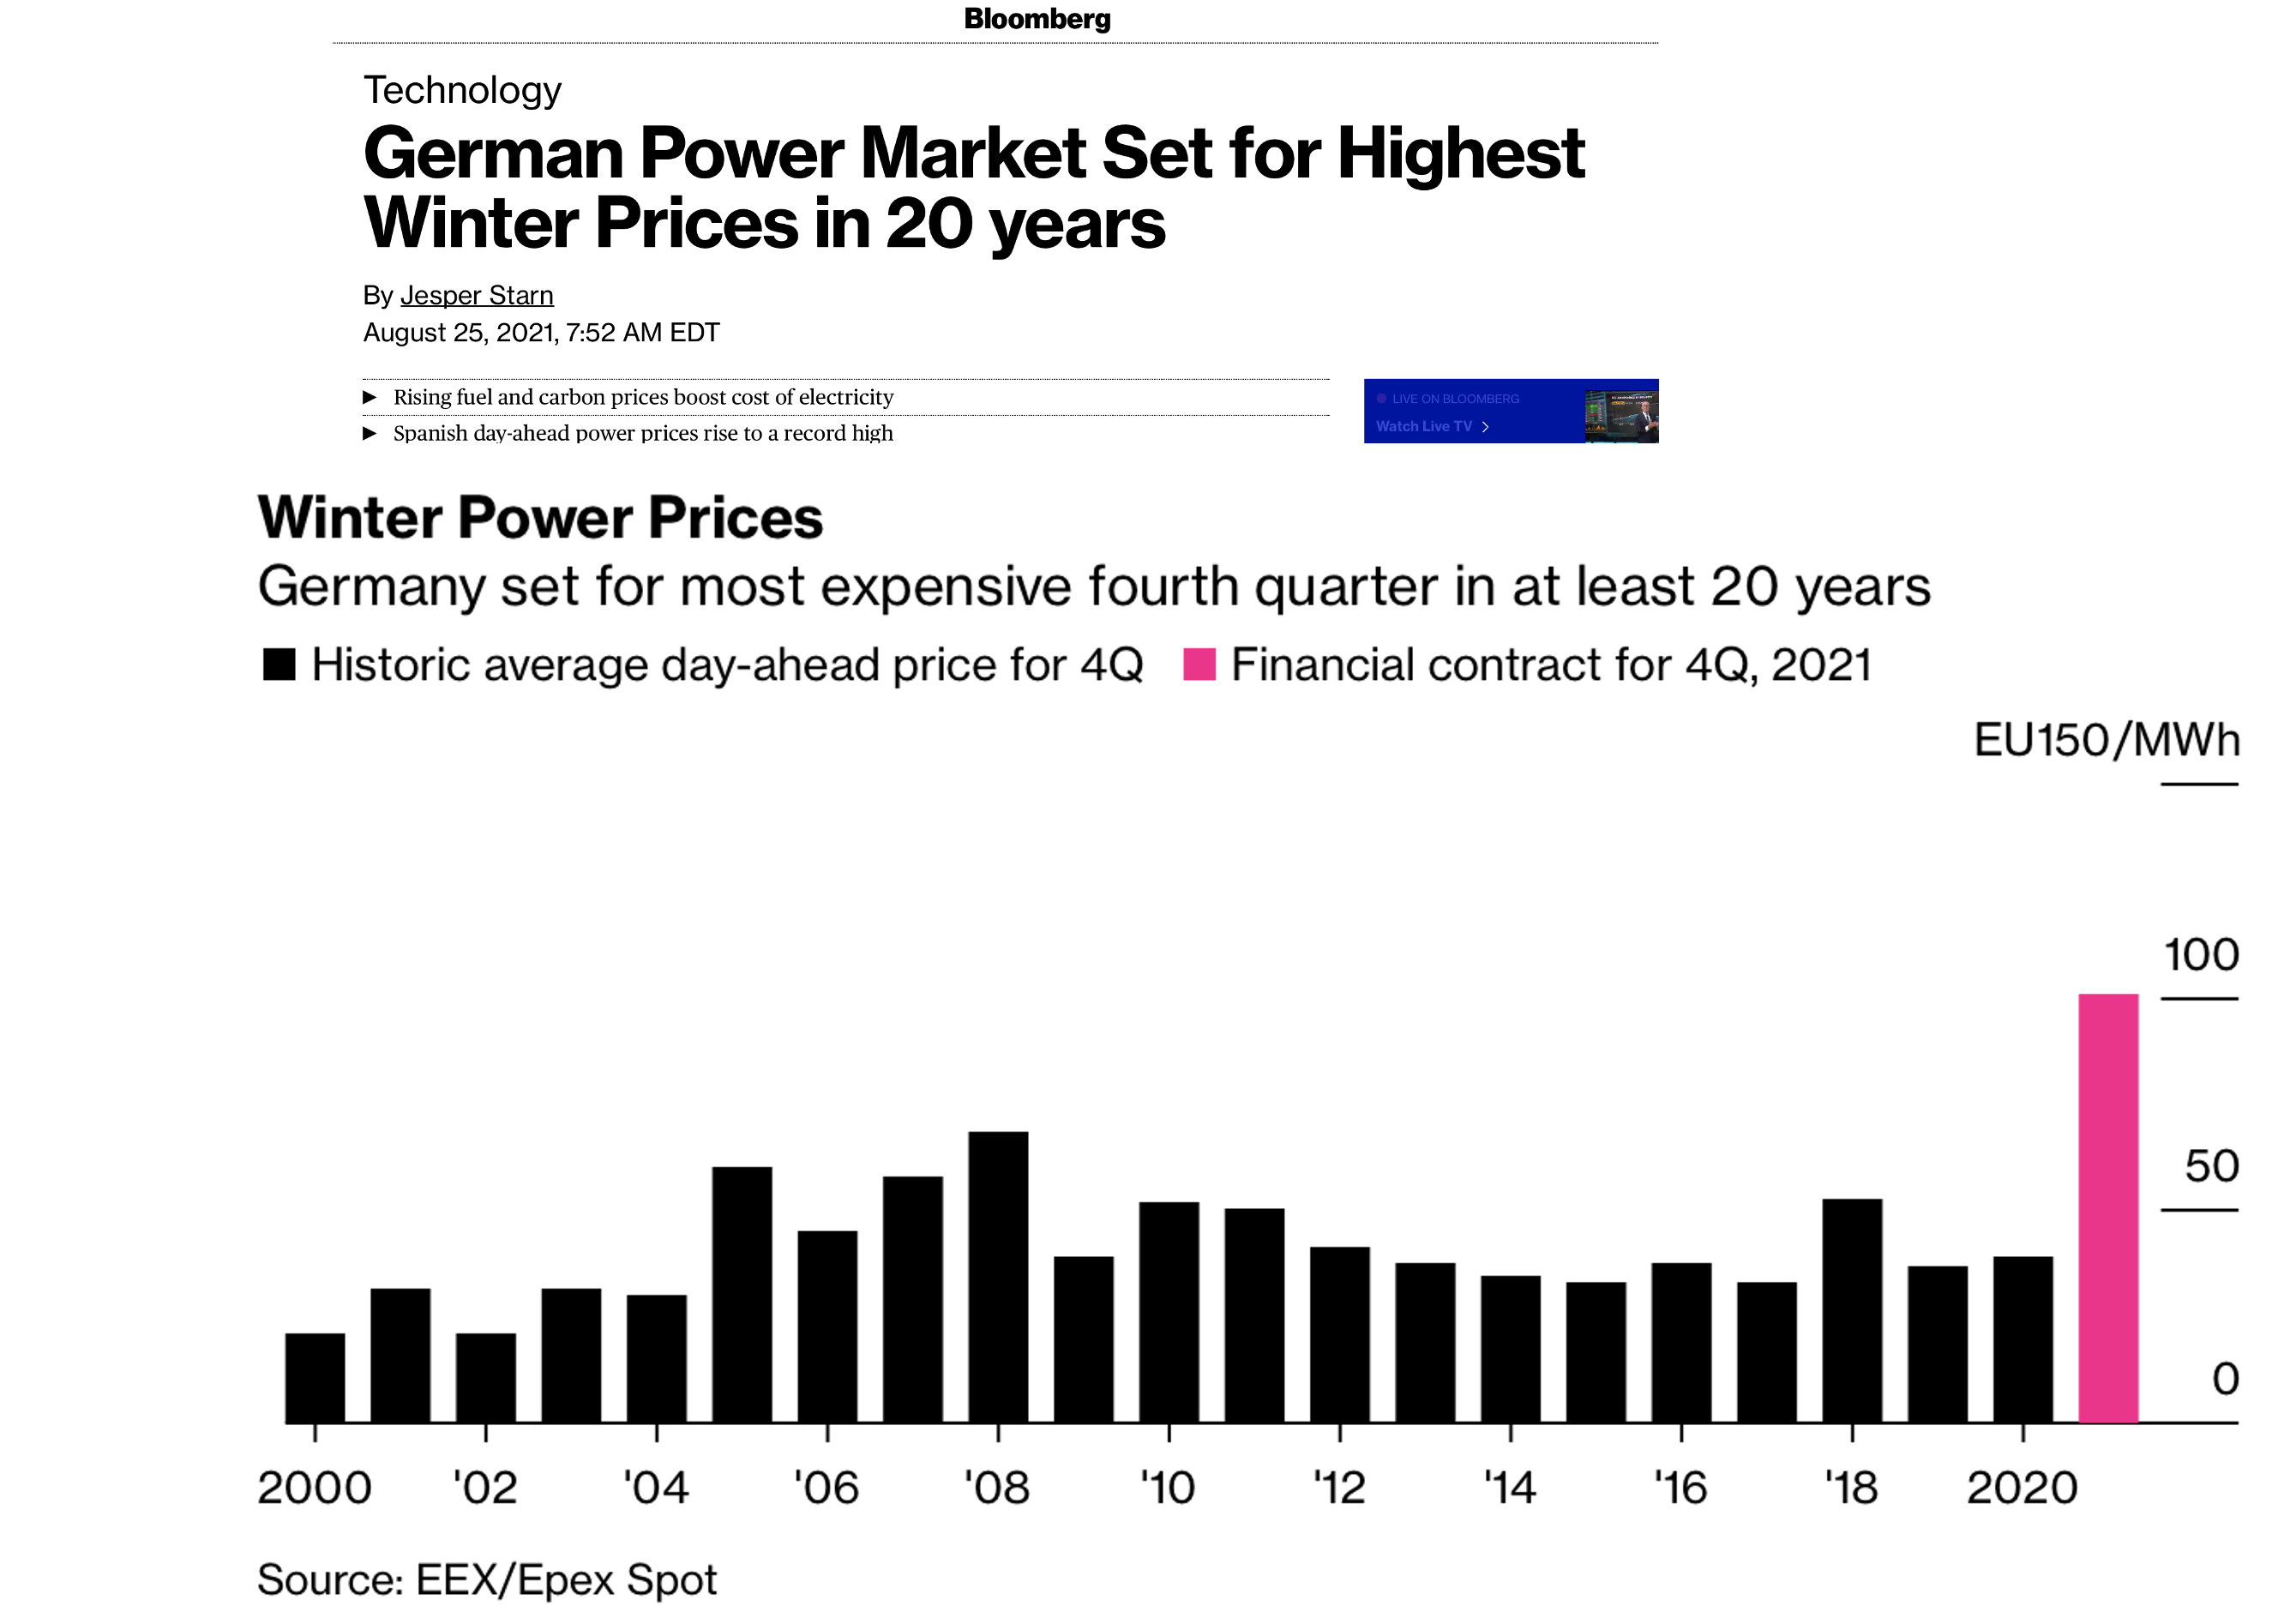
Emphasis of Solar and Wind in Germany and the escalating costs
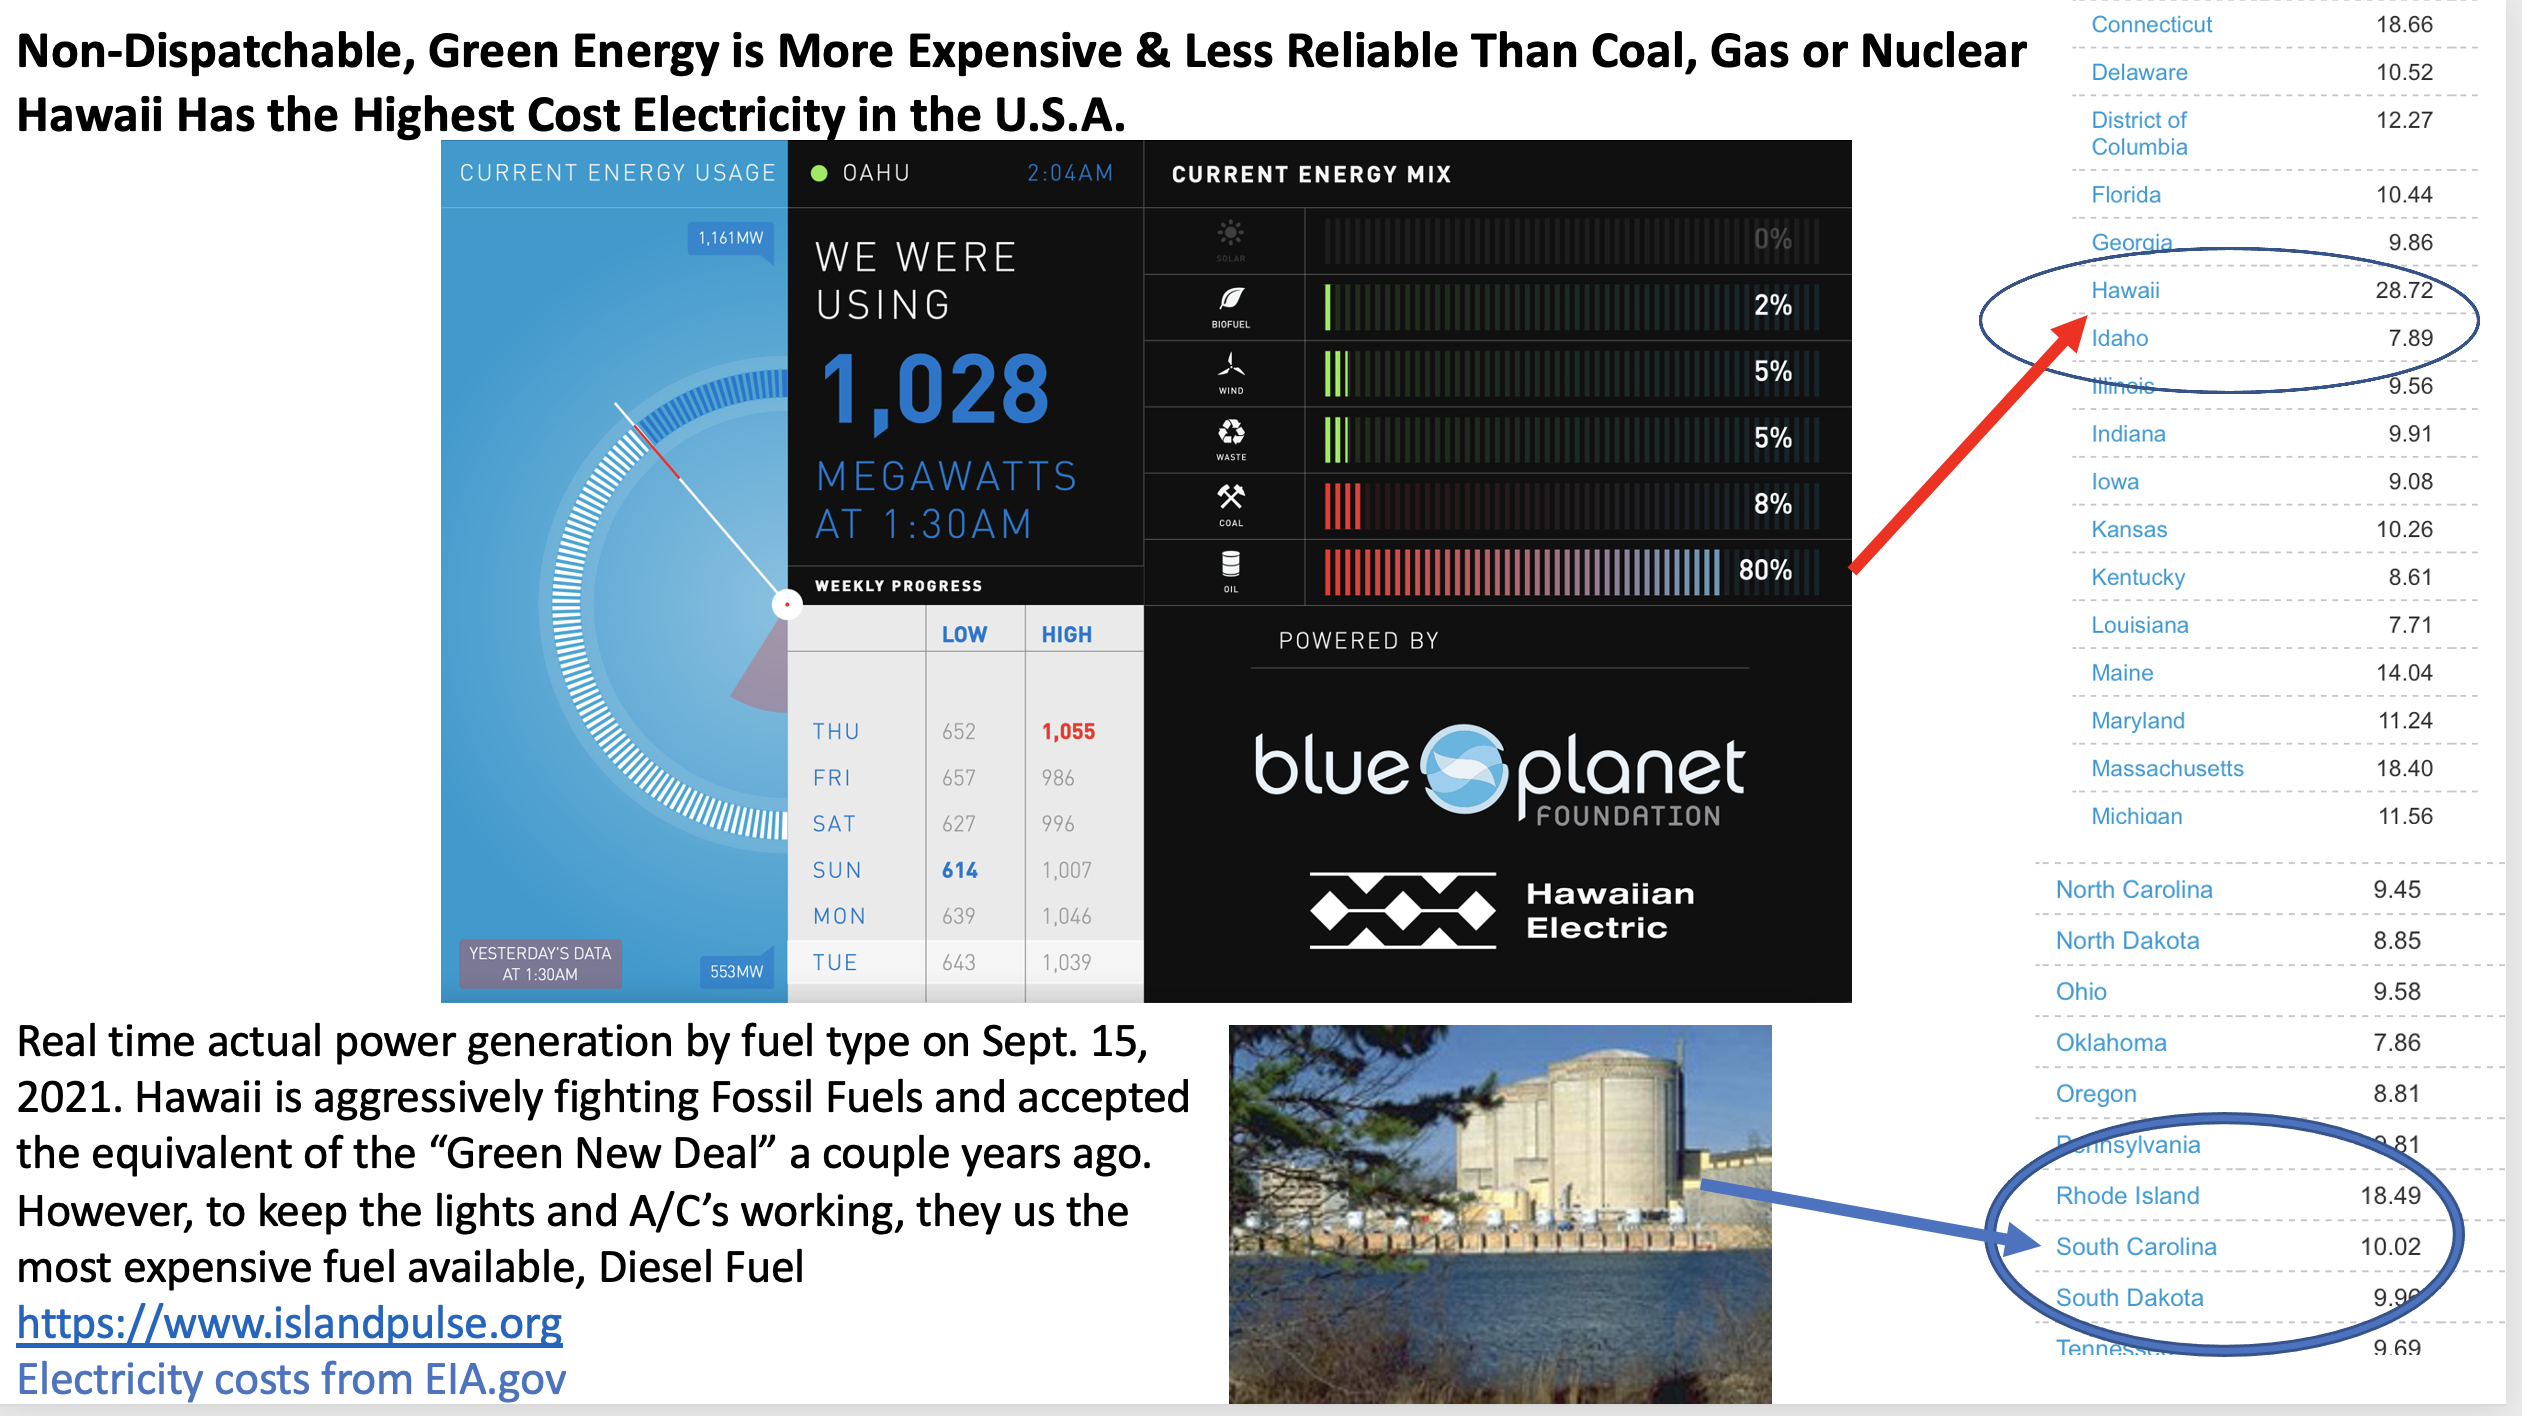
Hawaii Electric’s highest price electricity of the 50 States due to the commitment to shut down a coal plant and depend on renewables
Texas Blackout Feb 2021 due to excessive solar and wind being included in their reserve generation
Are these examples of what “we the people” desire for all of America? How can we reshore American Manufacturing with electricity costs such as Hawaii now has? How can we remain the #1 Economy in the world if we depend on imported energy. Does anyone remember the 1974 Arab Oil Embargo and what it did to slow our way of life? Reminder, 96% of our energy is provided from conventional (including old nuclear plants) sources. Yes, old nuclear is good. My state of SC generates 55.8% of our electricity from nuclear plants, some of which are over 50 years old.
American Energy Policy Gets Dumber Each Month, Elected Officials should take notice of how these policies have worked out where tried:
From Wall Street Journal Oct. 6, 2021
Hawaii has chosen their own version of the “Green New Deal” and it has earned them two first places. (1) They burn the highest cost fuel for generating electricity and not surprisingly, (2) they have the highest electric costs of the 50 U.S. States. Fortunately, Hawaii is not a major manufacturing state. These high costs of power do not bode well for manufacturing, especially primary metals like steel, copper and aluminum. However, it is important for my state of SC to continue with reasonable cost electricity. We do have NUCOR Steel and Century Aluminum and they depend on abundant and reasonable cost electricity. Hawaii can pass the costs on to Tourists and Government, SC cannot.
History of the New York Power Authority. A reminder, that most of our renewable energy is from “Old Hydro-Electric Plants” built 60+ years ago: https://nypa.gov/about/timeline
Island Pulse, Real Time Dashboard of Power Generation, Hawaii Electric has embraced renewable power generation. Check real time sources: https://www.islandpulse.org
Lawrence Livermore Laboratory Energy Flows of the U.S.A. 2020
Congress and our President are in the process of forcing Net Zero Carbon, Green Energy on all of us. In my view what this will do is increase prices of energy, make our energy less reliable, make America less competitive and in general, harm our quality of life. In thinking about this and attempting to explain why I feel this way, it occurred to me that if all of the citizens knew where our energy comes from and how much we depend on it each day, perhaps more of us would pressure our Congressmen/Congreswomen to resist this foolishness. So, here is my stab at explaining where our energy comes from and why the “Green New Deal” is so harmful.
I have been involved in the energy business for many years and the one chart that explains energy flows best, is the DOE Sankey diagram above. This shows the sources of all of our energy and how it is used throughout the economy. I have been watching this for about 20 years and interestingly, the total U.S. energy use has held steady at about 100 Quadrillion Btu’s per year. In fact, I will show a graph below of the U.S. Energy use by year from 1950-2019.
Where does the 830,000 to a million Btu’s per day come from? If we divide 100 Quadrillion Btu’s by the population of 330 million, then the per capita energy use is about 303 million Btu’s/person/year. Divide the 303 million Btu’s per person/year by 365 days and it comes out to about 830,000 Btu’s/day/person.
This is average and of course, a person living in a small condo that does little travel, will use less energy than a person who lives in a 2500 square foot home, owns a small fishing boat and travels the world. Lets say the latter example would use more than a million Btu’s per day. This energy could be in gasoline, natural gas, propane for the grill, electricity for HVAC of the home and for cooking. Included in the allottmant of per capita energy use is our share of industrial production, commercial buildings, shipments of goods and government use for the military. Below is an illustration of the forms of energy we might use each day.
So what does this have to do with the “Green New Deal” and the Clean Energy Plan Congress is about to pass? Well, if we are accustomed to living productive lives using conventional energy sources such as outlined above, then how can we sustain our high quality of lives by substituting wind turbines and solar panels for the 96.2 Quadrillion Btu’s provided by conventional forms of energy? Note that on the first figure above, the Sankey diagram I have inserted the total wind and solar in 2019 provided 3.8% of our energy. Petroleum, natural gas, nuclear, coal, biomass, geothermal and old hydropower dams provided the other 96.2%
Let’s get to electricity. The total energy used in 2019 was 100 Quadrillion Btu’s and 37% of this was used to generate electricity. So if we look into the future of EV’s and eliminating the internal combustion engine, then the energy used for transportation will need to come from electricity. Lots more electricity. How does the “Net Zero 2050” proponents think they will get to zero carbon emissions? By windmills and solar. Lots of windmills and solar. Here is an illustration from the Princeton University Net Zero Path.
My opinion is that if this path is taken, it is totally impractical and harmful to America, our way of life and our national security.
After many years of tax subsidies, wind and solar produced 3.8% of our energy in 2019. Texas, Hawaii and California have their own applications of too much renewable power which resulted in Blackouts in CA and TX and the highest electricity costs in the nation for Hawaii. How can we expect zero carbon based fuels by 2050 and still maintain a strong economy and enjoy our way of life. Perhaps more important to our grandchildren, keep English as our primary language, not Mandarin? The next three charts show the relationship of carbon emissions and manufacturing by a few selected countries.
I will close with the fact that according to a report I saw in S&P Global, China has the four largest banks in the world. The relationship of energy use and economic prosperity cannot be denied. China built more power generation in twenty years than America did since Thomas Edison’s first Pearl Street Station was commissioned.
Vaclav Smil’s quote of “Energy is the Universal Currency” comes to mind.
China loves America’s Net Zero 2050 and the “Green New Deal” Maybe they even wrote them?
This huge amount of energy is not easily replaced by alternative fuels! My response to an ASME webinar on forcing a “Green Grid” on America.
From EIA Annual Energy Outlook Jan. 2021
All Fuels Are Important, but Thermal Power Generation Is Still Number 1
Last month I participated in a continuing education webinar presented by the ASME Mechanical Engineering Magazine. I was upset by the lack of practicality and missing common sense of the presentation. Thus, I wrote a letter to the ASME Magazine’s Editor. The text is copied below.
Throughout my career—and also through the ASME’s long history (ASME’s, American Society of Mechanical Engineers, Boiler and Pressure Vessel Code, B&PV Code saved millions of lives and advanced our country!)—thermal power generation has been the greatest source of dispatchable electricity generation. In my view, policymakers have run a very good and smooth evolution of power generation diversity off the rails. The Biden Administration (probably with advisors like Dr. Jenkins) and Democrat Congress policies constitute an anti-American war on carbon. These policies, if continued, will in fact be extremely harmful to the country’s economy, national security, and eventually, when considering bans on oil and gas production and pipelines in the U.S., our freedoms. Further, if continued as Jenkins, Biden, Kerry, Et Al wish, will contribute to the decline of western civilization. (by strengthening China, Russia, Iran and their allies)
There is not space here to debate climate change, whether manmade or natural. Suffice it to say, I believe climate and weather changes are, for the most part, driven by natural forces of solar activity, ocean currents, volcanoes, tilt of the earth, and other uncontrollable dynamics. The pressure to rejoin the Paris Agreement is driven by other countries that wish to see America decline in power and influence in the world. China will gain the most by America’s decline. Princeton’s Dr. William Happer provides an excellent summary with a segment beginning at minute 24 where the effects of CO2 are discussed.https://bit.ly/3zsXcS6
Reasonable cost, and abundant, energy and electricity are crucial for our economy and the functioning of our society. Over the years, it has been well-documented that all advanced economies grow in proportion to energy use. America’s economy grew in direct proportion to its energy use over the 130-plus years since Edison’s Pearl Street Station commenced operation.
China’s economy grew from being a poor and developing country in the year 2000 to now being the world’s largest manufacturer and world’s second-largest economy. China produces more than 50% of the world’s steel and aluminum, as well as being the largest producer of manufactured products. China plans to become larger than the U.S. and is likely to pass America as the world’s #1 economy in a few years. Biden’s policies will accelerate the growth of China’s economy and the decline of America’s. To reach the status of the world’s largest manufacturer and largest producer of steel and aluminum, China built more electric power generation in the past 20 years than America did since Westinghouse and GE were founded. Remember George Westinghouse? One of America’s finest engineers.
Energy and economic prosperity go hand in hand. So, let’s look at where our energy comes from. America has used right at 100 quadrillion Btus per year for about the last 10 years or more. (last year was about 93 Quads due to the pandemic) According to the U.S. Energy Information Administration (EIA), the U.S. used 100.2 quadrillion Btus in 2019.
More than 90% of the U.S.’s primary energy consumption in 2019 was provided for use by thermal heat engines. This is comprised of about 36.8% petroleum, 32.1% natural gas, 11.3% coal, 8.4% nuclear, and 4.9% biomass. The total renewable energy consumption (excluding biomass) was 6.4%, and a significant portion of that bulk power (40%) was from hydroelectric. This primary energy use includes transportation, commercial, residential, and industrial use. Electricity consumption of our total primary energy was 37.1%.
When politicians and the mainstream media talk about energy- and planet-saving electric vehicles and renewable power generation, I think it would be wise to consider that, if we like our status in the world, and our current comforts and conveniences, then we will need at least 100 quadrillion Btus of energy per year for the foreseeable future. At present, about 93.5% of our total energy is used in heat engines and only about 6.4% is supplied by non-biomass renewables. That’s right. Check the EIA website to see for yourself.
To say changing from 93.5% heat engines to renewable power generation and electric vehicles will be disruptive is a gross understatement. In time, renewable power advances and green hydrogen from renewables will eventually come. But for the next 10 years or more, America should stay the course with modernizing our current fleet of natural gas, nuclear, and coal plants. These are what we depend on and the mid-February rolling blackout experiences in Texas should be a wake-up call to policymakers.
Another example is Hawaii, which plans to shut down its lowest cost power plant—Barbers Point coal plant. As the state moves toward its version of the new “Green Deal,” Hawaii has the highest cost electricity in the nation. Not a problem for an economy based on tourism and government facilities, but $0.25 kilowatts will not permit competitive primary metals production or competitive manufacturing in the contiguous 48 states.
In my adopted state of South Carolina, about one-third of the total electricity is used by industry. South Carolina has a thriving industrial sector, and it depends on reasonable-cost and reliable electricity. Sacrificing reasonable-cost conventional power generating plants to replace with renewables will drive much manufacturing overseas (again).
As I read the plans for South Carolina’s coal plants, all of which I have worked at and know very well, I see that several more coal units are planned to be shut down in the next 10 years. These are to be replaced with solar or other renewables. Currently, more than 55% of South Carolina’s electricity is generated from nuclear power. Therefore, replacing coal with renewables may not be a problem, if the South Carolina nuclear units keep running indefinitely. However, several of these nuclear units are into their second licenses and will begin shutting down in the 2030s. As I see it, this sets ourselves up to follow California, Hawaii, and Texas into higher-cost power production and less-reliable power supplies. All fuels are important!
Let’s review the last 15 years of fuel changes in the U.S. In 2004, electric power generation was about 92.4% thermal generation. In 2019, the percentage of thermal generation was still the highest at 83.6%. Natural gas made the largest gain at the expense of coal. Wind grew from 0.4% to 7.1% over the 15-year period. Now, if policymakers are concerned about electric reliability and competing in the world with manufactured products, they should rethink the trends toward more intermittent non-dispatchable renewables.
Americans have lived through disruptions before. I lived in a small town in North Carolina, which the county seal showed textiles and aluminum production as being the most important for its economy. Then, after the North American Free Trade Agreement (NAFTA) went into effect, the textile mills closed down, killing about 7,000 jobs in a county with 60,000 people. A few years later, Alcoa Corp. shut down the aluminum smelting plant that had been in operation for more than 100 years, causing another 750 or so jobs to be lost. Aluminum smelting is very energy intensive, it takes about 5 kWh to produce one pound of aluminum. It doesn’t take a world class Economist to understand how China has become the world’s largest producer of steel and aluminum. China uses about 57% of the world’s coal to power their industry. True, China uses more coal than all of the rest of the world put together.
In Texas, I did much work from 1978 onward at an Alcoa plant in Rockdale, as well as at numerous coal plants. Rockdale was the largest aluminum smelter in North America, and it was shut down in 2008 due to oversupply of aluminum from China. Over 6,000 MW of reliable, reasonable-cost coal power generation has been shut down in Texas since 2008. Had these coal plants not been retired, perhaps the events in mid-February may have played out differently.
Energy and economic prosperity are inter-related. The Green New Deal and more renewable power will harm America’s competitive advantage. If we think February was a bad month for electric reliability, imagine what the Green New Deal and further accelerated disruptive changes to renewables will do to the rest of the U.S. Preserving our good lives requires about 100 quadrillion Btus per year. In my view, obtaining this energy from all available fuels within our borders is important.
I suggest that the ASME publications and energy programs consider the facts of All Fuels and why they are important for our country.
Respectfully submitted,
Richard F. Storm, PE
Believer in Freedom to use of Energy for sustainable high quality lives