REAL ESTATE PRACTICES COMMITTEE
Delaware County Bar Association
July 15, 2016
Energy for America
Sunshine, Wind, Nuclear and Fossil Fuels
How Energy Policies and Federal Regulations are Impacting Economic Prosperity
By Richard F. (Dick) Storm, PE, CEM
Introduction
The name of the seminar series suggests that you might be interested in the inter-relationship of energy, environmental and trade policies that impact the economy, Real-Estate demand and jobs for Middle Class Americans. Here are my observations from my own experiences and travels as to how I think the “Four E’s” are inter-related”. What are the fours E’s? Energy, Environmental, Education of energy and environmental science and Economic Prosperity. These are my personal views which are based on my five decades of working as an engineer in the electric power generation business.
Energy fuels America’s manufacturing, jobs, transportation, heating, air conditioning, lighting and is essential for all of our commercial, industrial production, good paying jobs and financial well-being. In summary, abundant, reliable and reasonable cost Energy is essential to sustain our everyday lives. Just think of the last extreme weather event that cut off your electricity for a few hours or a single day. How about life altering shortages of gasoline as us older folks remember from the Arab Oil Embargoes of 1974-1980? The purpose of this presentation is to cover the inter-relationship of energy with the economy. An example of energy and primary metals production will be explained to show how rising costs of green power & the war on carbon, combined with International Trade policies has harmed employment by destroying millions of Middle Class manufacturing jobs. Current U.S.A. Regulations and Policies are helping to drive American Manufacturing overseas. Where does our energy come from? How do Renewables fit in? What are the realities of energy supply? The comparative costs? How about National Security? Federal and state regulations are harming America’s competitiveness in manufacturing, driving jobs overseas and causing a decline in American productive capacity. We need policies that will return America to a Nation that Builds and exports products. The notion that America can remain strong as a “Services only Economy” is wrong, in my opinion. In the following presentation, I will do my best to show the facts of why I believe this. The topics I wish to cover are in two parts:
- Energy and the Relationship of Reasonable Cost Electricity to Manufacturing in the U.S.A. (Connecting the dots of energy and environmental regulatory policies to Real-Estate)
- Relationship of Energy & Economic Prosperity
- Why the Decline of American Middle Class Economic Prosperity from the loss of Manufacturing Jobs? Trade, Currency Manipulation, Unions, Regulations
- Manufacturing and Energy Costs Are Related, so where have American jobs gone?
- Transfer of Manufacturing Capacity Overseas and Trade w/China
- The Four E’s; Energy, Environmental, Education and Economic Prosperity
- The loss of “Middle Class American Jobs” is a loss of potential homeownership, contributing to the wide separation of incomes between wealthy and working class folks.
- America needs to build and export more products made in the U.S.A.
- Energy and Electricity Production in the U.S.A.
- Energy Production in PJM Region
- Regulations and Energy Costs in U.S.A.
- Renewable Power
- Nuclear Power
- Coal Power
- Natural Gas
- Today’s Cost of Competitive Electricity Generation
- Relationship of Energy and Economic Prosperity
The NASA Composite Photo, “Earth at Night” shows the world at night. You can see the difference of thriving economies and the Developing World by the level of illumination. The stark differences of lights in Africa and North Korea are striking and for those of us who have traveled to South America, Asia and Africa it is not a surprise. However, Americans take our abundant and secure energy for granted. Public education and the News Media are promoting Renewable “Green” Power and suggesting that we can eliminate the use of fossil fuels in our lifetime. America and the rest of the Developed World depends on Fossil Fuels for over 80% of our energy. This presentation will attempt to highlight the relationship of energy and economic prosperity.
NASA-The Earth at Night a composite photograph
North & South Korea at night. This photo presents a stark contrast of North Korea’s version of Socialism and South Korea’s Freedom and Capitalism. Abundant and reasonable cost electricity combined with Freedom, improves the quality of life.
The figure above was presented by Carl Bauer then of the National Energy Technology Laboratory about 2007. I was impressed with the clear relationship of GDP per person and energy use. This relationship applies to the U.S.A. as well. As our economy and manufacturing boom, people are working overtime spending money for vacation travel and enjoying life, we use more energy than if we stay at home and conserve. Then there are the ever increasing numbers of electrical gadgets that we all love. Soon to come are more attractive electric cars such as the Tesla. Think about where the electricity to power these will come from. I will cover that later.
- Why the decline of the American Dream for Middle Class Americans? What does Economic Prosperity have to do with energy or National Energy Policies?
You are a group of lawyers and Real-Estate Professionals and a fair question would be, “What does energy, green energy policies and environmental policies have to do with me?” Well, not directly but the ever increasing Federal Regulations to force green power on the public is harming America’s productive capacity. Of course it is more complicated than just the cost of electric power. There are other important factors that impact America’s competitiveness and manufacturing. Amongst these other factors are: International Trade Policies, Unions, China’s manipulation of their currency, Dumping of primary metals and manufactured products on the world markets and others.
Let me make a point here. This is an Election year and there are two clearly different approaches to the Economic Recovery of America. I submit that the main problem cannot be handled by changing the President or his or her Party, The problem with the decline of American prosperity has much to do with Federal and State Regulations. For example, the EPA, Department of Energy, Department of State, Dept. of the Interior, IRS, Banking Regulators and more remain no matter which party has the office of President. When I contact my Congressman, he politely lets it be known that there is little he can do about the “Professional specialists that are employed in the EPA or other Government Agency”. These people are thought to be as professionals to protect public health and safety. But since the EPA was formed in 1970 and the Dept of Energy in 1977, they have outlived their purposes and simply create new regulations each year, further harming America’s productive capacity. Check the CEI (Competitive Enterprise Institute) web site and Wayne Crews annual “10,000 Commandments”. These provide some further insight to my suggestion that it is an excessive Regulations problem.
My expertise and experience is in power generation so I will focus on where our power and energy comes from and how we use it. First, let’s take a look at the total energy used in America and the source of that energy. The figure below is called a Sankey Diagram. The thickness of each bar is representative of the amount or percentage of each form of energy flow from the supply on the left side to the use or demand on the right side.
This figure is provided by the EIA (Energy Information Agency) and the above data is from 2014. It shows the total U.S.A. energy consumption of about 98.32 Quadrillion Btu’s. Let’s round it off to 100 Quadrillion Btu’s. What does this represent? Well, if we divide the 100 Quad’s by a population of about 320 million persons then the equivalent visualized energy would be as shown on the next figure. Each American Citizen uses about 334 million Btu’s per year. This is average. Some of us have larger homes, some drive more, some fly more in commercial jet aircraft. Manufacturing to provide jobs, travel, home heating and cooling and Mall lighting and heating all require energy. The intent of the next chart is to illustrate what 334 million Btu’s is equivalent to in coal, oil, gasoline, propane, jet fuel and diesel fuel. This slide was prepared using 2007 data and the total American energy use that year was over 101 Quadrillion Btu’s. The economy was also stronger and growing then. Population was smaller too.
Worth remembering is our high school science class definition of a Btu. A British Thermal Unit is the amount of heat that will raise one pound of water (about a pint) one degree Fahrenheit. Another equivalence that is important is that if each Btu was converted into mechanical energy at 100% efficiency, then one Btu=778 Foot pound of work. This is where the term “Heat Engines” comes in. “Heat Engines” sometimes called “Prime Movers” are at the root of a thriving modern economy. Thus, the government measures and reports “Quadrillion Btu’s” as a measure of America’s and the world’s energy production and consumption.
So, what does this have to do with home sales and the American Dream for the Middle Class Americans? As America has implemented more and more Federal and State Regulations, the cost of electricity and regulations on energy use for manufacturing has crept up. As I stated before there are other factors too. But the cold hard facts of manufacturing employment are less people are employed in manufacturing today than are employed in government. The total “net” number of manufacturing jobs has declined from over 17 million in 1998 to currently, about 12.3 million. Some have said that up to 8 million manufacturing jobs have been lost to China alone. Therefore, the loss of five million net jobs takes into consideration the new jobs that have been created since 1998. These figures can be checked with the US BLS (Bureau of Labor Standards) and the NAM (National Association of Manufacturers).
Most of these were “Middle Class, head of household” job holders. Think about major Pennsylvania companies alone such as US Steel, Bethlehem Steel, ALCOA, Sun Shipbuilding, Scott Paper and many more.
- So where have the jobs gone?
I have lived the last 45 years or so in the south. Once the textile capital of the world, I was told from a retired executive of Wiscassett Mills, that Cannon Mills (Wiscassett Mills was a subsidiary of Cannon Mills)) had about 60% of the world market for towels, sheets and pillow cases in the 1960’s. North Carolina was also the Furniture Capital of the world. Hundreds of thousands of manufacturing jobs from textiles and furniture were lost from North and South Carolina over a couple decades. Why? Unfair trade policies under NAFTA. Here in Pennsylvania this was the Steel Capital of the world. This state has also lost hundreds of thousands of manufacturing jobs in the primary metals business.
In 2006 the CEO of NUCOR Steel, Dan DiMicco wrote a book entitled, “Steeling America’s Future” This book sub title is, “A CEO’s Call to Arms, Saving Manufacturing through Free Trade”. An important message focused on our Trade policies and the impact of world trade on the Steel Industry in America. DiMicco’s message was prescient and important then and still is now. China’s steel manufacturing capacity has grown to be over 50% of the world production capacity. NUCOR Steel is America’s largest Steel producing company. NUCOR became the largest U.S.A. Steel producer and outperformed other U.S.A. manufacturers. How? With higher productivity and lower production costs by introduction and perfecting the Mini Mill concept using scrap steel for feedstock to produce steel alloys and shapes to order, rather than integrated mills using iron ore, coke and limestone. NUCOR is Americas largest steel producer and the world’s largest steel recycler. NUCOR’s furnaces are electric arc and utilize about as much electricity for one furnace as a medium sized city. Upwards of 175 MW for just one steel melting furnace. This is one example of the relationship of reasonable cost electric power and jobs in America.
The demise of Pennsylvania’s high paying jobs in steel production is well known by those of us who are over 60. Pennsylvania is/was the home state of Bethlehem Steel, US Steel, Phoenix Steel, Sharon Steel and others. Only US Steel survives of these and now it is at a fraction of the productive capacity of the 1960’s.
Another fine Pennsylvania company once the size of G-E and now defunct, is Westinghouse Electric Company.
Let’s take a look at a surviving Pennsylvania metals company that is still viable but has been significantly downsized in the last decade. That company is ALCOA. In 2006 Alcoa employed over 120,000 employees. Now according to the 2015 Annual Report they employ about 60,000 worldwide.
The Aluminum Company of America known as ALCOA since about 1998 was founded in 1888 and still has their world headquarters in Pittsburgh. ALCOA currently employs about 28,000 in the U.S.A. the other 32,000 jobs are overseas. ALCOA aluminum production helped us win WWll, build the best commercial aircraft in the world and have made some of the finest engineering breakthroughs using lightweight aluminum alloys. The newest Ford F-150, latest G-E Aircraft engines and Audi automobiles are three examples of ALCOA assisted engineering breakthroughs. So, if we are so good at engineering, innovation and creativeness, then why are so many of our jobs leaving the U.S.A. ?
Of course, it is not as simple as blaming energy and environmental rules that have gone rogue. It is at least nine factors which include energy regulations, misguided public education and excessive environmental laws for three of the nine:
- Currency manipulation by our International trading partners
- Trade Policies such as NAFTA which killed the Textiles and furniture industries in the south
- Foreign manufacturers “Dumping” of products in America. Especially Steel & Aluminum
- Unions which contributed to the demise of the US Steel and Aluminum Industries
- Robots and automation of manufacturing processes to minimize human labor
- Excessive Federal Government Regulations by non-elected Bureaucrats
- Excessive Environmental and Energy Rules/Laws
- Misguided Public education on the fundamentals and truth of energy production and environmental protection
- Business concerns for the “Uncertainty” of future Federal Regulations
As America’s manufacturing workforce has declined, China’s has increased at an exponential rate. China has dumped steel and aluminum on the world markets and risen to be the largest manufacturer of steel and aluminum in just a decade. This has been done at the expense of American jobs. Here are several figures that illustrate the rise of China and the relationship of energy production/consumption in China.
Reasonable cost electricity is important to power competitive manufacturing production. China has increased their productive capacity in part because of low cost coal power generation. Also, aided by low wages and currency manipulations. Please note the exponential growth of coal power production. China has built over 150 new coal plants in the last decade. India is also building many new coal plants. The Asian’s get it. Reasonable cost energy is needed to create economic growth and jobs.
The photo above is aluminum ingots for export from China. Photo courtesy of the Wall Street Journal. Dumping primary metals is possible with no regard for profitability in a Socialistic/Communist Nation. Full employment is important for the “Subjects” or “Communist Comrades” but unlike ALCOA, US Steel or Nucor Steel, the Chinese do not need to make a profit. They can and do produce enormous quantities of commodities and dump them on the world markets. When competition becomes difficult for them, then they manipulate their currency to make their exports more attractive.
Here are a series of graphs that illustrate the transfer of American Manufacturing Capacity to China. These are from reliable sources including the WSJ, US Government, Congressional Research Service, ALCOA Annual Report and the International Aluminum Institute.
Note the ramping up of Chinese aluminum capacity reached exponential growth rates starting about 2006. ALCOA employment that year was over 120,000 employees.
The world map with total aluminum production below shows China and the world production as of April 2016. China is less than a decade has increased their primary aluminum production capacity to now exceed 50% of the world capacity.
The future for American competitiveness is harmed by the loss of manufacturing in at least six ways:
- Once a smelter is shut down it is very expensive to restart
- Skilled craftsmen and technicians are lost
- Engineering personnel are retired and their expertise is lost
- Research & Development for new processes and advanced products are reduced because of the lack of funding from profitable manufacturing cash-flow
- Reduced American jobs drive more College Students to study Humanities and Arts studies that have (mostly) dead end employment opportunities
- Once prices are driven down by “Dumping” the consumers of aluminum ingot metal become accustomed to the artificially low prices and are reluctant to pay higher prices for American manufactured aluminum.
If you doubt the above, think about what China has done to the United States Steel Industry. It is hard for my son’s company, Storm Technologies to purchase US Made pipe and plate. When he does it is at greatly higher prices and longer lead times than Chinese steel. Even the recently completed San Francisco-Oakland Bridge was constructed of Chinese Steel. Worse yet, Chinese engineering and construction. This erosion of our intellectual and creative capacities, combined with the loss of productive manufacturing capacity is not helpful for our next Generation. This also contributes to the loss of Middle Class jobs and is related to Real-Estate sales.
More worrisome for the long term is the loss of funding for Research and Development of new products, most of which (R&D) has been funded by Industry from a portion of profits of manufacturing. So, as we lose manufacturing we also decline in intellectual property advancement for building products in the U.S.A.
The smelting of aluminum using the electrolytic process pioneered by the Aluminum Company of America uses about 6-7 kW of electricity to produce one pound of metal. It is one of the most electricity intensive manufacturing processes for a common metal. Low cost electricity is imperative to produce aluminum. For example, the aluminum ingot price on the London Metal Exchange is currently about $0.65 per pound. If it takes six kilowatts of electricity to produce one pound of aluminum, then at the US Wholesale electric rate of about $0.06/kW the electricity component for smelting alone is about $0.36/pound or over 50% of the selling cost of the ingot metal. This does not include the energy for refining Bauxite to Alumina and the transportation, labor, cost of Capital, Research & Development and yes, profit. Profit and Dividends to the investors should not be dirty words in America!
The production of aluminum is extremely energy intensive. The figure below illustrates the production of aluminum which requires enormous amounts of energy from the mine to the final use. (Of course the production of all primary metals are energy intensive including steel, copper, titanium, etc.)
The world supply and demand of the light metal has caused a severe drop in pricing from the combined effects of Chinese over-production (Dumping) and the world recession.
Meanwhile in China they have built more than 150 new Coal plants since 2006. America is shutting down about 300 existing coal plants and even more foolish, shutting down some nuclear units. The Chinese are not bound by the Paris COP 21 agreement to reduce carbon emissions. Neither is India. The Asian nations understand that their economic prosperity depends on carbon based fuels and or nuclear generated electricity to power their manufacturing capacity and to lift their people from poverty. So do the African nations. In fact, China is building coal power plants in Africa and other Developing Countries. We have ceded our leadership (and manufacturing jobs in the U.S.A.) of providing power plants to the Developing World to China, Japan and South Korea. When I entered the manufacturing business for power generation equipment in the 1960’s, the U.S. Agency for International Development (US AID) was sending U.S.A. manufactured generating components to build power plants, water purification systems and other infrastructure components to Developing Countries. The American industries that I remember participating in the USAID programs of the 1960’s were Babcock & Wilcox, Westinghouse, Combustion-Engineering, Foster-Wheeler and more. Now China, South Korea and Japan have that lead. We send our earned wealth to finance Utilities in the Developing World. The manufacturing and jobs however, have been transferred to Asia.
The share of added value of manufacturing of various industrialized countries. Note the steep rise in Chinese Value Added Manufacturing since 2006.
How does China power their Manufacturing? Same as the U.S.A. did in 2006, with Coal power. The difference is, America uses clean coal plants. New coal plants for the U.S.A. cannot be built. There is no available and commercially viable technology to capture and sequester the carbon dioxide of coal fueled power plants. In essence, new coal plants (if the EPA so called, Clean Power Plan remains) are illegal to build.
A topic for another day is the discussion of Rare Earth Minerals and their strategic importance for America. The Federal Government rules on mining whether hard rock or coal are incredibly restrictive. Many Federal agencies just say NO to exploration, mining, drilling, Hydraulic Fracturing and any harvesting of natural resources. China, on the other hand, is exploiting the importance of raw materials, Not only in China but around the world including such places as Brazil, Africa, Canada and West Virginia. As I said, that is a topic for another day. Check the National Mining Association website for more information on the difficulties of obtaining a permit for any kind of mine. Remember the “Pebble Copper Mine” proposed for Alaska and killed by Federal Regulators a few years ago. This is just one of many examples. It is not only coal mining that the government regulators excessively regulate.
Back to ALCOA. The company continues to operate but at a much downsized business since the 1970’s when I first became associated with them as a contract engineer. Alcoa was good to me. I traveled all over the world to four Continents and Jamaica while on contract for them. An example close to my last home town of the last 40 years is Stanly County, NC. In Stanly County when I moved there in 1977 the highest wages were paid by ALCOA’s Badin Woks aluminum smelter. For a small county of about 60,000 citizens the combined payroll of ALCOA and Textile firms was greater than sixty million dollars per year. Since the decline of local manufacturing in Textiles and the aluminum smelting operations about 8,000 jobs were lost in a County with a total population of about 63,000. Most of the manufacturing and jobs moved to Asia. The same story of lost middle class jobs can be told of jobs in Pennsylvania steel towns like Johnstown, Bethlehem, Aliquippa, Beaver Falls and Fairless Hills.
- Pennsylvania Energy
Pennsylvania has become a major energy producing state thanks to the Marcellus Shale Gas formation and Hydraulic Fracturing. The economic boom of western PA is not from wind power or Renewables; it is from abundant natural gas production. By the way, the EPA and Federal Regulators have more regulations and more restrictions in mind for natural gas. They are Ideologically driven to favor green energy and they over regulate any fossil fuel exploration or production. They hate fossil fuels and regulate accordingly.
Hydraulic Fracturing has revolutionized natural gas production in America. The amazing innovations and productivity of natural gas production has vaulted the U.S.A. to being the leading producer of natural gas in the world.
Quick Facts on Pennsylvania Energy from the EIA web site:
- Pennsylvania’s annual gross natural gas production, primarily from the Marcellus Shale, exceeded 4 trillion cubic feet in 2014, doubling the state’s 2012 production and making Pennsylvania the nation’s second-largest natural gas producer.
- Pennsylvania was the fourth-largest coal-producing state in the nation in 2013 and the only state producing anthracite coal, which has a higher heat value than other kinds of coal.
- In 2014, Pennsylvania ranked second in the nation in electricity generation from nuclear power. The state obtained 35.5% of its net electricity generation from nuclear power, nearly as much as the 36.1% obtained from coal.
- Pennsylvania’s Alternative Energy Portfolio Standards require 18% of electricity sold by 2021 to come from approved renewable or alternative sources, including at least 0.5% solar photovoltaic power. In 2014, renewable energy accounted for 4% of Pennsylvania’s net electricity generation.
- As of 2013, 51% of Pennsylvania households used natural gas as their primary home heating fuel, while 21% depended on electricity for heat and 18% relied on fuel oil. Other heating fuels used in the state included propane, wood, and coal.
- Natural gas (38%) provides heat to more Pennsylvania homes than any other fuel, but electricity (29%), fuel oil (20%), and propane (9%) are also widely used in the state, according to EIA’s Residential Energy Consumption Survey.
Last Updated: May 21, 2015 By the US Dept. of Energy, EIA (Energy Information Agency)
- What Were the Top 10 Electricity Producing Plants in the U.S.A. in 2015?
The top 10 generating plants in the U.S.A. during 2015 are:
- Palo Verde, AZ 32.5
- Brown’s Ferry, TVA AL, 27.5
- Oconee, Duke Energy, SC, 21.9
- West County, FPL Natural Gas, 20.4
- Braidwood Nuclear, Exelon, IL, 19.7
- Byron Nuclear, Exelon, IL, 19.4
- South Texas Project, Nuclear, 19.4
- Limerick Nuclear, Exelon, 18.4
- Grand Coulee Dam, Washington State, 18.8
- Miller Coal Plant, Alabama Power, 17.8
These are major plants that truly carry the load to supply America with reliable high quality electric power. Notice, seven of the ten are nuclear plants. Not on this list, but important contributing nuclear plants are Exelon’s Three Mile Island, Clinton and Quad Cities Plants. There are now less than 100 operating nuclear plants in the U.S.A. and these provide the most reliable carbon free power. Just a few years ago there were 104 operating nuclear units. Why are they threatened with being shut down? Two reasons. Competitive Generation Economics because of low cost, abundant natural gas and forced subsidies of Renewable power such as wind and Solar. One of the top ten producers above, Byron Nuclear Power Plant has been reported as at Risk for shutdown, due to low competitive power generation costs of natural gas and subsidized Renewables.
The excessive Federal Regulations that favor “Green” energy and are against carbon based fuels combined with declining steady 24/7 industrial power demand has created uncertainty for the Utilities and shutdowns of many reliable power generation facilities. There are now 99 operating nuclear generating units. Most are over 30 years old but have been refurbished to run another 30 years. Two new nuclear power plants are being built in the U.S.A. One each by SCE&G and Southern Company.
- Coal Plant shutdowns
Coal has been the main fuel for reliable electric generation for the last 100 years. In fact, as recent as 2014, coal plants generated over 40% of America’s electricity. Due to Federal Regulations including the MATS (Mercury and Air Toxics) and Clean Power Plan (Carbon Limitations), many reliable coal plants are being shut down.
The map below is available from the EIA and National Mining Assoc. This shows the locations of 300 coal plants being shut down by 2020.
Another chart provided by the EIA which shows the electricity generation by type in 2014. Note that as recent as 2014 coal provided 18% of America’s Total Heat Energy. This represented about a Billion tons of coal. Since 2014 the coal consumption has been severely reduced, has Bankrupted many coal companies and reduced mining and coal plant employment.
Coal plant shutdowns have been caused by a number of factors which include:
- The Hydraulic Fracturing advances that have made natural gas abundant and cheap over the last five years. A very recent and large “Step Change” in gas availability and pricing.
- Federal Regulations, including The EPA and President’s War on Carbon based fuels
- International trade policies
- Shut Down of American factories. Especially primary metals producers
- Efficiency improvements of LED Lighting, improved building codes for reduced heat losses
- Low cost and abundant natural gas supplies
- “Green Power” subsidies that force Renewable power on consumers including Industrial uses
- Public pressure because of the Demagoguery and mis-information of the importance of coal for America
Last year, 2015 natural gas slightly exceeded coal as the predominant fuel for electric power production.
- What About Renewables
The “PA Alternative Energy Portfolio Standard requires 18% of Pennsylvania’s electricity to be provided from renewable or alternative sources by 2021. Note that although growing, in 2014 only 4% of PA’s electricity was generated by wind, solar and other renewable sources.
As more and more Solar, Wind and Bio-Mass electric generation is forced on the public, the more the cost is going to increase and the more US manufacturing will be at a further disadvantage in world competition.
A key point to be made about Solar and Wind Power is, these are “Intermittent”. Unlike proven coal and nuclear plants that generate power 24/7 with well over 95% reliability, Renewable Power is intermittent and truly at the mercy of nature.
An example of the cost of solar as compared to a natural gas turbine. This cost analysis is provided by Philip Dowd and published on the “Watts up with That Blog”
The Capital costs of building a solar plant compared to a natural gas plant are compared. Basically, a solar project will cost about 13 times as much as a gas turbine plant of the same size. Also, provisions need to be made for backup power for nights and when the sun is not shining. The example given shows a Capital cost of $200 million dollars for a gas turbine combined cycle plant and $2.6 Billion dollars for a similar sized Solar plant.
As Renewables are being forced on Americans, it is raising the true cost of electricity. Tax credits make it attractive to developers to install solar and wind production facilities, but the fact remains, they are expensive.
Germany and the UK have had recent experiences of escalation of electricity prices and concerns about electric Grid reliability. America should learn from the experiences of these other countries that have forced Renewable power on their citizens. The high cost of renewable power is only reported in trade journals and not widely known by the American public. The abundant and low cost natural gas produced in Pennsylvania, Texas and North Dakota has permitted relatively flat power costs. The low cost and abundant natural gas has masked the rising cost of power generation by the move to Renewables. Natural gas has a history of cost volatility. If the U.S.A. starts exporting our natural gas to sell at world market prices it will be good for America’s trade balance and for jobs in America. But, the world market cost of natural gas is about four times that in the U.S.A. So, with about 80% of the cost of power generation in a Thermal Power plant being the cost of fuel, when natural gas prices rise, so will the production cost of electricity.
- Electricity demand on this facility is 4,800 MWh/day, about the demand for a community of 160,000 average households[i]
- The “up time” of both plants must be equal. That is, both must be equally reliable and produce the demand for the same fraction of time over the course of one year.
Estimated Capital Cost to Generate Electricity
This does not include the cost of backup power such as natural gas, nuclear, coal and hydropower plants that must be maintained and ready to replace power when the solar plant becomes unavailable. The backup power provided by conventional power plants is a large factor that is causing extreme problems for the Utilities that have much of the current installed capacity that is depended on when needed but not adequately compensated for to keep in first class condition and ready for backup of the “Politically Correct” Renewable Power generation. The most extreme example of the harm being done is the shutting down of perfectly reliable and safe nuclear power plants. Once the lowest cost power production available.
Low production cost of electricity has been the backbone of American manufacturing, Reasonable cost electric power in the past has truly fueled America’s economic prosperity and productive capacity. Here is a perspective on the cost of producing electricity from the Nuclear Energy Institute:
Nuclear electricity production costs are much lower than any other type of generation . This can be seen from the Nuclear Energy Institute’s website, which provides the production costs for nuclear, coal, natural gas, and petroleum generating units. (Renewable energy sources are not included.) The costs are based on data submitted to the Federal Energy Regulatory Commission (FERC) on the FERC Form 1 by regulated electric utility companies. These costs are shown in the graph which follows. Note, excluding Renewables which are only competitive because of subsidies, Nuclear Power is the least cost generation. Nuclear for those who believe man is changing the climate, is the largest most reliable form of “Carbon Free” energy.
POWER Magazine wrote recently that the Secretary of the U.S. Department of Energy, Dr. Ernest Moniz, said: U.S. Secretary of Energy Ernest Moniz said the time will come—perhaps 10 to 15 years from now—when “nuclear power is going to have to see a substantial resurgence.”
Moniz was speaking on May 19 at the “Summit on Improving the Economics of America’s Nuclear Power Plants.” He provided opening remarks, framing the challenges facing the nuclear power industry, but not offering a remedy for the problems.
Economics Are Challenging Nuclear Power
“I think the challenge is very clear,” Moniz said. “With the economic challenges facing certainly some of our nuclear plants, we’re seeing—as you well know—some closures before license expirations. We’re seeing the prospect of even more. The importance of incentivizing continued operation, I think, is very clear, but the solutions are less clear.”
Moniz noted that nuclear power accounts for roughly 60% of the U.S.’s zero-carbon generation. As such, he suggested that it is hugely important in the country’s quest to meet carbon reduction goals by 2030 and beyond.
When Capital cost of installation, fuel costs, maintenance and all operational costs are considered, here is one estimate of power generation costs from new generation technologies.
As you can see, the lowest costs are for conventional coal and natural gas generation. Nuclear power generation reductions, such as premature nuclear plant closings is an unexpected consequence of the “Green Energy” policies. This trend, in my opinion, is contributing to the De-Industrialization and weakening of America’s productive capacity.
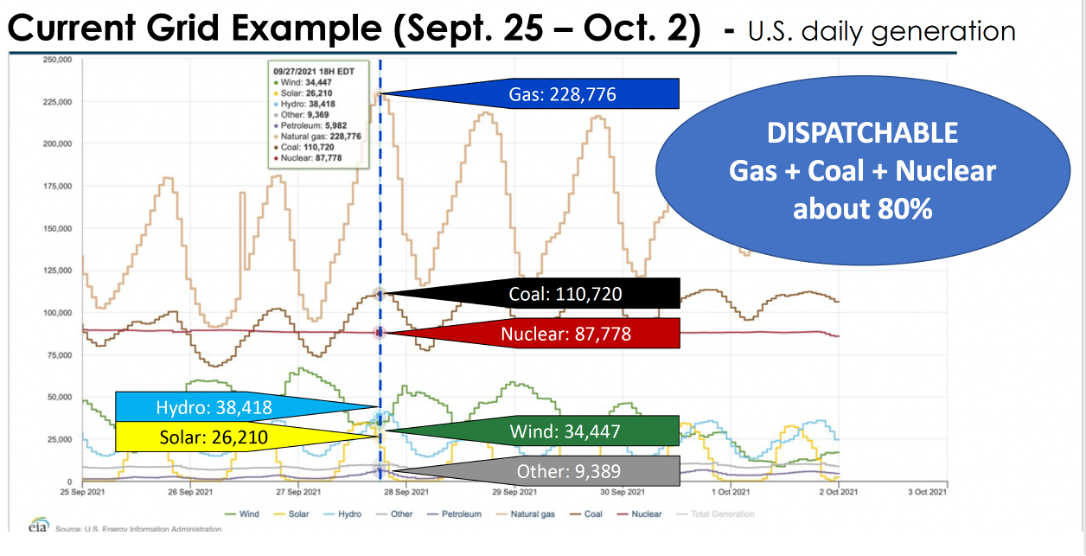
- What are some of the Issues of Drastically Swinging the Load of Large Coal and Nuclear Power Plants? Reliability of electric power supplies is important to any advanced economy. The issues of reliability and cost is not explained by the news media or by fair public service education by the government. There are disadvantages and risks of forcing green renewable power onto the Electric Grid. Green, carbon free power sounds good but what are some of the hidden costs and challenges? Well, here is a challenge that only electric utility engineers and people close to the industry are aware. That is the fact that when renewable power is forced onto the Grid, the backup power (coal, nuclear and natural gas) must be backed down. Imagine a huge generating unit of say 500 MW running on coal fuel and stable. As the sun comes up or the wind starts to blow the wind generators, the power is forced onto the grid and the load must be immediately reduced to minimum. It may not seem like a big deal to those who have not had power plant operation experiences but a large coal plant usually will take hours to startup and increase load to maximum. Safely shutting down should be a matter of hours to gradually reduce the load and take the equipment out of service. In the real world of forced renewables here is the actual impact of the forcing of solar or wind on the California Independent System Operator:
In this example, as the sun went down 13,000 MW needed to be started up within three hours to replace that power generation loss. This can be done with fast starting natural gas turbines. It is very difficult to do this with the existing coal and nuclear plants that carry most of the load and stabilize the frequency and voltage of the Grid.
From my personal experiences about six years ago in Nevada, we were working at a small coal plant near Las Vegas which had total generation capacity of about 600 MW. The Renewable Power Portfolio laws in Nevada are similar to Pennsylvania and tax incentives were given to encourage the installation of Solar panels by home owners and commercial locations. As the sun came up in the morning a near immediate reduction in power demand was seen on the system. The 600 MW of solar power was equivalent to the entire output of the coal plant. At the end of the day when the sun set, there was a similar sudden reduction in power production by the solar panels requiring that the power plant be ramped up.
Now when we get industrial sized batteries and inverters to cover these swings it will likely be handled with new technologies of storage. But, until then, the quality of power including frequency, VAR’s, voltage and Grid balance is a challenge. High capacity storage is decades away, in my view. Electric Grid voltage and frequency stability is better with today’s technology by having massive conventional nuclear and coal plants stabilizing the grid.
The sudden drastic increase in natural gas generation has mitigated the effects of Renewable power intermittency. The Shale Gas Revolution was not planned ten years ago. Inexpensive and abundant natural gas came on us not through good energy policy planning but by Free Markets and American ingenuity.
Likewise, the current reasonable cost of electricity is not due to “Free Power” from the sun and wind. The reason power costs are level is primarily because of low cost natural gas. Other contributing factors are excessive generation capacity due to Industrial Power reductions (less manufacturing) and existing nuclear plants that have a low power generation cost. Remember the old STP Oil Treatment ad where the statement is made, “Pay me now or pay me later” It is an appropriate phrase for forcing green energy on the grid. America will eventually pay a high price for these Ideologically driven policies.
- What About the Cost of Producing Electricity?
Most of the production cost of a coal or natural gas plant production is fuel. In round numbers about 80% of the cost to produce electricity in a coal or gas plant is for fuel. Nuclear plants have a high Capital cost and low fuel cost. Renewable power is much higher cost production and to be competitive it is given subsidies.
For example, here are two charts that show the cost of European electricity prices and how these compare to the U.S.A. electricity costs.
The European experiences with shutting down nuclear power plants and forcing green energy has come at a high cost. It would be helpful if American Regulators would study the results of green policies in Europe and elsewhere in the world.
The lowest cost generation is nuclear, coal and natural gas used in Thermal Power Plants as shown in the preceding graphs from the Nuclear Energy Institute and the Institute for Energy Research (IER).
Here is a map of the U.S.A. which shows power costs by state and the percentage of coal generation. This is from the National Mining Association website. NMA.org
Cost Per kWh & Percent of
Coal Power Sector Generation
Sources: Energy Information Administration, Electric Power Monthly, March 2016 (2015 prelim. data); WGL Energy Services, District of Columbia (2015); California Energy Commission (2014 latest available); Washington State Department of Commerce (2014 latest available); Idaho Power (2014 latest available). 2015 data are preliminary.
- Summary of How We Got into this Mess and What Can Be Done to Correct it?
The reasons we have such a mess of our energy and environmental policies are many. There is ample blame to go around and one the main reasons has been the natural gas “Boom” that has created abundant supplies of natural gas which have driven natural gas power generation prices downward. This is good for America. Combined with the natural gas boom has been tax subsidies or “Production Tax Credits” for Renewable Power from Biomass, Wind and Solar generation. “Green Power Only” is very harmful and not good for America’s long term interests.
The impact of all of these factors together have created unintended consequences of causing perfectly good, well maintained, safe and carbon free nuclear plants to become economically uncompetitive. Two Exelon Plants have publicly announced they will shut down in 2017. These are the Illinois nuclear plants “Clinton and Quad Cities”. The Three Mile Island plant has been discussed as a possible for shutdown due to current economic conditions. So has the Byron Nuclear plant been discussed as being at risk. To those of us who have been involved in the electric generation industry for decades and understand the long term consequences of these shutdowns, we are concerned for America.
My list of reasons why we have gotten into this mess follows.
Ten Regulatory components of why we have such an energy and environmental rules mess:
- Regulations to force “Green Energy” on the public.
- Subsidies of green energy with tax dollars
- News Media indoctrination of green energy as being the only way to go by the government. Driven by influential persons and groups who basically follow an Ideological “Green Religion”
- Use of Federal Agencies to spread biased information on science. NASA, NOAA, Dept. of State, Dept. of the Interior, The Office of the President,
- Public education at all levels, including College level, has been incentivized to come on board with the greens to push the renewable agenda by University Grants and Federal Funding. AT least two states (Washington and California) have implemented book destruction if the textbooks do not conform to “Green Policies”
- Large corporations, especially Utilities have accepted the push for solar and wind. Why not? They will get compensated just as well by building wind towers and solar farms as with building new coal or nuclear plants. Less risk, good payback. Why fight for right? There are at least two ex CEO’s of major US Electric Utilities that are examples of “Green Ideologues”. Two I know of are thankfully, retired. Both are leftist lawyers. Both lobbied for more green subsidies and a carbon tax. In the case of one Utility that has 17 nuclear power plants, the green subsidies have back-fired on his plan to make carbon free nuclear plants attractive. It was not only the pro-renewable energy policies that is causing problems for nuclear, it is also abundant and inexpensive natural gas generation as is covered below.
- Unexpected as all of the “Green Push” was going on came the outstanding success and innovation of Hydraulic Fracturing and enormous amounts of natural gas flooding the markets and causing prices to drop sharply. Ten years ago few people expected natural gas production in the U.S.A. to reach the levels it went to. Prices to drop to less than coal in $/million Btu’s
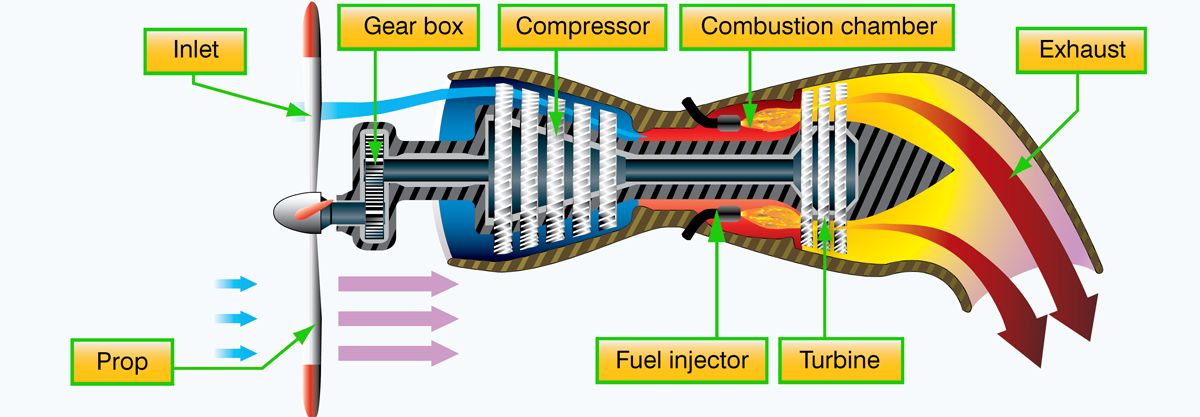
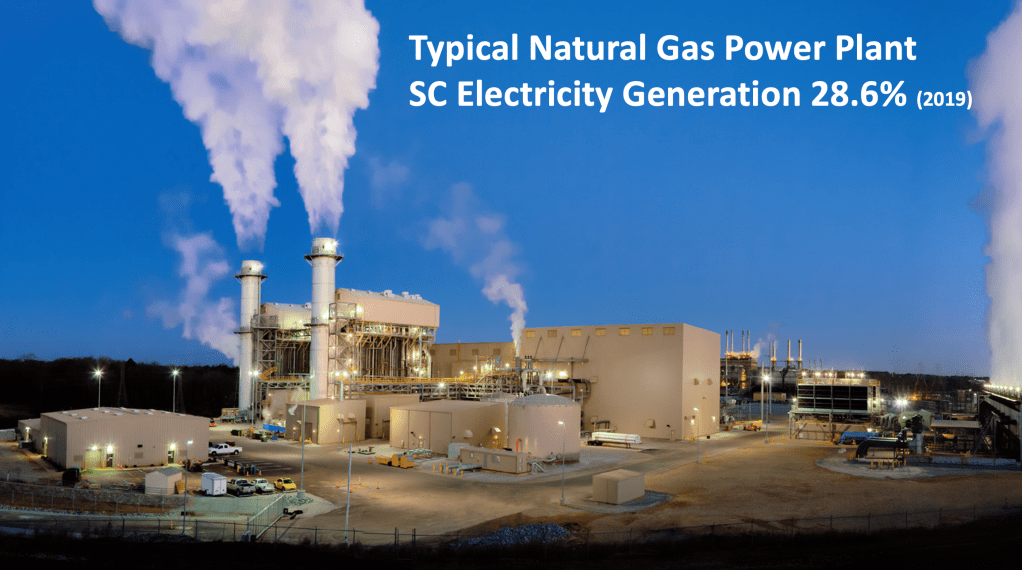
- High Efficiency natural gas generating plants that use Gas Turbines with heat recovery and a steam turbine topping cycle. These plants called Gas Turbine, Combined Cycle are far more efficient than coal plants. G-E, Siemens and Mitsubishi and more manufacturers around the world, build these plant components like they produce jet engines…assembly line style. Low cost and manufacturing that can be done anywhere from Charlotte to Hanoi to China… The components for one of the G-E GTCC plants that I am familiar with, were manufactured in locations all over the world.
- American manufacturing has declined, especially energy intensive primary metals manufacture like aluminum, steel and copper. This freed up enormous amounts of power generation once needed 24/7 for industry to be available for commercial malls and residential. ALCOA’s dams in Stanly County is an example. The 100 MW of ALCOA Hydro is double the 50 MW used by the city of Albemarle (population about 20,000) on the highest demand day of the year. Worse yet, industry used to use power at night that flattened the load demand. Now we have sharp swings of load demand from high to low and large coal or nuclear plants cannot be run from 10% to 100% load like a gas turbine can be. This gives gas plants another advantage of being fast to respond to load changes.
- Then there is the carbon hating mainstream media in my area the most biased are CBS 60 Minutes and the Charlotte Observer which have hyped up coal ash concerns when the public health issues are not near as bad as reported.
My recommendations for the future are to do whatever is necessary to keep a “Balanced Portfolio” of electricity generating plants that use Coal, Natural Gas, Nuclear and Renewable power.
I have referenced a report by the National Coal Council which prepared a report following the 2014 “Polar Vortex”. The state of Pennsylvania during that extreme cold period was importing 2,000 MW from the Midwest. Luckily, the transmission lines remained capable of keeping power reliable over that long distance. Should a similar extreme cold or extreme heat weather event come to pass in 2017, we may face the true prospect of rolling Blackouts or Brownouts. Why? Because over 300 coal plants and at least five nuclear plants that were operating in 2014 are not likely to be operable in 2017. Concerning electricity prices of the future, it is my prediction that when natural gas supplies and demand come closer in alignment, the price of natural gas will increase to levels comparable to the world markets. The cost of electricity production from thermal plants is about 80% fuel cost. So, if natural gas prices rise sharply, so will electricity production prices. It is the cost escalation of electricity from over regulation that I fear will create more problems for American manufacturing competitiveness in the world markets. One of the “Root Causes” of escalating electricity prices will be Federal Regulations and the Renewable Power Standards.
I hope this presentation helps you understand where our electricity and energy comes from and some of the complicated policies that create uncertainty for the future. I would point out the National Coal Council Report of 2014 which reported on the near “Blackouts” that we were perilously close to during the Polar Vortex of January 2014. Extreme weather events such as this, will be harder to handle with large coal and nuclear plants shutdown. I have attached references and links for further research. If you only read or peruse one of the listed references, I suggest that you refer to # 34 the National Coal Council Report of “the Value of the Existing Coal Fleet”. Read about the “Polar Vortex” of January 2014 and the many reliability issues that were compounded from freezing lines, gas pipeline choking, transmission line limitations and absence of Renewable power during a time of extreme demand. Next winter could be a “Perfect Storm” for Blackouts if extreme cold weather recurs, such as it did during the 2014 Polar Vortex. In my opinion, America’s green energy and environmental policies have set us up for some painful and expensive experiences that will be harmful to our Nation’s economic recovery as well as energy security. Current complicated Energy and environmental regulations have contributed to the decline of American manufacturing, a decline of middle class American jobs and weakened National Security. I hope the foregoing information and references below are helpful to you.
Prepared by,
Richard F. Storm, PE, CEM
Richard.storm@stormeng.com
Dick Storm
55 Headlands Drive
Hilton Head Island, SC 29926
References and materials for Further Reading and Research:
- Competitive Enterprise Institute, 10,000 Commandments by Wayne Crews: https://cei.org/10KC
- Bureau of Labor Statistics, Manufacturing Employment, May 2016- 12.28 million: http://www.bls.gov/iag/tgs/iag31-33.htm#workforce
- Congressional Research Service, April 2016 Report by Mark Levinson on American and World Manufacturing Statistics and trends: http://fas.org/sgp/crs/misc/R42135.pdf
- Congressional Research Service, Rare Earth Materials for National Defense and the concern of China’s dominance of control of such elements: http://fas.org/sgp/crs/natsec/R41744.pdf
- International Aluminum Association http://www.world-aluminium.org/statistics/#linegraph
- Coalition for a Prosperous America web site regarding “Fair Trade” http://www.prosperousamerica.org/issues/
- San Francisco-Oakland Bay Bridge, Made in China: http://www.foxnews.com/us/2011/09/20/san-francisco-oakland-bay-bridge-controversially-made-in-china.html
- file:///Users/richardstorm/Documents/Economic%20Reports%20and%20Data/World%20Aluminium%20—%20Primary%20Aluminium%20Production%20by%20IAI%20April%202016.webarchive
- EIA Annual Energy Outlook Early Release, 2016: http://www.eia.gov/forecasts/aeo/er/index.cfm
- National Mining Association: http://nma.org/
- NASA Earth at Night composite photo: https://www.bing.com/search?q=NASA%20Earth%20at%20Night%20Composite%20Photo&form=WNSGPH&qs=SW&cvid=7658c32752fd496e81ad8bbe8714daa2&pq=NASA%20Earth%20at%20Night%20Composite%20Photo&nclid=3B35B6EC4D0EA3B760130707528016F6&ts=1465764031428&elv=AA02IzXQU1LgaghU7RIZjeiQFVSSdMtrt8x5Uh6BVli8
- NETL’s Carl Bauer Presentation, 2006: http://www.netl.doe.gov/publications/proceedings/06/ecc/pdfs/Bauer.pdf
- EIA Sankey Diagram of U.S.A. Energy: https://www.bing.com/images/search?q=eia+sankey+diagram+of+energy+flow%27s+2014&view=detailv2&&id=648140E12879FE50D4B683FACA1BF4ADBDEBB440&selectedIndex=0&ccid=PK1nF1%2fc&simid=608044091700874184&thid=OIP.M3cad67175fdc63d1dc13a942b80af477o0&ajaxhist=0
- S.A. Citizen per Capita Energy Use Figure: Storm Technologies, Inc. Power Point Presentation to Civic Organizations about 2010. Other presentations are available on the Storm Technologies, Inc. website: http://www.stormeng.com
- Nucor Slide of U.S.A. Manufacturing Jobs, from NUCOR Townhall Meeting presentation about 2008. Update of manufacturing jobs in the U.S.A. in 2015 from National Assoc of Manufacturers (NAM)
- Dan DiMicco, CEO NUCOR Steel, Book, “Steeling America’s Future”, A CEO’s call to arms, saving free trade. Vox Populi Publishers, LLC , 2007
- World Steel Organization: Facts on China Steel Production http://www.worldsteel.org/dms/internetDocumentList/bookshop/2016/WSiF-2016/document/WSiF%202016.pdf
- Wall Street Journal article on China production keeping a lid on aluminum prices: http://www.wsj.com/articles/rising-chinese-production-keeps-lid-on-aluminum-prices-1447186082
- New York Times article on Aluminum Dumping by China: http://www.nytimes.com/2016/04/19/business/international/china-aluminum-trade-tariff.html?_r=0
- Metal Miner Blog articles on Steel and Aluminum dumping by China: https://agmetalminer.com/category/anti-dumping/
- Institute for Energy Research (IER) http://instituteforenergyresearch.org/
- Pennsylvania Energy Quick Facts: EIA
- Top Ten Generating Plants in U.S.A. May 23, 2016 U.S. Chamber of Commerce: https://www.uschamber.com/above-the-fold/these-10-power-plants-produce-the-most-electricity-america
- Coal Plant Shutdowns: NMA.org
- Exelon to Shutdown Two Nuclear Power Plants in Illinois: http://www.reuters.com/article/usa-nuclear-exelon-idUSL1N18U1L6
- Power Magazine, June 7, 2016: Exelon Byron and Three Mile Island Plants also at Risk: http://www.powermag.com/byron-three-mile-island-nuclear-plants-at-risk-exelon-says/?printmode=1
- S. Department of Energy Remarks, POWER Magazine, May 20, 2016: http://www.powermag.com/moniz-incentives-needed-to-alleviate-nuclear-power-woes/
- Grid Parity for Renewables: An Empty Concept (Parts 1 & 2) Mark Febrizio, March 21, 2016, IER: http://instituteforenergyresearch.org/grid-parity-meaningless-concept/
- Gas and Solar Comparison Costs: Blog “Watts up with That” by Blog owner, Anthony Watts
- S. Electricity Generation Production Costs: Nuclear Energy Institute: http://www.nei.org/Knowledge-Center/Nuclear-Statistics/Costs-Fuel,-Operation,-Waste-Disposal-Life-Cycle/US-Electricity-Production-Costs
- California System Operator Demand Problem with Renewables, “Duck Curve” page 68, Donn Dears book: “Nothing to Fear, A Bright Future for Fossil Fuels”
- Donn Dears Blog: “Power For the U.S.A.” Donn is a retired G-E Executive engineer with outstanding credentials and common sense: http://donndears.com/
- World Electricity Price Comparisons: http://ec.europa.eu/eurostat/statistics-explained/index.php/Energy_price_statistics
- The National Coal Council May 2014 Report: “The Value of the Existing Coal Fleet”: http://www.nationalcoalcouncil.org/reports/1407/NCCValueExistingCoalFleet.pdf
- A good read of a speech by the father of Nuclear Power, Hyman G. Rickover’s speech to the medical association of Minnesota on peak oil and the future of energy and atoms for peace, 1957: A very prescient genius. Worth the read: http://large.stanford.edu/courses/2011/ph240/klein1/docs/rickover.pdf
- Heritage Economic Freedom http://dailysignal.com/2016/05/16/why-were-falling-behind-in-world-trade/?utm_source=TDS_Email&utm_medium=email&utm_campaign=CapitolBell&mkt_tok=eyJpIjoiWXpKa01tTTFaalE0TjJKayIsInQiOiI5ZXNkMDZzd1crWWZXMGVmR05UWks2QU9HMXkxN0FRUzRMaE9vRlhGZkRVenIyYlQrdG5jY0pTOVVDVHA0UEpYR0dmQ2Q3TGQxRlwvNklxSk5oOEpFQVd1QXh0M3FaZHNHaldxd1RvMmdYZU09In0%3D
- Listing of Countries by Economic Freedom: http://www.heritage.org/index/ranking