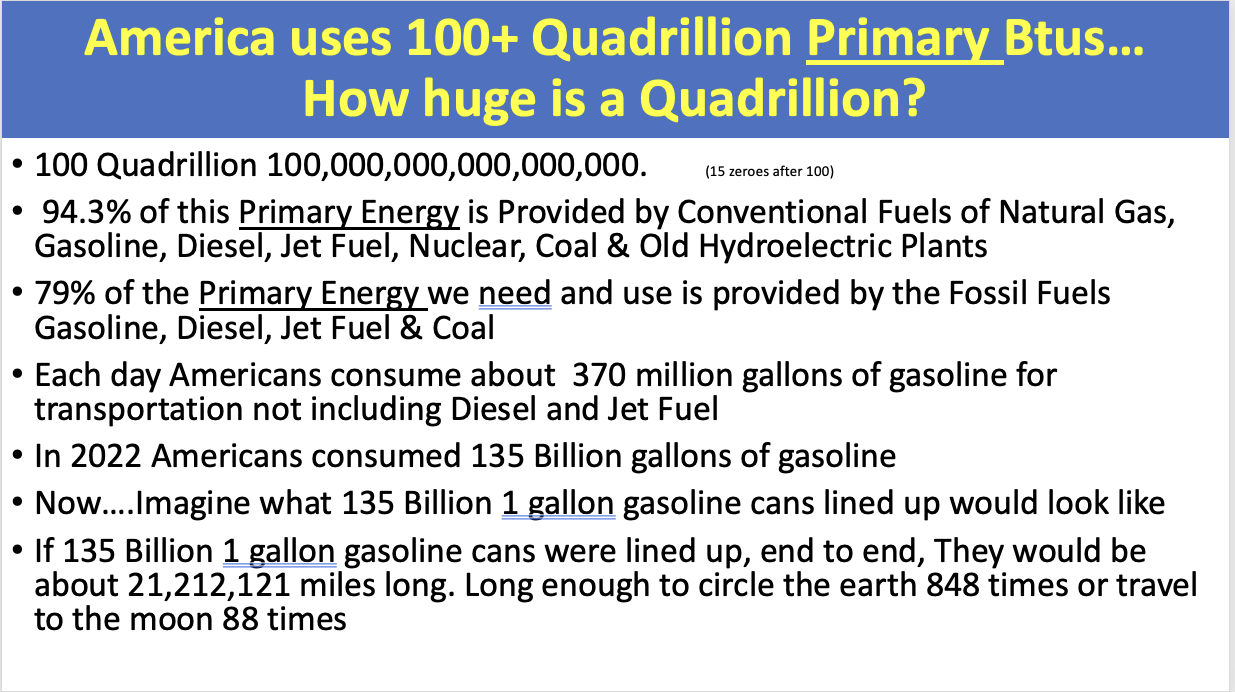
America uses right at 100 Quadrillion Btus of Primary energy each year.(12 &13) We have used right at this amount of total Primary Energy for over 20 years. The entire world uses about 600 Quadrillion BTUs of total Primary energy. The energy systems to provide this indispensable primary energy are beyond huge and so large and complicated that it is difficult to describe in words. In this post, I will attempt to demystify the immensity of the energy systems we depend on.
Energy on Which We Depend
Remember the last hurricane or winter storm that killed your power and made gasoline short in supply? It seems to take a traumatic experience such as severe weather for us to appreciate the importance of energy. Whether for heating in the winter, for gasoline to take a road trip, cooking hamburgers on the BBQ or cooling our homes in the heat of summer. Like many things in life, “Energy is not missed until it is unavailable”.
Dr. Robert Hargraves wrote an excellent article entitled, “Energy IS the Economy” for Grid Brief in Nov. 2022. (48) In the Developed world affordable, reliable and affordable energy is vital to sustaining Industrial production, commerce and our economy. Energy is a prerequisite for almost anything and everything we do or have come to depend on.
315 Million BTUs/Person/Year
Each American uses on average, about 315 million Btus (BTU=British Thermal Unit) of Primary Energy each year. This averages about 863,000 Btus per capita, each day. The purpose of this article is to explain the importance of “Energy” in our everyday activities. Folks that are not involved as employees in the energy business may not have a comfortable understanding of the relationship of Primary Energy in BTUs (British Thermal Units) and work. So, let’s take a look at the fundamental energy equivalence of BTUs and work. One Btu=778 Foot Pounds of work. What is a BTU? It takes 1 BTU to raise one pound of water 1 degrees F.
Example: A pint of water is about one pound. So visualize warming a pint of water from 32 degrees F. to 212 degrees F., (That will require 180 BTUs. 212-32=180)
Another equivalent to keep in mind; One kWh of electricity is 3,413 BTUs. These equivalents are at 100% conversion efficiency. Since our grandparents days, we have come to use and depend on a lot of thermal energy to replace animal and human muscle power. The replacement of muscle power with heat engines fueled by energy has served Humanity very well over the last 130 years. Both in heat engines for transportation and for Bulk Electric Power Generation by Electric Utilities. Replacement of muscle power with thermal energy has come a long way since my grandparents days.

This commentary is my attempt to explain the vastness of the energy systems that have created the high quality of life on which we depend and take for granted, thanks to heat engines and thermal power plants.
Why BTU’s? (British Thermal Units)
Government energy statistics are expressed in BTUs, and the BTU equivalent of wind and solar are calculated and converted to BTUs. Example; One kWh of wind or solar is equivalent to 3,413 BTU. International journals and reports may use other energy units, such as kWh’s or Joule’s. In the U.S. our EIA (Energy Information Administration) uses BTUs as the unit of energy for data reporting.
Dr. Lars Shernikau has published an excellent article explaining Primary Energy in his article, “Primary Energy is Still King” (34) I recommend reading this, because he has done an excellent explanation to provide an understanding of primary energy and renewables. Here.
100 Quadrillion BTUs/Year
Coal, oil, natural gas, nuclear, wind and solar are included in the LLNL chart below to total 100.3 Quadrillion BTUs of Primary Energy for the year 2022. It is my hope that this post will help the reader to get your arms around the vastness of our supplies of Primary energy and what it does for us. A reminder: Electricity is Secondary Energy and Primary Energy is required to generate Electricity. Each Kilowatt Hour requires 3,413 BTUs at 100% efficiency. The most efficient GTCC generating plants are about 60% efficient so that is about 5,690 BTUs of input to the gas turbine at steady loads at the most efficient load point to produce one kWh of electricity. A deeper dive into Heat Engines and heat rates are topics for another time. Suffice it to say, we use a lot of primary energy for electricity generation, a little more than a third (37.7 %) of the total primary energy America consumes.

Transportation, Industrial, Residential and Commercial Energy Demand
We also use a lot of primary energy for transportation, food production, residential heating, cooking, commercial and industrial production. Long story short….reasonable cost, abundant and reliable energy powers our high quality of life.

Examples and Reminders of the Immensity of the Energy Systems on which we Depend
The U.S. Electric Grid has been described by the Smithsonian (and others) as “the Largest Machine Ever Built“, here.
The quantity of motor fuels used each year was described in 2007 by the National Petroleum Council chairman, Lee Raymond,
“As enough to fill 150 billion one gallon cans that if placed end to end, would circle the earth 1,000 times”(2)
That was 2007. In the year 2022 motor fuels increased and the U.S. used 209 billion gallons of gasoline and Diesel fuel.(3,4) Gasoline and Diesel are forms of Primary energy. That is a 39% increase of motor fuels in 15 years.
America uses right at 20 million barrels of oil each day. The total petroleum use in Quadrillion BTUs energy is about 36 Quadrillion Btus/year. This is about 36% of the Primary Energy we use. Below is a photo of me and the 48″ Alyeska (Alaska) Pipeline. This 48″ line is above ground to protect the frozen Tundra. The Alyeska Pipeline at its peak flow delivered about 2 million barrels per day of crude oil from the north slope of Alaska. It would take ten pipelines the size of the 48″ Alaska Pipeline to provide the petroleum needed to supply 36% of America’s total Primary Energy demand and needs.
Perhaps you can visualize in your mind, ten of these lined up side by side easier than you can imagine 150 Billion one gallon gasoline cans circling the earth 1,000 times? That is how much crude oil we need and depend on to provide a little over one third of our Primary energy needs. In addition to transportation energy needs, petroleum is also used as the feedstock for plastics and thousands of other products. Ron Stein has written much on the thousands of products derived from petroleum. Here is one of his excellent articles, “Are Politicians Oblivious to the Need for Crude Oil, or are they Intentionally Sending Us Back to the 18th Century?“.(49)

How About Coal. Is Coal Still Important?
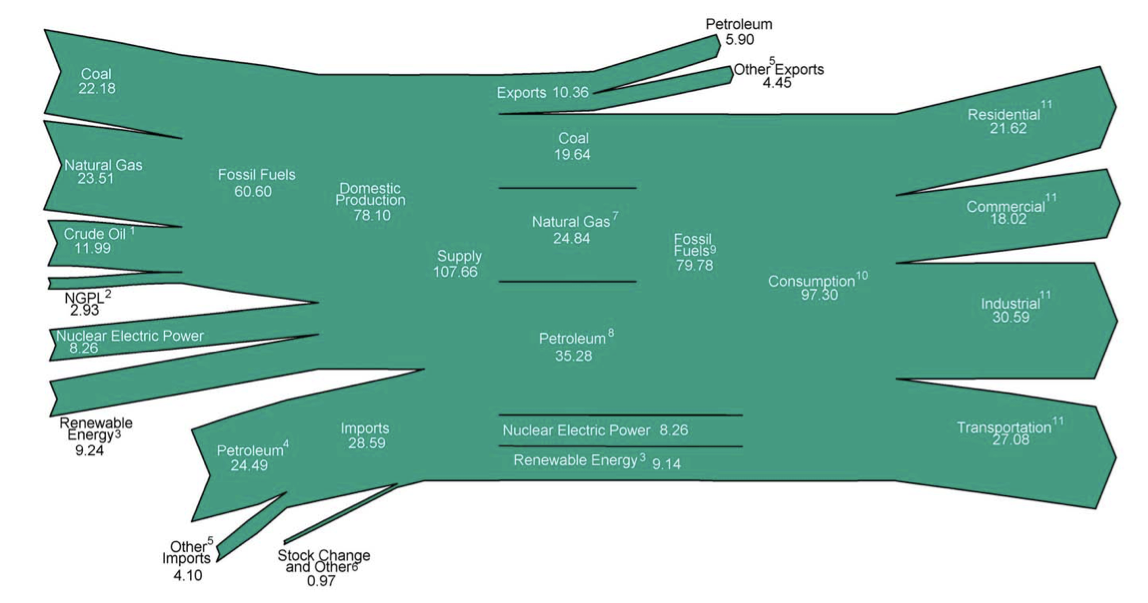
For electricity generation Coal provided over 50% of the primary energy to generate U.S. electricity up till about 2011. In 2011 about 22% of America’s Primary Energy was provided by coal. (This is a fact). In 2011 the total Primary energy use was 107 Quadrillion BTUs and coal provided 21% of the total. Since 2012 much of the coal power generation fuel has been replaced by natural gas. Here below, is the EIA Total Energy Flow Chart for 2011. This supports my statement that America has depended on about 100 Quadrillion BTUs of energy for decades. In the 2011 example, Total Primary Energy was 107 Quadrillion BTUs.
Today coal fuel provides about 20% of the fuel used for electric power generation. To be exact, coal provided 9.9 % of the total primary energy in 2022. Coal use provided the fuel for about 20% of the electricity generation in that year.
Primary & Secondary Energy
Please note: When I discuss Primary Energy and Electricity generation percentages, it may seem confusing. Both statements above are correct. Coal provides fuel for 20% of our electricity generation and coal provides 9.9% of our total Primary Energy. The apparent discrepancy is the reporting of total Primary Energy and Total Fuel used for electric power generation. Electricity is important and it represents the consumption of 37.7% of total primary energy, including renewables. The LLNL chart above shows the other major consumption of energy for Industrial, Commercial and Residential uses. The difference between Primary Energy and Secondary Energy is important, but this is rarely explained when the term, “Electrify Everything” is used.
Coal Fuel for Electricity Generation
Now let’s get back to the importance of coal. Today about 10% (I rounded 9.91% to 10) of the U.S. primary energy is provided by coal. This is about 10 Quadrillion BTUs. The photo below is a coal car which holds 100 tons of coal. The length of the coal car, coupling to coupling is about 55 feet. The heat content of 100 tons of western Powder River Basin coal at 9,000 BTU’s per pound is about 1,800 million Btus per coal car. Dividing 1,800 million Btus into 10 Quadrillion results in a train of coal cars about 52,083 miles long. Long enough to circle the earth two times. That is just the coal used in the U.S.A. in 2022 and we used more than twice that much in 2011. (see 2011 Sankey Diagram above)


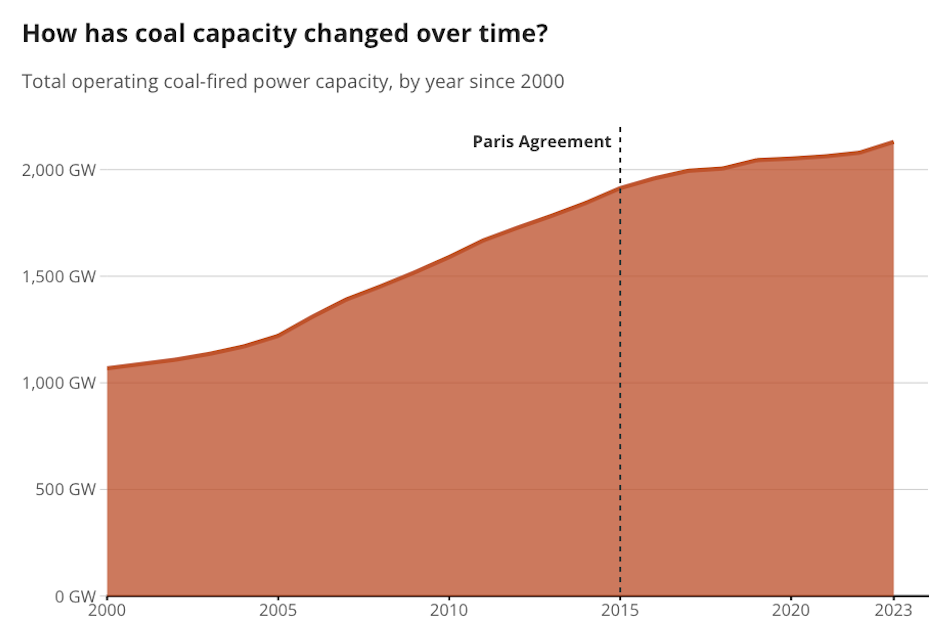
Again, to supply 10 Quadrillion Btus of coal for electricity generation in the U.S. the coal would fill a train that would circle the earth two times. Just as a matter of reference, the amount of coal used in China is more than five times the coal consumed in the U.S.A. According to World O Meter, China uses about 4.4 Billion metric tons/year. According to the IEA, Coal was the primary energy used to provide 60% of China’s electricity in 2022. (22) Coal is the top fuel for electricity generation in most Developing countries and including China and India. As shown below, in 2023 the world used an all time record of coal use.
On January 6, 2024, here is a screen shot of the MISO (Midcontinent Independent System Operator) Energy RTO. Note that although coal is not believed to be needed by government Bureaucrats, the MSM and environmental activists, it is providing almost 40% of the electricity being used this day at 0600. A post on the Count on Coal Blog is aptly entitled, “2024 A Critical Year for Grid Reliability” which provides another take on the importance of coal (20). Also POWER Magazine Commentary, “EPA’s No-Win Rule for the Electricity Grid” July 2nd, 2024. (50)
Here is an update from Jan. 2024 on coal power in the Midwest from the website of MISOEnergy.org.

What does the rest of the world understand that we do not? More coal was used in 2023 than all of history.
Coal Remains Important in the U.S.
Coal remains important in America. The Count on Coal Blog offers many anecdotes, data and environmental policy assessments. (20)
Especially in winter, because snow storms will likely be even more difficult for electric Utilities to keep up with demand. In addition to the problems of snow blocking solar collectors, ice on wind turbine blades make them less reliable as well. It is worth recalling the winter storm in Feb. 2021 which created Blackouts in Texas and a near collapse of the entire ERCOT Grid. Over 246 people were killed during that storm. Many as a result of the rolling Blackouts. I wrote my views on the missing 6,000 MW of coal plant capacity that had recently been shut down, on this blog. (51)
How About Natural Gas?
How do we visualize 33 Quadrillion Btus in natural gas? About 1/3 of America’s Primary energy is provided by natural gas and about 50% of our electricity is expected to be generated from natural gas in 2024. So, to get an idea of the enormity of the importance of natural gas, let’s try looking at pipelines providing natural gas across the U.S.A. Here is the EIA map of Interstate natural gas pipelines in the U.S.
Regulations and Environmental NGO’s hate pipelines and do all that they can to restrict their expansion, but that is a story for another day. (21) Suffice it to say, natural gas is very, very important to America in 2024. It is projected that in 2024 natural gas will provide the fuel for about 50% of all U.S. electric power production.

It is difficult to visualize the enormity of the natural gas flows from the map. Also difficult to visualize 33 Quadrillion BTU of invisible natural gas flowing through a pipe. So, let’s try this, a photo of an LNG Tanker. Natural gas stored as a liquid at about minus 263 degrees F.
Liquified LNG is about 1/600th the volume of the gas as used for power generation or cooking.

This LNG Tanker holds about 4,770,000 cubic feet of natural gas, when vaporized for use. This is equivalent to about 5 trillion Btus. This equates to about the same energy equivalence of three Unit Trains, each comprised of 100 coal cars.
To visualize 33 Quadrillion Btus, picture 6,000 ships such as the one shown above.
So, how do you visualize an armada of 6,000 ships like that shown above? Try this. If 6,000 ships, each 950 feet long were placed in a line, stem to stern touching, they would reach over 1,070 miles. So a continuous line of ships from just south of Philadelphia in the Delaware Bay would reach to Miami. This would represent the quantity of natural gas, stored in super dense liquid form used in one year. This line of ships would be equivalent to the natural gas burned in the U.S. in 2022. In 2024 gas consumption will be even greater.
The latest LNG ships are larger at about 175,000 cubic meter capacity, such as the ship Pan American shown below.

Energy use is directly related to economic output and the quality of life we enjoy. Economic prosperity is another subject, so let’s stick to the immensity of the quantity of energy that we need and depend on. If you are interested in the relationship of energy and economic prosperity, there are numerous references below. ( 5, 6, 7, 8, 9, 10, 11)
Getting back to electricity and the largest machine ever built. Yes, the Electric Grid is huge and complicated. However, huge as it is, the Electric Grid uses about one third of the total primary energy used in the U.S. The other two thirds is used for transportation, Industrial production, heating, cooling, cooking and commercial uses. “Electrifying Everything” as promoted by numerous non technically trained politicians, NGO’s, wealthy Philanthropists and well intentioned corporations, is simply not possible.
Paraphrasing Lee Raymond’s comments in 2007,
“It will take an enormous effort and a lot of time to replace the current energy systems”(2)
Take a look/listen to Lee Raymond for about two minutes. Start at minute # 8 here.
Primary Energy Use of the U.S. 100 Quadrillion Btus/Year
The Lawrence Livermore National Laboratory Sankey Diagram of U.S. Energy Flows for the year 2022 is copied below. The energy use is reported in British Thermal Units so that one unit of energy can express all common forms of energy that we use. The energy sources reported are wind, solar, petroleum, natural gas, nuclear, hydroelectric, Biomass and Geothermal. Interestingly to me is the fact that America has used a steady flow of about 100 Quadrillion Btus of energy (+/- 10 Quads) for about the last 25 years. This in spite of population growth and increased electrification of nearly everything we do. The chart below shows the flows of sources of PRIMARY Energy.
Hydrogen is not on the chart but there is a lot of talk about the future of hydrogen as a fuel. Let me just state for now that hydrogen, like electricity, is another form of Secondary Energy. It takes about 3 or 4 units of Primary Energy to produce one unit of hydrogen energy.

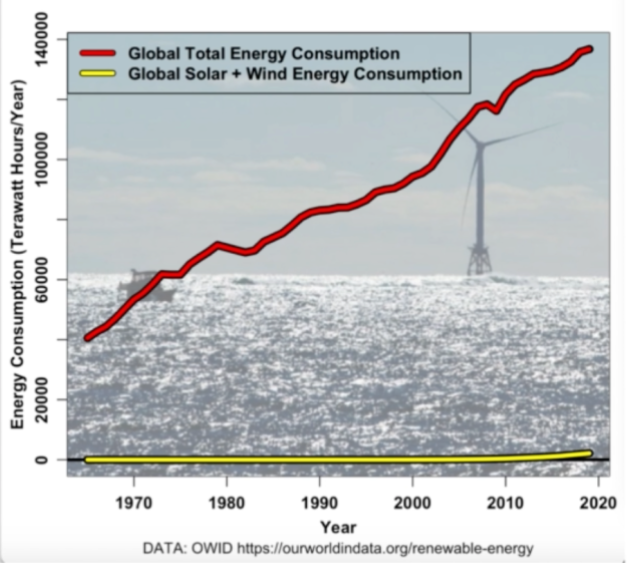
The next graph is also from the U.S. Department of Energy and it shows the total energy use by fuel since the Founding of America. The key point is: Over 90% of the Primary energy we depend on each day and use, is sourced from conventional sources of gasoline, Diesel, natural gas, Jet Fuel, coal, nuclear, Hydroelectric and Biomass. Only 5.71% of the Total Energy used in 2022 came from wind and solar.

Electricity and the Grid, “The Largest Machine in the World”
The following is copied from a post by Bloomberg and I give full credit to Bloomberg and the author. It is well stated and I thought apropos to explain the Immensity of the electric grid. From Bloomberg and to be fair, this refers to the electric grids all over the world, not only the U.S.A. …..
“Bloomberg 2 May 2023 Merryn Somerset Webb There is something attractive about things that are complicated, boring and expensive. What is the biggest thing that mankind has ever built? All the obvious answers to this pub-quiz question are wrong. It is not the Great Wall of China, nor the Three Gorges Dam, nor the Large Hadron Collider. It is also not Terminal 3 at Beijing Capital International Airport. In fact, the feat belongs to something rather prosaic: the global electricity grid. The total length of the distribution grid globally is estimated to be some 56 million miles, though it’s hard to be sure. The circumference of the world is an around 24,900 miles. Our electricity transmission lines can g o around our world 2,250 times over. So it’s big — very big. It’s also in an awful lot of trouble. ……So next time someone from the Green Party or government tells you that the energy transition is cost-free, ignore them. It most definitely is not. You can’t double the size of the biggest thing in the world for nothing.” Emphasis on the last line by me.
However, because the IRA codifies the “Green New Deal” we cannot exactly ignore government as we watch them destroy the largest machine ever built. I wrote about the Great State of Hawaii a few years ago. Hawaii adopted the “Green New Deal” several years before Congress passed the IRA. Unlike California or other states, Hawaii is an “Energy Island”. Therefore, the consequences of the Green New Deal are experienced faster. Take a look at what I wrote a few years ago and check the current electricity costs in Hawaii. Also, an update here.(53) Then you decide how inexpensive renewables are. (52)
Conclusions
Replacing the energy of 100 Quadrillion BTUs with wind and solar is impossible. The foregoing described the immensity of petroleum use and the electric grid. Also, the Lawrence Livermore Laboratory, Sankey Diagrams show energy flows for the years 2011 and 2022. In the 2022 LLNL diagram, wind and solar provide less than 6% of the primary energy used. This meager, less than 6% contribution of intermittent power is after decades of subsidies.
All fuels, including coal should be included in America’s energy mix. Why? For many reasons, here are four; 1. The U.S. is the Saudi Arabia of coal and we have more high quality fuel within our borders than any other country, 2. A 60 day coal pile on the plant site is the best proven energy storage known, 3. Coal plants provide Dispatchable Bulk Power and can run 24/7 300 plus days per year and 4. Coal generated power is affordable. Just check the electricity prices of states that generate most of their power from coal and compare to the electricity rates in Hawaii and California.(57)
My concern is that we have not built a new clean coal plant since 2013 and the U.S. manufacturing supply chain is threatened. Not only manufacturing facilities, but also including skilled engineers, technicians and welders. The recent history of the decline of the supply-chain for nuclear power plants is an example. In the 1970’s, America had the largest and best manufacturing supply chain for nuclear power plants. Over a period of about 40 years America built nuclear power production capability for about 20% of America’s total electricity production. 1949-1989) Most of the manufacturing that built the robust, reliable and safe nuclear fleet are gone. We should not let this happen to the supply chain for clean coal plants. Remember the names Combustion-Engineering, Westinghouse, Allis-Chalmers, DeLaval, Foster-Wheeler and more…? Thankfully, we still have Babcock & Wilcox, but much downsized from when I worked at B&W in the 1960’s. I wrote on this blog about the Rise and Fall of Nations from the perspective of nuclear power systems manufacturing and some photos of U.S. Reactor and steam generator manufacturing from the 1960’s are included. We can “Hope” for sanity in public education and government Regulations so that some day American manufacturing will be great again. (54)
Energy policy in the U.S. as one well respected energy issues publication author stated, “American Energy Policy is a Mess”.
Worse yet, the average voter has been indoctrinated with misinformation that the Climate has been altered by the burning of fossil fuels and the future of the earth is in peril because of combustion of fossil fuels. The largest scientific hoax in the history of mankind.
Respectfully,
Dick Storm, July 2, 2024
References and for Further Reading & Research
- Smithsonian, “The Largest Machine Ever Built, the U.S. Electric Grid” https://www.smithsonianmag.com/videos/category/history/the-largest-machine-ever-built/
- Lee Raymond at meeting of Council of Foreign Affairs, 2007 on you tube: https://www.youtube.com/watch?v=KYRH97e-nlM
- EIA Gasoline consumption in 2022, about 135.7 Billion gallons: https://www.eia.gov/energyexplained/gasoline/use-of-gasoline.php
- EIA Diesel Fuel Explained, U.S. Production of Diesel Fuel 2022 about 1.75 Billion barrels (73.5 Billion gallons): https://www.eia.gov/energyexplained/diesel-fuel/where-our-diesel-comes-from.php#:~:text=In%202022%2C%20U.S.%20refineries%20produced,barrels%20(60.30%20billion%20gallons).
- Dick Storm Blog post, Net-Zero is Impossible: https://dickstormprobizblog.org/2023/01/12/what-would-it-take-for-net-zero-electricity-generation-by-2050/
- Dick Storm Blog post, Energy and Economic prosperity:
- Dick Storm Blog post, The Rise, Fall and Rise Again of Nations and the relationship of adequate, affordable and reliable energy: https://dickstormprobizblog.org/2023/08/15/the-rise-fall-and-rise-again-of-nations-and-the-realities-of-energy/
- Dick Storm Blog post, Comparison of China and U.S. Energy use: https://dickstormprobizblog.org/2023/01/18/comparison-of-china-energy-electricity-generation-with-u-s-a/
- Dick Storm Blog post, Pillars of Energy and Materials for Modern Civilization: https://dickstormprobizblog.org/2022/07/25/pillars-of-modern-civilization-all-dependent-on-energy/
- Dick Storm Blog post, Energy and Economic Prosperity : https://dickstormprobizblog.org/2022/01/03/energy-and-economic-prosperity/
- Dick Storm blog, Energy, Human Development Index and Economic Prosperity, How it came to be: https://dickstormprobizblog.org/2021/06/22/energy-human-development-index-and-economic-prosperity/
- Dick Storm Blog, 100 Quadrillion BTUs=American Dream, July 2022: https://dickstormprobizblog.org/2022/07/04/american-dream-100-quadrillion-btus/
- Dick Storm Blog, The Importance of Fuel Diversity to Power our Lives and Economy Part 1: https://dickstormprobizblog.org/2023/10/26/the-importance-of-fuel-diversity-to-power-our-economy-and-our-lives-part-1/
- Dick Storm presentation to Cabarrus Rotary Club, Dec. 7, 2023, The Hard Truths of Energy and Electricity” and “Panamax Post, Scoop.it” : https://www.scoop.it/topic/panamaxpost/p/4149909913/2023/12/29/richard-storm-on-linkedin-facing-the-hard-truths-of-energy-electricity-generation
- Bloomberg, Oct. 2014, The American Electric Grid, the Largest Machine in the World”: https://www.bloomberg.com/view/quicktake/u-s-electrical-grid
- Yahoo Finance, “Greasing the World’s Largest Machine, the Electric Grid, by Sonia Aggarwal, Sept. 2014 : https://finance.yahoo.com/news/greasing-electric-grid-worlds-largest-machine-op-ed-150237367.html
- EIA Fuel for electricity generation 60% fossil fuels, 19.7% coal, 39.9% natural gas, 21.3% renewables and 18.2% nuclear: https://www.eia.gov/tools/faqs/faq.php?id=427&t=3
- China Coal Consumption by “WorldOMeter”: https://www.worldometers.info/coal/china-coal/
- Marine Digital, list of 12 largest tanker Ships: https://marine-digital.com/article_top_12_largest_tanker_ships
- Count on Coal Blog, “2024 A Critical Year of Grid Reliability”: https://www.countoncoal.org/2024/01/a-critical-year-for-grid-reliability/
- Bloomberg on the Demise of Gas Pipelines & Difficulty of Building new ones, July 2020: https://www.bloomberg.com/news/articles/2020-07-06/demise-of-gas-project-shows-u-s-pipelines-becoming-unbuildable?embedded-checkout=true
- IEA Energy Report 2022: https://www.iea.org/reports/coal-2023/demand
- Energy Bad Boys, Substack on EPA forcing 5.2 million into Blackouts, May 25, 2024: https://energybadboys.substack.com/p/52-million-americans-will-be-left
- German De-Industrialization post on the “Last Pipe” from Vallourec Factory: https://www.linkedin.com/posts/activity-7112422447580082176-MMm3?utm_source=share&utm_medium=member_desktop
- China’s leader states the importance of oil and coal for prosperity: https://www.linkedin.com/posts/activity-7112059501003829248-5b4Y?utm_source=share&utm_medium=member_desktop
- FERC Summer Assessment, May 2024: https://www.ferc.gov/news-events/news/report-2024-summer-energy-market-and-electric-reliability-assessment?utm_source=www.gridbrief.com&utm_medium=newsletter&utm_campaign=data-center-overload-critical-mineral-supply-energy-grids-in-modern-warfare
- Grid Brief, May 27, 2024, Data Center to Contribute to 2.7% Electricity Growth: https://www.gridbrief.com/p/data-center-overload-critical-mineral-supply-energy-grids-modern-warfare?utm_source=www.gridbrief.com&utm_medium=newsletter&utm_campaign=data-center-overload-critical-mineral-supply-energy-grids-in-modern-warfare
- Capital Research Center on Palestinian Protesters becoming more active in acts of Terror within the U.S. A sobering reminder of the vulnerability of our Grid : https://capitalresearch.org/article/chicago-campus-protestors-announce-terror-campain-against-the-us/?blm_aid=59207
- Global Energy Monitor, Tracker for LNG and Gas Pipelines: https://globalenergymonitor.org/projects/glhttps://globalenergymonitor.org/projects/global-gas-infrastructure-tracker/tracker/obal-gas-infrastructure-tracker/tracker/
- Global Energy Monitor, Coal Plant Tracker: https://globalenergymonitor.org/projects/global-coal-plant-tracker/dashboard/
- EIA Natural Gas Prices, from 2019 to March 2024: https://www.eia.gov/todayinenergy/detail.php?id=62203&src=email
- WUWT on Wind and Solar becoming less viable, June 7, 2024 Master Resource: https://wattsupwiththat.com/2024/06/07/industrial-wind-power-a-depleting-resource/
- Rise and Fall of the U.S. Grid, by Emmett Penney, Foreign Affairs Magazine: https://americanaffairsjournal.org/2022/08/the-rise-and-fall-of-the-american-electrical-grid/?utm_source=substack&utm_medium=email
- Lars Shernikau, An outstanding article on the importance of conventional Primary Energy! “Primary Energy is Still King” : https://unpopular-truth.com/2024/05/24/why-primary-energy-is-still-king/
- DOE-Pathways to Advanced Nuclear Power, June 2024: https://liftoff.energy.gov/advanced-nuclear/
- Our World in Data, Renewable Energy in the World, Charts : https://ourworldindata.org/renewable-energy
- Thomas Shepstone Substack on “What about Coal?” June 20, 2024: https://energysecurityfreedom.substack.com/p/what-about-coal
- ENERGY INSTITUTE 2024 WORLD ENERGY REPORT, Statistical Review, JUNE 2024: https://www.energyinst.org/statistical-review
- Our World in Data, World Primary Energy Use: https://ourworldindata.org/energy-production-consumption
- The Liberal Patriot on the EU Elections, June 2024: https://www.liberalpatriot.com/p/greenlash-is-here
- Isaac Orr Presentation to Dairyland Power on the impact of EPA Regulations, June 22, 2024: https://energybadboys.substack.com/p/nine-slides-from-my-keynote-address
- Indulgences of the 20th Century, K.T. Lynn on “REC’s”, June 14, 2024: https://thejoulethief.substack.com/p/get-rec-ked
- Climate change and the politicization of ESG in the US, ESG Investing: https://www.frontiersin.org/journals/political-science/articles/10.3389/fpos.2024.1332399/full
- Gregory Whitestone on You Tube, Climate Fears Debunked: https://www.youtube.com/watch?v=TcibOFk_ZdU
- LLNL Primary Energy Flow Chart, 2022 for U.S.: https://flowcharts.llnl.gov/sites/flowcharts/files/2023-10/US%20Energy%202022.pdf
- IEA Pathways to Net Zero, Oct. 2023: https://www.iea.org/reports/world-energy-outlook-2023/pathways-for-the-energy-mix
- Our World in Data, Per Capita Energy Use charts: https://ourworldindata.org/energy-mix
- Robert Hargraves article in Grid Brief, Nov. 2022, “Energy IS the Economy”: https://www.gridbrief.com/p/guest-feature-energy-economy
- Ron Stein article, Feb. 2024 in “Your AmericaTV”, entitled, “Are Politicians Oblivious to the Need for Crude Oil, or Are They Intentionally Sending Us Back to the 18th Century?” : https://youramericatv.com/2024/02/are-policymakers-oblivious-to-the-importance-of-crude-oil-or-are-they-intentionally-sending-us-back-to-the-18th-century/
- POWER Magazine Commentary by Michelle Bloodworth of America’s Power, “EPA No Win Rule for the Electricity Grid” July 2, 2024: https://www.powermag.com/blog/epas-no-win-rule-for-the-electricity-grid/?oly_enc_id=3214I3524889A9B
- Texas and Coal Power, 6,000 MW of Coal Power Generation is Missed, Feb. 19, 2021: https://dickstormprobizblog.org/2021/02/19/texas-and-coal-power-6000-mws-of-coal-plant-capacity-is-missed/
- Hawaii, Green New Deal, A Glimpse into the Future, June 3, 2020: https://dickstormprobizblog.org/2020/06/03/hawaii-a-gimpse-into-the-future-of-the-green-new-deal/
- Update on Hawaii’s “Green New Deal” March 2024: https://dickstormprobizblog.org/2024/03/20/hawaii-a-glimpse-into-the-future-of-the-green-new-deal-aka-inflation-reduction-act-here-is-an-update/
- The Rise and Fall of Nations from the perspective of nuclear power systems manufacturing: https://dickstormprobizblog.org/2023/08/15/the-rise-fall-and-rise-again-of-nations-and-the-realities-of-energy/
- Thomas J. Shepstone posting on Substack of, “Energy Matters If You Value the Life You Now Have and Don’t Want to Live Under Socialism
March 11, 2024: https://open.substack.com/pub/energysecurityfreedom/p/energy-matters-if-you-value-the-life?r=kv1a9&utm_campaign=post&utm_medium=email - Threats to the Electric Grid, March 15, 2024: https://dickstormprobizblog.org/2024/03/15/threats-to-the-grid-electricity-reliability/
- U.S. Electricity Prices by EnergyBot.com: https://www.energybot.com/electricity-rates/
- Richard Nielsen on Substack, “What is Energy” Mr. Nielsen shares my concern for informing the public on the true facts of energy and electricity generation: https://open.substack.com/pub/richardnielsen/p/what-is-energy-84e?r=kv1a9&utm_campaign=post&utm_medium=web
- Bloomberg, July 25, 2024 “Climate Crisis Old King Coal Remains Omnipotent and Omnipresent” Still Powering the World”: https://www.bloomberg.com/opinion/articles/2024-07-25/climate-crisis-old-king-coal-remains-omnipotent-and-omnipresent?utm_source=website&utm_medium=share&utm_campaign=linkedin?sref=5dj0X2VO
- IEA Coal Report, July 2024: https://www.iea.org/news/global-coal-demand-is-set-to-remain-broadly-flat-through-2025

Dick, Thank you for that, I am going to link it in my next article I write. It will help me explain some things.
Richard Nielsen
Project Manager
Extreme Precision Industrial Contractors
1540 Business Circle
Gillette Wyoming,82716
Tel: (307) 257-8174
Mob: (307) 756-2863
https://ep-industrial.com/
On Tue, Jul 2, 2024 at 2:01â¯PM Dick Storm’s Thoughts on Energy, Education,
LikeLiked by 1 person
We pray you stay
LikeLike